After what may have seemed like an eternity to all who have suffered coronavirus pain and death, with June at hand, America has witnessed 19 brutal weeks since its first coronavirus case was identified on January 22. But while these 19 weeks may seem like an eon, it is still the case that owing to high social media speed, actions taken to contain the virus have occurred in record time. When considering other pandemics, Brett Dalton and I found that in the case of SARS and H1N1, the 2002 and 2009 pandemics,
[F]ive months elapsed before the World Health Organization (WHO) and CDC issued global alerts. The Canadian Global Public Health Intelligence Network (CGPHIN) picked up information from Chinese message boards indicating a novel flu-like illness in November 2002. This information was not translated to English by the WHO and made available until January 21, 2003.
In the case of H1N1 [of 2009, just six years later], . . . the development of improved technology and related advances allowed for enhanced public health response times, more rapid genome sequencing, and advanced clinical trials and vaccine development and availability. Notably, clinical vaccine trials were underway within five months of the outbreak.
For coronavirus, vaccine trials are now taking place, just three months after the outbreak. Although Americans may understandably complain about testing and treatment delays, the world is in fact moving at record speed to contain the coronavirus and develop vaccine safeguards.
Still, along with those struggling on the medical front as well as the millions who have lost jobs and income, countless firms—large and small—have been pushed to the edge of bankruptcy and beyond. America is seeing record-setting efforts to counter the virus’s effects on the economy. Government and private action at all levels has been assisted by federal relief programs amounting to trillions of dollars. “Helicopter money,” which is to say cash, has been directly distributed to a vast cross section of families nationwide, and more than $2 trillion has been sent to seriously challenged airlines, farmers, hospitals, and municipalities and in the form of payroll-preserving forgivable loans to small businesses. The Federal Reserve (Fed), in cooperation with the US Department of the Treasury, has expanded its private-sector lending. All the stops have been pulled in an effort to keep the ship of state sailing. As a result of the fiscal and monetary actions, there are undoubtedly serious concerns to be considered regarding the nation’s yawning deficit as well as future prospects for high inflation, but I will save those issues to discuss in a future report.
In the past five months America has witnessed what happens when a massive economy running at full tilt is throttled deliberately and suddenly in the face of a pandemic. Starting with federal actions limiting international travel on March 13 and following California’s March 21 state shutdown, in a matter of weeks, each of the 50 states put restrictions in place on crowd-generating activities. Restaurants and bars were shuttered along with practically all other businesses except those providing goods and services deemed essential. State restrictions are now being relaxed, but for more than 30 days it was against state guidance for the majority of America’s workers to go to work. The negative economic effects are understandably massive.
No matter how shocking the economic reports being generated, Americans should not be surprised to see the record-setting spikes in the number of Americans added to unemployment compensation rolls each week, sharp declines in retail sales and existing home sales, falling freight shipments, and plummeting industrial production and durable goods numbers. But that said, there is nothing in Americans’ experience that prepares them to observe the unbelievable negative price for crude oil and speculate on its inflation effects.
This “Economic Situation” report focuses in the next section on the national economy and its 2020 prospects. America’s economy is now based primarily on virus-driven state and federal controls instead of market incentives, so this section of the report will draw on the shape of the virus count itself as it attempts to develop a GDP growth profile. Without question, the data to be considered lead to the conclusion that 2020 brings a recession-affected economy, which is to say that America will experience at least two consecutive quarters of negative GDP growth along with other hardship.
While the virus is a wicked driver, the effects of the world economic slowdown have sharply reduced demand for crude oil and energy while at the same time crude oil production has accelerated. The report’s third section examines what has happened to crude oil prices and what may eventually happen when prices stabilize. The report’s fourth section moves away from the pandemic and looks back to 1970 and the first Earth Day celebration. In doing so, the section describes how that first Earth Day inspired political forces that established a costly command-and-control regulatory template that continues to this day. Even this section offers lessons about prospects for regulation following on the heels of the coronavirus pandemic.
As with previous issues of the “Economic Situation,” the report then puts the spotlight on an important state economy. The state of Texas is featured with an analysis by Ethan Greist and Stephen Strosko. Finally, the report closes with two book reports drawn from Yandle’s reading table.
The Battered Coronavirus Economy
I start my focus on the US economy by remembering that a nation’s GDP growth results from just two activities: the growth in the number of people who go to work every day and the rate of improvement in their productivity. Add together those two numbers, and one calculates GDP growth. The concept is simple and powerful, but it is reflective of an economy that is driven by voluntary activities where people respond to prices, wages, profits, interest rates, and perceptions of opportunity. This is clearly not the economy America has today. As the Committee for a Responsible Federal Budget puts it,
The current economic contraction has been much sharper and more sudden than any we have seen before. In fact, the economic impact of COVID-19 has been more akin to a major natural disaster than a typical recession. In a natural disaster, an entirely external threat arrives suddenly and with little warning, bringing an abrupt and widespread cessation of economic activity as businesses close, services become restricted, and people largely shelter-in-place.
Then, on April 24 we received an assessment on how the coronavirus economy is doing. IHS Markit announced that its Flash U.S. Composite Output Index had fallen to 27.4, the lowest on record (readings below 50 indicate a contraction in activity). The index had stood at 40.9 in March. Commenting, IHS Markit Chief Economist Chris Williamson said,
The COVID-19 outbreak dealt a blow to the US economy of a ferocity not previously seen in recent history during April. The deterioration in the flash PMI numbers indicates a rate of contraction exceeding that seen even at the height of the global financial crisis, with jobs also being slashed at a rate far exceeding anything previously recorded by the survey.
Americans received another early warning of tough times ahead on May 28, when the US Department of Commerce provided its second estimate for GDP growth in 2020’s first quarter. It was −5.0 percent, the first negative growth rate since 2014. At about the same time, the European Union reported first-quarter GDP growth of −3.8 percent. Most likely, 2020’s second-quarter growth for both the United States and the European Union will take a much larger hit. There will be more discussion on GDP growth later.
The Rise of the Command Economy
Since the January arrival of the coronavirus, the US economy has increasingly become a command economy directed by governors, mayors, the president, and the president’s advisers. When certain work activity becomes illegal or contrary to public policy, attempts to forecast GDP growth using basic insights based on economic logic alone become futile, if not simply inappropriate for the problem at hand. Instead of focusing on major economic sectors (for example, construction) and considering population growth, interest rates, wages, and costs in an effort to determine what markets will deliver, economic forecasters are forced to try to determine the trajectory of the virus itself, the growth rate of new cases, and political responses that might allow an easing of restrictions on travel, work, and crowd-generating activities. Taking this approach simplistically leads to the notion that the trajectory of the nation’s GDP growth rate could look somewhat similar to the inverse of the coronavirus growth rate. When the virus victim count is rising at an increasing rate, GDP growth will be falling; when the virus path flattens, GDP growth will bottom out; and when the count of virus victims ceases to grow and turns negative, GDP growth will turn positive. This of course assumes a political response that relaxes the extent of command and control as the virus count falls.
There is evidence maintained by Johns Hopkins University that the five-day running average of new US cases appears to have been flattening around April 1. But more data are needed. Around April 1, of the top 40 countries on Johns Hopkins University’s coronavirus tracking system, only China showed a distinct flattening of the daily-case curve. As if taking its cue from the virus, China’s GDP growth rate turned south for 2020’s first quarter, hitting −6.8 percent, the first negative-growth quarter since the late 1970s. An optimistic assessment of the picture suggests China’s GDP growth rate is now zero or slightly negative.
What about US GDP Growth?
Perhaps while keeping an eye on the virus growth path, those brave enough to offer GDP forecasts suggest that 2020’s first half will show deep negative growth numbers, that the second half will record positive growth, and that the year taken as a whole is likely to record negative GDP growth. For example, a Wall Street Journalpanel of 60 economists predicted an average growth rate of −3.3 percent in 2020’s first quarter and −25.3 percent in the second quarter. The panel goes on to forecast 6.2 percent growth in the third quarter and 6.1 percent growth in 2020’s fourth quarter. I point out that this was before the US Department of Commerce announced the first quarter’s −4.8 percent growth.
Wells Fargo’s economic team calls for −4.8 percent GDP growth in 2020’s first quarter and −22.1 percent in the second quarter. The Wells Fargo team then expects to see 7.0 percent growth in the third quarter and 4.8 growth in the fourth quarter. Both the Wall Street Journal panel and Wells Fargo look for overall negative GDP growth for 2020. Organisation for Economic Co-operation and Development (OECD) economists indicate that the activities most directly affected by the coronavirus shutdowns (auto manufacturing, restaurants, hotels, and educational units) account for 30 to 40 percent of GDP in the advanced world. They believe that activity in these sectors will fall by 20 percent to 25 percent this year. For the United States, the OECD analysts predicted −4.0 percent growth for 2020. In late April, the Congressional Budget Office (CBO) offered its first 2020–2021 forecast since the virus outbreak. The CBO expects to see −5.6 percent GDP growth in 2020, followed by 2.8 percent growth in 2021. These estimates take into account the effects of multitrillion-dollar coronavirus relief packages and their effects on small and large businesses, local governments, healthcare providers, and others.
This leaves unanswered the big question: when will this coronavirus recession hit bottom and the economy begin to generate meaningfully positive economic activity? Accompanying this question is speculation regarding the shape of the recovery path. Will it be a V, U, W, or swoosh, which is, in the end, a U with a well-traveled bottom?
To speak to the first question, one first needs to see what the American public is doing with all the trillions of relief dollars that have been shipped out. This includes the “helicopter money,” the $1,200 per adult and $500 per child that has been sent out to a vast number of citizens, the Payday Protection Plan dollars that have been provided by the Small Business Administration, and the enhanced unemployment benefit checks that are now making their way into the pockets of the more than 36 million workers who have lost their jobs. The big question, then, is, Where is all that money hiding, if it is not being spent on retail sales?
Part of the answer is shown in figure 1. The chart shows month-over-month growth in retail sales, money in checking accounts (demand deposits), and money placed in savings accounts. The data show an explosive growth in deposits and savings and plummeting retail sales.
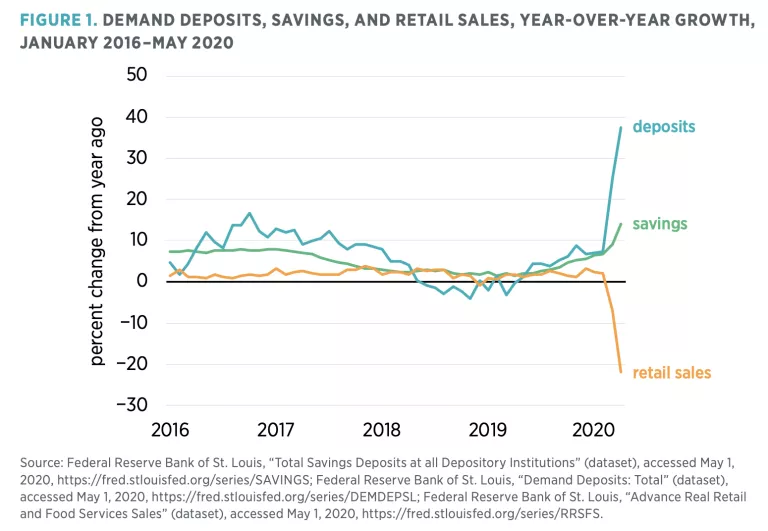
So people know where the money has gone—at least a large part of it. When will it begin to flow into the economy? (This is another way of asking about the shape of the recovery.) Unfortunately, there are no crisp charts or tables that put a spotlight on the answer to this question, but one can still speculate a bit. The answer partly depends on the extent to which state economies fully open. Americans are just now beginning to see some results from the early openers, but there is not yet sufficient data to say what the full-blown effects may be. And another part of the answer relates to all that money sitting in savings and checking accounts.
Economists over the years have developed theories to explain why people keep idle cash balances. Part of the explanation relates to interest rates: when investment returns are zero or almost negative, why go to the trouble to invest? Another part of the answer has to do with expected transactions that will require lots of money. If a large part of the public expects to be paying college tuition in the fall, for example, then all else equal, one would expect to see a surge in cash balances. Another part of the answer, and perhaps the most meaningful piece of the puzzle, has to do with precautionary demand for money. People stuff more money in the mattress, as it were, when they are anxious about what may happen, when life is uncertain, and when lots of people are losing their jobs.
So as we look back at the chart showing savings, deposits, and retail sales, we can picture changes that will occur if all the states open for shopping and spending, if there is no reversal of success in dealing with the coronavirus, and if employment begins to recover. As I see it, those three ifs translate into a U-shaped recovery, not a V-shaped one, and happier times for everyone in about the first part of 2022.
The 50-State Imprint
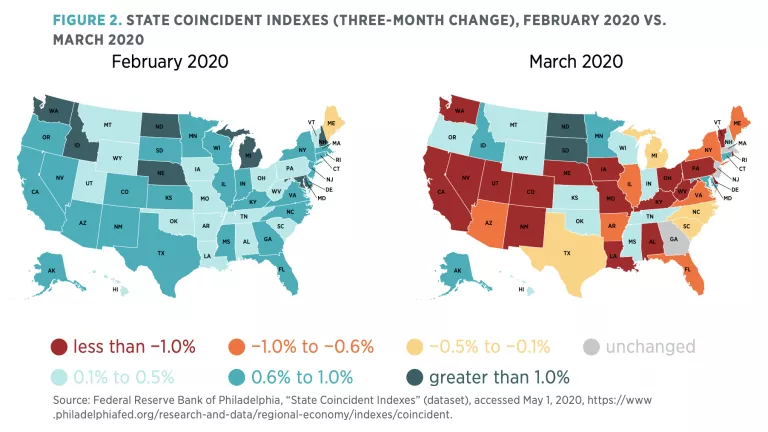
A picture of the pandemic’s effects on the 50 states is apparent when considering the state coincident indexes from the Federal Reserve Bank of Philadelphia (figure 2), which show the three-month change reported for both February and March. There are four variables used statistically to form the index. These are nonfarm payroll employment, average hours worked in manufacturing by production workers, the unemployment rate, and wage and salary disbursements plus proprietors’ income deflated by the consumer price index (CPI). Looking first at February and then at March communicates a dramatic one-month change. Here, I call attention to February’s comfortably positive 50-state picture: only Maine shows seriously weak data. By contrast, the March map reports fewer than 20 green-shaded states (states showing a positive outlook). The rest of the outlooks have turned negative. What a difference a month can make!
Oil, Gold, and the Coronavirus Economy
Since the United States–led shale oil revolution got rolling around 2008, OPEC’s strong-but-never-absolute power to set world crude oil prices has been threatened. Now in the midst of the coronavirus pandemic we are seeing another OPEC-inspired struggle in this vital market.
OPEC shakiness intensified as US petroleum exports expanded from 40 billion barrels in 2010 to 200 billion barrels in 2020. Meanwhile, by opening and closing the largest petroleum supply in the Arab world, Saudi Arabia attempted to steady the price of oil. At one point, around 2014 and in conjunction with Russia, the Saudis put a squeeze on US shale producers by pushing prices below what they believed to be shale oil production costs. US shale producers sat tight and kept on pumping, oil prices seemed stuck at a relatively low level, and drivers in my region of the United States enjoyed $2.50 a gallon gasoline.
Coronavirus and Oil Prices
As with everything else, the coronavirus’s tumultuous January entry changed petroleum markets. When China, the world’s second-largest economy and largest petroleum importer, faltered, crude oil prices fell, OPEC trembled, and Russia decided this would be the time to teach a final lesson to US shale oil producers.
In a matter of weeks, crude oil, which had been fetching $59 per barrel in December, fell to $50 in February. Gasoline in my town fell to $2.00 a gallon. In an effort to stabilize prices, Saudi Arabia gathered OPEC and Russian oil czars and called for orchestrated output reductions. All but Russia seemed to be in agreement. Russia, now riding with a huge sovereign rainy-day fund, said nyet. Instead of cutting production, the Russians opened their valves further. Then Saudi Arabia called Russia’s hand and raised it. The price of crude oil fell fast to $40 a barrel and touched on $30 in mid-March. Gas at my station hit $1.78 a gallon. From the consumer standpoint things got even better: in late April, the world had more crude oil being extracted than space to store it. Storage tanks were filled to capacity, and tankers were topped up too. At one point, the daily price went negative (but folks in my town have yet to pass out $20 bills when I fill my tank). We did see prices as low as $1.24 a gallon, and that’s a huge drop from $2.50 in six months.
The combination of coronavirus and OPEC-Russian sandbox antics put real pressure on US shale producers. They started turning off drills, began worrying about paying off debt, and pushed for a failed White House appeal for help. At the moment, crude oil prices are historically low, but that is destined to change.
The Oil-Gold Relationship
The data counterpart to the story just told can be seen in figure 3. Using Fed data for monthly gold and West Texas Intermediate crude oil prices from late 1990 through March 2020, I have built a series that shows the number of barrels of oil that can be purchased with an ounce of gold. Doing this enables one to avoid currency value changes and to see the world as an oil trader might.

Cheap oil and related energy products, such as natural gas, feed into lower prices throughout the economy, and lower price expectations lead to lower long-term interest rates. When economic life recovers in a postcoronavirus world and when Russia and OPEC end their price war, America will see higher inflation and higher interest rates. But with coronavirus woes behind us, we will also see higher real GDP growth.
Until then, I am of the opinion that oil is gradually losing its grip on the energy economy and that, combined with lower-cost shale production, the world will see a new normal where an ounce of gold will buy 30 barrels of oil. Even so, there’s a lot of distance between 65.6 barrels now and 30 barrels then. All of this also suggests that once America is beyond the effects of coronavirus and the related recession, it will see higher-priced oil and I will see $2.50 gasoline at my station. But in the meantime, we will also see some deflationary effects of all this. As figure 4 indicates, growth in the CPI is driven at least partly by growth in the price of oil for the period January 1980 through March 2020.

Earth Day 50 Years Later
For some time now, pundits have suggested the United States is more divided than ever. The matter lacks mustering of empirical proof, and I would suggest otherwise. Divided now? Perhaps. But just 50 years ago the nation was sharply fractured by three major social forces, and this at a time of an ongoing Cold War with Russia. It was in this environment on April 22, 1970, that something encouraging—Earth Day—was born, an event that inspired millions but which, in an odd and unexpected way, led to a squandering of some of the promise of the burgeoning environmental movement.
Yes, 50 years ago, there were bitter struggles over Vietnam and what would ultimately and sadly be 58,000 American lives lost in a struggle that seemed to go nowhere. Protesters were in the streets, hippies were challenging the status quo, and marijuana and LSD use were on the rise. Added to this cauldron of chaos, the nation was struggling in an extended effort to implement civil rights legislation and related Supreme Court rulings that were ending segregated schools, universities, and public life.
Yes, progress toward important legislative goals was being made, but the journey was still a fractious one. And adding to these two massive forces dividing the nation, a budding environmental movement was about to emerge suddenly into a major national force—one that would inspire pitched battles between industrialized cities, states, and regions and highly concerned environmentalists.
A Peaceful Demonstration That Involved Millions
But unlike some American protests and counter protests, America’s first Earth Day—organized by Senator Gaylord Nelson (D-WI)—blossomed forth peacefully on April 22, 1970, with a massive showing of demonstrations that involved 20 million people and more than 10,000 public schools across some 1,000 communities. Inspired by Senator Nelson but organized by grassroots volunteers as a national teach-in, Earth Day unexpectedly became a watershed event that marked the beginning of a new environmental era.
As is said, there is a time for all things; 1970 was the time to start Earth Day celebrations worldwide. By 1990, 184 countries were celebrating this special day.
The numbers of people involved and the widespread calls for federal action were more than any serious national politician could ignore. At the time, Senator Edmund Muskie (D-ME)—chairman of the Senate Air and Water Pollution Subcommittee and an aspiring candidate for president also known as “Mr. Clean”—was writing the nation’s first Clean Air Act. Legislation that would form the Environmental Protection Agency was also in the works. Consumer advocate Ralph Nader, famous for his use of university students in pursuing policy reform, was an outsider in the mix for the nation’s highest office, and incumbent President Richard M. Nixon was eager to win another term of office.
Most people recognized that Vietnam and civil rights would require lasting attention, but Earth Day forced these very different leaders and presidential aspirants to address additional challenges. In the political struggle that ensued, command-and-control regulation—demonstrably the most costly way to achieve environmental goals as well as the easiest way to cartelize industry—became the template that characterizes American environmental law to this day. Command-and-control was typically a top-down, one-size-fits-all form of regulation that relied on engineering standards that, more often than not, imposed stricter requirements on new plants and businesses than existing ones. Attracted by the certainty implied by this form of regulation, environmental leaders lent their enthusiastic support. Operators of existing polluting firms liked command-and-control, too. They hoped to see regulation raise rivals’ costs.
Choosing How to Regulate
In Senator Muskie’s committee work leading up to Earth Day, staff and Senate leadership sensibly concluded that setting performance standards—essentially pollution reduction goals that would have to be achieved—would be the regulatory approach taken in the new national air- and water-quality legislation. Setting goals and imposing stiff fines and punishment for failure to perform would leave it up to individual polluters, firms, and industries to determine just how they would go about meeting the goals.
Creativity would pay off, good old American competition would drive the various actors to discover lower-cost ways to meet fixed goals, and the federal government would become the impartial guardian of the environment, not an engineering design-and-approval enterprise.
Muskie’s committee had moved to performance standards after considering command-and-control engineering standards that would have to be met uniformly across each and every major source of the nation’s pollution. The committee members and other senate colleagues had also considered the use of emission fees and taxes. Although making polluters pay to discharge waste in rivers and streams had worked for decades in German and French river basin associations with astounding environmental successes, opposition sensitive to the notion that anyone could pay to pollute eliminated consideration of that approach.
The pressure to regulate brought congressional leadership to disregard the rich opportunity to enrich common law, which had powerfully protected environmental assets for centuries. With common law, no person had the right to impose costs on parties downstream without permission. Except where statutes had shielded polluters from common-law suits, state common law had reduced water and air pollution even across state lines. The elimination of this protection by legislative action was a serious problem that could have been eased by federal action, but this was not to be.
Performance standards would have been the American approach, most likely, had it not been for the combination of Earth Day and presidential politics. At an Earth Day celebration in Philadelphia, Ralph Nader challenged Senator Muskie, accusing him of being soft on polluters because of his concern for reducing the costliness of the pending national program. After all, Nader reasoned, the polluters were the evil ones. Make them pay. Unable, perhaps, to get across the point that what’s costly for polluters ultimately costs just about all of us, Muskie’s position on the matter pivoted. His committee revised its position. Command-and-control ruled the day.
President Nixon Seizes the Day
But this is not the end of the story. Mr. Nixon and his advisors were watching all this as they laid plans for the Nixon reelection campaign. Amazed at the Earth Day turnout, the Nixon team huddled with the president and decided that President Nixon would become the “Environment President.” He would provide the appropriate Earth Day response by creating the US Environmental Protection Agency and by pushing for more command-and-control regulation. And he did.
Earth Day 50 years ago inspired forces that forever changed the world’s treatment of environmental assets. Across the half century since then, significant regulatory changes have occurred, but with few noteworthy exceptions, the command-and-control template still dominates America’s regulatory approach. Yet while environmental quality has been enhanced markedly, the presence of command-and-control has made the environmental journey slower and more costly than it might have been otherwise. In spite of this, Earth Day 50 years ago demonstrated what can happen when, in a free society, a nation’s attention becomes focused on newly recognized scarcities that must, somehow, be dealt with.
We are now struggling with coronavirus and reams of state regulations that affect how and where people work, shop, and travel. Once again, it seems, command-and-control is the order of the day. Whether we will make a full escape from the command economy remains to be seen.
State Spotlight: Texas
Ethan Greist
Research Associate
Mercatus Center at George Mason University
Stephen Strosko
Data Engineer, Policy Analytics
Mercatus Center at George Mason University
Each quarter, we select one state and analyze its economic and regulatory outlook. Last quarter, we put Idaho in the spotlight. This quarter, we focus on Texas.
Texas is unique in the United States. It has the second-largest state economy and population (after California) at $1.8 trillion and 29 million respectively, with a truly massive $265 billion per year in exports (easily beating California’s $172 billion). If Texas were a sovereign state it would have the 10th-largest economy in the world, right before Canada and after Brazil. Texas’s economy is not only large but growing. Texas was the fastest-growing state economy in 2019, with a 4.4 percent increase in GDP. For Texas, the components of this growth were a boom in oil in the past two years undergirded by strength in other sectors as a result of an attractive business and labor environment.
The natural wealth of Texas is reflected in the dominance of primary industries including cattle ranching, cotton, and oil. The state leads all others in livestock farming, farm acreage, and oil production, though oil production is the only industry that accounts for an oversized portion of the state’s economy. Since the end of the 20th century, Texas has shifted beyond these primary goods sectors to diversify into other industries. Retail trade, wholesale trade, banking and insurance, construction, chemical manufacturing, and high-tech electronic and aerospace manufacturing all have a significant place in the Texas economy.
Indeed, when measuring Texas industries by value added, the top five industries are oil and gas extraction, finance and insurance, manufacturing, wholesale and retail trade, and professional services. Livestock and agriculture are far down the list. Texas also employs a larger portion of workers in these sectors than does the nation on average. Manufacturing accounts for 13 percent of the state’s output and employs 7 percent of its workforce (both values are near the national average). Chemical, computer and electronics, and petroleum manufacturing are the three largest manufacturing sectors by revenue, respectively. By employment, however, computer, aerospace, and pharmaceuticals are the biggest manufacturing sectors.
The prevalence of high-tech manufacturing and export in Texas helps to significantly raise its “new economy” rankings, which measure how prepared each state is for emerging industries in the 21st century. Texas’s advantage at attracting new businesses is also on display, with a high relative proportion of new firms and IPOs and a high rate of firm turnover and level of venture capital.
On the education front, Texas scores below average on many metrics. Despite Texas’s above-average 93 percent high school graduation rate, its workforce is less well educated than the US average, with 30 percent having a bachelor’s degree or higher. In fact, the workforce as a whole has a higher proportion of those who never finished high school than the US average.
The discrepancy between high school graduation rates and degree holders is easily explained by migration. This includes not only migration from Central and South America, but incredibly high levels of migration from other US states. Between 2010 and 2017 the population of Texas increased from 25.2 million to 28.4 million. Numbers from 2018 and 2019 suggest a continuation in that trend, resulting in a 15.3 percent increase in population since 2010. Of that increase, a staggering 950,000 new residents are estimated to have come from other US states. This isn’t merely a factor of Texas’s size either. Other large states such as California, Illinois, and New York saw a decrease in population growth and migration from other states in the same period, with Illinois actually suffering from a net decrease in residents. Because of these factors, low workforce education numbers could be interpreted as a sign of strength as migration continues to drive a booming labor market in oil, tech manufacturing, wholesale trade, retail trade, and construction.
In 2019, real GDP growth in Texas was 4.4 percent, the highest in the country. This is the culmination of a trend of quarterly real GDP growth of between 4 percent and 5 percent since the beginning of 2018. The main driver of that growth is the oil industry, which accounted for 1.4 out of the 4.4 percent increase. In total, about a third of Texas’s recent economic growth can be attributed to oil. The other two-thirds—contributing a still very impressive 3.0 percent annual GDP growth rate—was driven by growth in manufacturing, wholesale trade, retail trade, finance and insurance, professional services, healthcare, and construction. This shows that the Texas economy, while greatly reliant on the oil industry, is ultimately undergirded by strength in a wide diversity of sectors.
Strong GDP growth and a variety of strong industries have resulted in Texas having its second-highest real income growth rate since 2008 (2.8 percent annualized), a median household income that has grown significantly from 2008 to $60,000, a 3.5 percent unemployment rate as of February 2020, and a GDP per capita of $60,000 (2012 dollars), the highest of any state outside of New England or the West Coast. While median household income in particular is similar to the national average, the growth in all numbers reflects the underlying strength of the Texas economy.
Texas’s Regulatory Outlook
Texas’s regulations are published online and can be found on the Texas Secretary of State’s website. The state’s code is referred to as the Texas Administrative Code (TAC). There are currently 17 titles in the TAC, which cover a range of topics from education to cultural resources. State RegData, a tool of the Mercatus Center at George Mason University used for quantifying regulation at the state level, presents data for Texas from 2018. The tool reveals that there were 14.9 million words in the TAC in 2018. And while it would take more than 21 weeks for a person to read all this, State RegData, which uses Natural Language Processing and machine learning, can analyze the text in minutes. One finding of the analysis is that in 2018, the TAC had 226,898 regulatory restrictions. Regulatory restrictions are terms that are legally binding in nature, including shall, must, may not, required, and prohibited.
Title 16, “Economic Regulation,” had the most regulatory restrictions, at 33,689, followed closely by title 30, “Environmental Quality,” at 33,5469. Titles containing environmental regulations tend to be large in most state regulatory codes. However, a title labeled as economic regulation is quite unique. Upon further examination, title 16 seems to contain regulations for a variety of areas including railroads, public utilities, alcohol, racing, lottery, and others.
In addition to finding the amount of regulatory restrictions in the TAC, the most recent addition of State RegData associated each restriction with an industry in the North American Industry Classification System. The most regulated industries in the TAC were found to be chemical manufacturing (12,593 regulatory restrictions), food manufacturing (9,267), animal production and aquaculture (5,391), ambulatory healthcare services (4,324), and crop production (3,972).
The Mercatus Center’s FRASE Index ranks the degree to which a state’s economy is affected by federal regulations. The FRASE Index ranks Texas as experiencing the 11th-highest impact of federal regulations out of all 50 states and the District of Columbia. This higher ranking most likely owes to the large mining, quarrying, and oil and gas extraction industry area in Texas, as these industries are disproportionately targeted in the US Code of Federal Regulations.
Conclusion
There is somewhat of a riddle to Texas’s economic growth and seemingly business-friendly economy. A wide range of “best states for business” style rankings place Texas at the very top. The tax and policy environment is often cited in these rankings. There is no statewide income tax, property tax, or corporate income tax. However, there is a gross receipts tax on corporations, a 6.25 percent sales tax on individuals, excise taxes on a number of goods, and quite high local property taxes. Overall the tax burden, at 8.18 percent, is only slightly below the national average. Other oft-cited factors in these rankings such as “economic climate,” “economy,” or “access to capital” are the results rather than causes of economic growth. The regulatory environment is widely said to be quite business friendly, yet our measures suggest otherwise. Finally, and perhaps most telling, the Texas “workforce” and “labor environment” are widely cited as factors in its success.
Maybe the state’s labor policy is the key factor. Texas has the freest labor market of any US state. It is a right-to-work state with low unionization rates, no minimum wage, and no mandatory workers’ compensation laws. This, paired with a diversity of strong industries, could be a somewhat blunt but simple explanation of Texas’s economic strength.
Yandle’s Reading Table
Each quarter I review books for readers of this report to consider. Sometimes I focus on something hot off the press. At other times, I review an old book that just happened to come to my attention. I begin this time with an older book that just happened to come to our house as a result of our being a part of a Little Library operation. Dot and I help maintain four Little Libraries where individuals can take as well as add books to circulate. At times, we have on hand a large stack of donated volumes that run the gamut from trash to treasure. When I scanned The Fords: An American Epic, a 1987 book authored by Peter Collier and David Horowitz, I felt certain that I had found a treasure. Anyone who loves business history and stories about capitalism and America’s industrial revolution will enjoy this book. And if one gets sparks from learning what can happen when large buckets of money flow through the hands of ordinary mortals, transforming them into Dr. Jekyll and Mr. Hyde characters, then this book will be even more special.
One gets a clue about this last point when seeing that the book has two distinct parts—after all, the book is about two distinct people. But part I is titled “Crazy Henry” and is about Henry Ford I. He was the mechanical and enterprise genius who invented his way into commercial success and, upon getting to capitalist glory land, became enamored with things as sadly connected as Nazi Germany and dedicated anti-Semitic crusades and passionate attempts to broker peace in the heights of World War I. Part II is titled “Hank the Deuce,” after Henry I’s eldest grandson, who was eager heir to the family business, or kingdom, as the Deuce liked to think of it. Perhaps, if Henry II had named his part of the book, he would have called it King Henry II, which is how he sometimes described himself.
The book tells how, with unrelenting hard work and endless struggle and with the dedicated and endless support of his wife, Clara, the first Henry’s manufacturing genius enabled him to quickly build one of America’s largest fully integrated manufacturing operations, to systematically take cost-cutting actions that made his famous Model T affordable for ordinary people in all walks of life, and by doing so, to become one of America’s richest men. But going from farm tinkerer to auto mogul did not happen without encountering major bumps and struggles, many of which were of his own making. For example, readers learn of the founding Henry’s early effort to make Ford Motor Company the best place to work in America, how he provided healthcare benefits, built hospitals for his workers, and in an inspired moment set his starting wage rate at double the national average. Doing all this led Ford to have one of the nation’s most productive workforces, one that enjoyed low absenteeism and turnover, and which enabled expanded production of lower-priced cars.
Then, when challenged by union organizers, Ford turned on a dime, practically went to war with labor organizers, hired goons to fight back the union, and ultimately lifted one of the leading brass-knuckle managers to become second only to him in running the country. As the authors explain, the ruthless attempts by Ford’s strongmen to manage the company constantly interfered with efforts by top executives to design and build better automobiles. Meanwhile profits fell, new capital investment did not occur, and with the arrival of World War II, the company literally began to teeter on bankruptcy. It is then that Henry II receives an early out from the US Navy so that he can grab the wheel and steer the firm in a new direction. Stories about Henry II’s arrival, the hiring and empowering of professional managers, including Robert McNamara and his whiz kids, who were most recently modernizing management of the US Department of Defense, make for some of the book’s best storytelling.
Never skirting around discussions of the Ford family’s social and domestic life, the authors provide plenty of detail fit for National Inquirer. There is plenty there, for both Henry Fords. But the book’s sad and almost never-ending underlying theme relates to the relationship between Henry I and his son Edsel, and Edsel’s rise to president of the family firm—without ever being the last word man, yet always struggling to steer his father’s firm in a more modern and profitable direction. And so, as much as anything else, the book is about a family struggle between the elder Ford, Edsel, Edsel’s son Henry II, and other family members. The story has more than its share of jubilation, crushed dreams, great successes, and lessons that never seem to be learned about how massive amounts of wealth that can energize equally massive socially beneficial outcomes can at the same time erode the moral foundations that seem necessary for longer-run prosperity to be kindled.
I now turn to something just off the press. When Nelson D. Schwartz’s 2020 book The Velvet Rope Economywas recommended to me, I first thought this would be another book about America’s “us vs. them” divided economy and that I would find yet another treatment of the recent growth in income inequality. Well, it turns out that I was correct. But the reading experience was quite positive. Let me explain. Yes, The Velvet Rope is about the divided economy and income inequality, but the treatment is about how business firms, marketers, and even public schools have tried to make the most of the opportunity to serve the large number of super-rich Americans who are willing and able to pay a lot for exclusive, top-of-line consumption and recreational experiences. Put another way, the book is more about practice than policy, though there is indeed some heavy policy discussion toward the book’s end. But there is a dark side to what I just said. And it depends on which side of the velvet rope one is situated. It’s one thing to have exclusive access; it’s something else to be excluded, depending on how that exclusion is done.
In laying the groundwork for his well-written series of stories, which are much like case studies, Schwartz explains how economists first discovered the profit-enhancing opportunity of segmenting markets for the same goods and services and charging different prices in the various segments. In this part of the book, readers get a good account of the work of 19th-century French engineer Jules Dupuit, who developed price discrimination techniques for train services and electricity and in doing so enabled those industries to charge higher average prices—higher in some segments than in others—and thereby expand and serve a larger number of consumers. Schwartz tells how Dupuit’s pioneering work was then advanced in 1933 by Harvard economist Edward Chamberlain.
Having laid out the theory, Schwartz quickly applies it to the cruise ship industry. Here one gets details on how savvy cruise ship operators have learned to build separately enclosed and higher-priced luxury decks that provide top-of-the-line bedrooms, chef-inspired dining, exclusive casinos, and luxurious exercise facilities and swimming pools that cannot be accessed by folks who enjoy another cheaper—but still, for them, outstanding—experience on the lower decks. By meeting the demand of two or even more market segments at markedly different prices and sometimes separating the segments with velvet ropes, ship operators have significantly increased profits.
But as Schwartz explains, one must be very careful about how the velvet ropes are installed and maintained. Yes, the segments must be separated, but the separation must be gently and quietly operated. Indeed, it is best when the hoi polloi hardly notice that the luxury decks are operating. Schwartz notes that when the separation is blatant, folks in lower decks will feel that they are second-class citizens and may leave the cruise less happy than when they started. Put another way, successful price discriminators must understand what it takes to make members of each segment believe that they are special folks, that they are indeed pampered members of the leisure class.
Schwartz offers several highly applied examples that detail the rise of the velvet rope economy and how the rope can be productively and not-so-productively utilized. Airline ticket pricing for different levels of accommodation makes for interesting reading. People have all experienced walking through first class on the way to the economy section, noticing the happy souls who are enjoying their first glass of wine and other treats. Yes, we knew there was first class, and yes, we chose to economize. But what if airlines carefully placed entry doors so that the economy folks did not have to traipse through first class, but simply made their way to their own deck, so to speak? Schwartz suggests that different spatial arrangement can lead to happier passengers and perhaps more revenue. He also points out that some—well, at least one (Southwest)—airlines have done away with business class and first class and manage entry on a first-come, first-served basis. They have done away with rope entirely.
But I found another of his examples to be most interesting. This was because I was unaware of the extent to which the velvet rope had entered public school education. The application here has to do with the extras that some public schools try to provide to families during times of shrinking budgets and growing enrollment. Music, marching bands, band uniforms, and senior trips are examples that could also include physics and calculus courses. With budgets cut, it is not uncommon for public schools to require pay-to-play for the school band as well as to charge fees for what might be called top-drawer educational experiences. In these situations, pay-to-play is a common feature of high school athletic programs, where in some cases, a family may be paying $2,000 per child for participation in major sports. The fee pays for the coach, for uniforms, and for travel to out-of-town games and tournaments.
Talented students whose parents may be unable to pay are sometimes assisted with funds raised by booster organizations and the school PTA. Schwartz tells about school districts that just happen to have high schools in rich and poor neighborhoods alike, where the higher-income community raises millions to fund all kinds of extras for students while the lower-income community is unable to match the effort. Here we see an example of a highly visible and not-so-pretty velvet rope that can generate larger community ill will and political pressure to limit opportunities across all the schools. We also learn about remedies that have been devised where high-revenue-raising booster clubs and PTAs are required to share part of their take with lower-income schools in the same district or state.
The Velvet Rope provides some insights into how and why income inequality may have become such a contentious issue in recent years, and Schwartz offers some thoughts on how the heat surrounding the issue might be turned down. While this is interesting and useful to learn about, his treatment of more fundamental remedies to the income inequality issue is far less creative. He offers the same old remedies: raise taxes on the super-rich, lower taxes on low-income folks, raise capital gains taxes, and find effective ways to redistribute income.

