As one examines the slowing midyear economy, one sees the results of a perplexing mix of major economic forces. As an analogy, multiple large boulders are hitting the economic lake, and each one is creating waves and turbulence. The US economy, after rebounding from the COVID-19 pandemic in 2021 thanks to massive deficit spending and low-interest-rate monetary policy, is now showing negative real growth and delivering record-breaking levels of inflation while bringing much less in terms of personal income growth. At the same time, the economy is being shocked by rising energy prices that result partly from the Russo–Ukrainian War. And one more boulder to fall in the economic lake is China (the world’s second largest economy) imposing lockdowns in major population centers in an effort to control a COVID-19 outbreak. This adds another dose of uncertainty to US export prospects as well as limiting improvements in the uneven flow of imports to US ports.
Indeed, just since January, the prospects for global GDP growth for 2022 and 2023 as seen by the International Monetary Fund have been revised downward to 3.6 percent for both years, which is a cut of 0.8 percentage points for 2022 and 0.2 for 2023. I should point out that on April 18, the World Bank reduced its 2022 world GDP growth estimate from 4.1 percent to 3.2 percent.
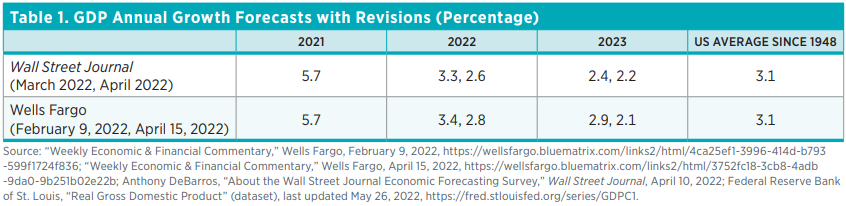
Despite the US economy tallying 5.7 percent real GDP growth in 2021, disposable personal income growth turned negative in March 2022. And with the Bureau of Economic Analysis announcing −1.5 percent GDP growth for the first quarter, two quarters of negative real GDP growth (the necessary ingredients that define a recession) are now a clear possibility. These less-than-optimistic expectations were reinforced when the Institute for Supply Management (ISM) reported its April manufacturing index with a reading of 55.4—that’s still greater than 50, which means growth is present, but it is 1.7 percentage points less than the March reading and the lowest since July 2020, at 53.9. One should note that the negative GDP growth estimate was driven largely by uneven flows of US imports that brought a large trade deficit in the first quarter and, because of shortages of chips and other goods, by the inability of US retailers to build back inventories, especially in the auto sector. Some of these same forces undoubtedly affected the ISM reading on manufacturing.
Inflation is very much here, and it is no longer considered to be transitory or industry specific. In March, Americans saw the largest increase in the Consumer Price Index since 1981, 8.5 percent on a year-over-year basis for all items, with the price of gasoline ticking up 18.3 percent from the previous month. The Personal Consumption Expenditures price index rose 6.6 percent year-over-year in March, giving three consecutive months of 6.0 percent growth or better. The March growth in these two inflation indexes is greater than the increase in wages and salaries for the same time period. On average, American workers are getting poorer. In an attempt to determine the extent to which inflation is industry specific, driven by supply chain disruptions, or systemic, the Federal Reserve Bank of New York found that inflation became predominantly systemic in the spring of 2021; this finding suggests inflation is a monetary phenomenon, not simply a matter of the pandemic or energy supply disruptions.
As I have mentioned in earlier reports, America suffers from the Frankenstein’s monster economy created by policies taken to ease the tragic effects of the pandemic and the Russo–Ukrainian War, as well as by later actions that target specific political objectives, such as the half billion dollars announced in 2021 to expand US meat processing and the recently announced $3 billion in taxpayer money to incentivize US electric auto battery production.
The possibility that America may experience a recession later in 2022–2023, but not now, is enhanced by the fact that, in an effort to quench inflationary fires, the Federal Reserve is hitting the monetary brakes, raising short-term interest rates (sending signals that more such action is on the way) and allowing its balance sheet to shrink as maturing bonds are not replaced. When one adds to this the horrors and disruptions of the raging Russo–Ukrainian War, which like all wars is destroying precious human and other resources, and COVID-19 surging again in China, the overall picture becomes rather bleak. Even so, all things considered, I believe the United States can expect positive real GDP growth for 2022 and 2023, but at levels much lower than 2021’s 5.4 percent or the historic average of more than 3.0 percent.
In table 1, I show the revised GDP growth forecasts for 2022 and 2023 provided by the Wall Street Journal and by Wells Fargo. As indicated, the just-described combined negative forces caused both forecasters to lower their numbers significantly. There is an old saw that says, “If you can’t forecast well, you must forecast often.” But the changes one observes now indicate something else. No one can forecast well in a world where massive changes in major economic forces are under way.
Even So, I Am Still Optimistic about the United States’ Future
A few weeks ago, I happened on a book in my library that was given to me by a friend in 1980. By Robert Muller, a dedicated career United Nations official and native of war-torn Alsace-Lorraine, devastated by World War II, the book’s title says it all: Most of All, They Taught Me Happiness. But it was the first sentence in an introduction by Norman Cousins that caught my attention: “At a time when it is intellectually fashionable to declare that the entire metabolism of history has gone berserk, it is heartening to meet a man who not only is completely free of nihilism but who also can articulate the compelling reasons for believing that the cause of civilization is not beyond human intelligence.” On reading this, I recalled the Middle East turmoil, Arab oil embargoes, and US wage and price controls, but I wondered to myself what else was going on in the late 1970s and early 1980s that would create such pessimism?
To answer my question, I used 1980 as a benchmark and looked around in that neighborhood of time to see what was happening. In 1980, President Jimmy Carter, to little effect, had just imposed an embargo on the export of US grain to Russia because of Russia’s late 1979 invasion of Afghanistan, a neighboring country that seemed to be drifting toward free markets and democracy. The United States also led a boycott of the 1980 summer Olympics in Moscow, which was supported by more than 60 other nations. Sounds familiar, doesn’t it? On another troublesome front, Iran was holding more than 50 US hostages.
In 1978, the year Cousins wrote his introduction, inflation was hitting 7.6 percent; it rose to 13.5 percent in 1980, versus 8.0 percent now. As a result, in 1980 a 30-year fixed-rate mortgage was fetching 14 percent, versus 5 percent now. And by the way, in 1980, real per capita personal income stood at $25,000, versus $54,000 now. Oh, yes, the 1980 Dow Jones Industrial Average stood at 963, versus the current 32,000–33,000. GPS first became available in 1980, and CNN first went on the air that year. It was also the year the federal government bailed out Chrysler and required young men to register for the draft because of Russia’s Afghanistan invasion. In a few words, things didn’t look all that rosy in the late 1970s and in 1980, but they got a lot better, at least in some important ways.
As a nation, since 1980, America has done far better than survive. It has prospered. Thinking about all this is enough to make one an optimist!
How This Report Is Organized
Heavily influenced by the major policy responses to the before-noted shifts in world economic forces, this report’s next section offers a discussion of the Russo–Ukrainian War’s influence on the price of oil and gasoline at the pump. In an effort to provide an economic measuring rod that might help one determine when things are getting better or worse, the section looks closely at what has happened to the price of oil, gold, and gasoline at the pump, drawing a comparison between those prices on February 23, the day before the invasion, and later. Unfortunately, the discussion does not enable one to predict when peace may come to that troubled part of the world, but the measuring rod developed does show the extent to which world markets are adjusting to the war.
After that, the report focuses on an effort announced by the Biden administration to unclog the nation’s ports and, by doing so, hasten the movement of goods shipped from China and the rest of the world to satisfy consumer demand. This section looks closely at data on COVID-19 policy actions that expanded consumer demand and how markets attempted to respond. This section suggests that the problem faced by US ports is not about the ports but about pandemic spending policies.
Before offering our section on US regulatory policy, the report looks at some improving world data on carbon emissions and asks if America really needs a Green New Deal. The data suggest that market forces are delivering significant improvements. The next section, authored by Stephen Strosko, reports on some exciting new developments from the Policy Analytics Project at the Mercatus Center at George Mason University. This is the project that pioneered development of data and techniques for measuring the growth and complexity of federal and state regulations. Strosko reports on federal regulations for 2021. Finally, the report ends with a visit to Yandle’s reading table and a couple of book reviews.
Russia, Ukraine, Oil, Gold, and Gasoline
Americans are horrified by the images of Russia’s tragic Ukraine invasion, the killing of innocent people, and the wanton destruction of cities and structures representing seemingly eons of effort to erect. But at a more mundane level, ordinary people with relatively tight budgets have to pay to keep the family pickup truck running and heat homes and businesses. The price of gasoline at the pump gets to be an important indicator of whether life is improving or getting worse, at least at the margin.
In the week before Russia’s February 23 Ukraine invasion, the US average price of unleaded gasoline was $3.53. The price had been rising for months owing partly to significant increases in driving following the end of pandemic lockdowns. A week later, the average price of gasoline was $3.61 and rising; it stood at $4.09 on April 18, in spite of efforts by the Biden administration to lower the price by releasing massive amounts of crude oil from emergency reserves, announced on March 31.
Looking for an Economic Measuring Rod
To determine the state of the turmoil in Russia and Ukraine, one turns to social media, newspapers, and television. At best, however, one cannot really see from one day to the next if things have improved. Strangely, given the profound nature of the situation, the prices of gold and oil—and how they translate into gasoline prices at the pump—give a market-based insight about how deeply disturbed the world may be.
Because of its high value, portability, and acceptance in markets large and small, gold is sometimes called the disaster hedge. Those fleeing a war-torn area, for example, often take gold coins or dust.
Look at a few snapshots of quickly changing prices. Gold fetched $2,066 an ounce on March 8—the highest price since 2020. This was up $150 an ounce, or 7.8 percent, from $1,916 on February 23 (the day before Russia invaded Ukraine). On March 9, with sanctions placed on Russian oil by the United States and United Kingdom, gold closed at $1,993, dropping about 3 percent from the previous day. For now, the market hints that unease is leveling off. On April 29, in interday trading, the price was $1,866.
Changes in oil prices convey valuable information about the availability of a crucial resource and can inspire energy-conserving innovation and rerouting of substitutes. On March 8, crude oil was fetching $128.00 a barrel on the Chicago Mercantile Exchange, up from $92.80 (an increase of 38 percent) on February 23, the day before the invasion. Obviously, world petroleum markets were far more disturbed by the invasion than were gold markets. On March 15, the early morning price was $92.33 a barrel, slightly below the February 23 price and down substantially from the March 8 reckoning. On April 29, with the war accelerating in eastern Ukraine, crude oil prices hit $105.
How Many Barrels for an Ounce of Gold?
Regular observers sometimes look at the number of barrels that can be purchased with an ounce of gold. Doing so avoids problems with changing currency values and acknowledges that international oil traders may prefer to think in terms of gold, rather than dollars, euros, or rubles.
From 1990 through 2015, this measurement fluctuated around 15 barrels of oil per ounce of gold. Things changed after 2015, when a major innovation in US fracking entered the picture. From there, oil got cheaper, and it has averaged around 20 barrels for an ounce of gold. But on March 8, the ratio came back down to 16.1, well below the 20.6 that could have been purchased on February 23. With the yet-to-be-announced but expected release of massive amounts of crude oil from emergency reserves in the western world, things apparently began to improve in petroleum flows, and on March 15, an ounce of gold fetched a bit more than 20 barrels. As horrible as things looked otherwise, one was getting a positive signal on the prospects for better petroleum prices and, one hoped, an early end to the war. But then, sadly, as Russia tightened its war focus on eastern Ukraine, on April 18, an ounce of gold fetched just 18.4 barrels. For US consumers, on April 22, the average US price of gasoline stood at a lofty $4.18 a gallon.
Of course, gas prices are driven by more than just the price of crude. Other factors include refining capacity, transportation, spring revisions in the formula required by the EPA for major urban regions, and controls on the amount of ethanol required or allowed by the EPA as a gasoline additive. These and state gasoline taxes interact with market forces to give consumers the number they see on the pump. Put another way, there are lots of moving parts to the story. And most of them are moving. So although the oil-for-gold measuring rod can’t reveal everything—or even scratch the surface of the full human toll of an invasion—it does remove some of the guesswork from complex market shifts and reveal trends. Obviously, the war picture is constantly changing, but so are prices.
Is Relief for the Nation’s Pandemic-Stressed Ports Really Needed?
News that the Biden administration has dedicated $450 million of newly approved infrastructure spending to improving and unclogging US ports at first blush sounds like a good idea. After all, people have seen pictures of hundreds of ships waiting at the Port of Los Angeles for weeks to be unloaded, and a lengthy process of port improvement may turn out to be a good idea. But whether or not that’s the case, politicians are responding to an artificial surge in port activity that they inspired when trillions of newly printed dollars were spread across the nation to offset pandemic-induced harm. Let’s take a closer look.
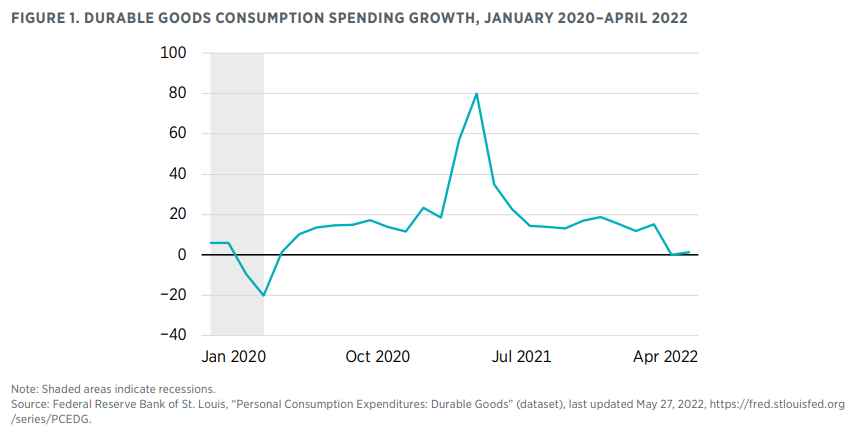
Since the onset of the COVID-19 economic disruption, the American economy has experienced an unprecedented scenario. It was stopped in its tracks by the 2020 shutdowns and then, while still partly shuttered, hit by a surge of fresh dollars that were shipped out to consumers and firms nationwide. In 2020 and 2021, with places to shop and spend limited by COVID-19 restrictions, consumers did what consumers do best. They tried to spend their newfound dollars where they could. They rushed to auto dealers, furniture stores, and appliance shops and purchased new cars, trucks, and appliances. The nation experienced a never-before-seen surge in spending for durable goods.
The result of this is seen in figure 1, which reports year-over-year growth in consumer durable goods spending for the US economy. An expansion mountain, which peaked when spending rose by 80 percent from the same month a year earlier, is seen resting in the middle, around April 2021. The increase is especially large because it includes the rebound from the reduction in spending due to much of the economy being shut down in spring 2020. As anyone who’s read my analyses knows, this was a time that coincided with the accumulation of stimulus dollars in consumer bank accounts.
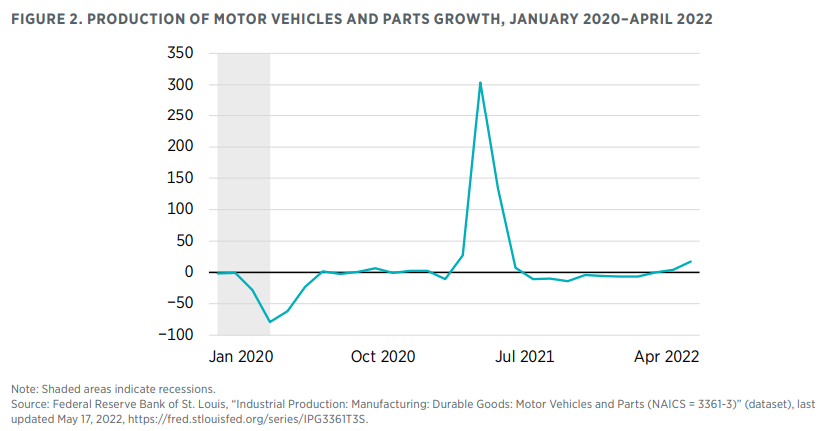
As might be expected, American producers of durable goods tried to respond to surging demand by producing more goods and then shipping them to market. Figure 2 reports the growth in production of motor vehicles and parts for a similar time period. Note that production in April 2021 was 300 percent higher than production in April 2020. All of this increase reflects the rebound from the shutdown of motor vehicle production in spring 2020. Little wonder that there was a sudden shortage of microchips and other automotive inputs.
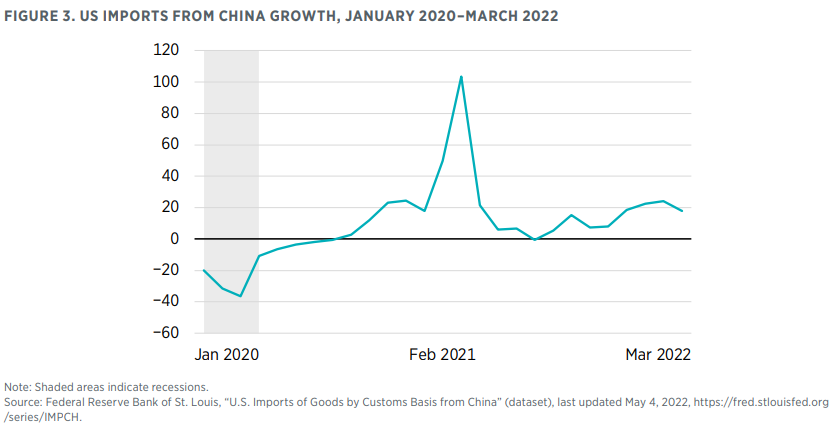
Just as domestic producers struggled to meet unprecedented increases in the demand for their products, international producers also joined the effort. Of course, China is a major producer of consumer goods for the American market. And yes, Chinese shipments have to make their way through US ports. Figure 3 reports the increase in shipments of goods from China to the United States for 2020 through March 2022. Notice the 100 percent surge that peaks around—you guessed it—April 2021. As earlier, much of this increase was due to the rebound from the large decline in imports during spring 2020.
Surges in demand heavily stressed the world’s ability to satisfy America’s newfound hunger for consumer goods. Suddenly, it seemed, there were just not enough people willing to work or drive trucks. Of course, generous unemployment benefits and other payments may have had something to do with this.
And strangely, the world’s ability to produce chips somehow no longer worked well enough—or so it seemed to those looking for easy answers and narratives.
And yes, just as suddenly, America’s ports and infrastructure suddenly seemed out of date and disabled.
All of this and more led to situations that form the lifeblood of professional politicians. There were new weekly COVID-19 pandemic crises that called for action from the nation’s leading elite. Something had to be done, and only the federal government could do it. Hardly anyone pointed to the fact that many of those crises were the result of past actions taken to deal with the tragic effects of the pandemic. Maybe, just maybe, the passage of time and the adjustments being made by individuals in the marketplace would bring more meaningful healing.
Yes, American ports will be improved, and some of them need it. But while the physical improvements are being made, the economy will still be recovering from both the pandemic itself and an artificially stressed economy. Americans are also treating a roaring inflation hangover, which also came from the flood of dollars that fed the surge in spending.
One just hopes that the proposed remedies for congested ports don’t turn out to be worse than problems that were on the way to being healed by market forces.
Who Needs a Green New Deal?
On March 21, the Securities and Exchange Commission (SEC) announced a major regulatory initiative that calls for listed firms to provide detailed data on environmental risks, including the performance of the firm itself as well as indirect effects that could include its suppliers and ultimate disposal of waste. In a sense, the SEC is catching up with what’s already happening, and it is maybe going too far, as regulators tend to do. Thousands of firms are already reporting their environmental impact in response to investor demand.
More broadly, progressive politicians continue to call for green revolution. By way of subsidies, carbon taxes, and top-down, command-and-control regulation, proponents of the Green New Deal seek to eliminate coal-fired electricity production, finally sunset the use of fossil fuels, and energize a carbon-free economy by 2030. Embracing the objective but not the date, President Biden has called for zero carbon by 2050. But while green revolutionists anxiously hold forth, perhaps wondering if the world will heed their message in time to avoid pending environmental disaster, some of the world’s major carbon emitters have made remarkable progress. The United States is one of them. Let’s take a closer look.
Yes, regulation surely matters, and yes, the relative costs of different fuels matter a lot also. But added to this is the powerful investor-communicated demand for cleaner production and environmental accountability. Many investors do not want to put their cash in polluting firms. Mutual funds that hold shares of those firms, as well as many consumers, are steering their dollars in the direction of products provided by greener firms.
For more than a decade now, Presbyterian College economist Jody Lipford and I have tracked carbon emissions for the United States and 12 of the world’s other largest economies. In 2021, we examined data for the years 1950 through 2019 and found that US carbon emissions peaked in 2005 at 6,132 million metric tons before falling to 5,285 million metric tons by 2019.
The peaking and decline, which would seem to be good news for those seeking a Green New Deal, came largely as a result of cheaper natural gas, which displaced coal as a dominant fuel for producing electricity, along with the sharply falling cost of solar energy.
We also found total carbon emissions had peaked and are declining for France, Italy, Japan, and the United Kingdom, and that there was a strong movement in that direction for Canada. This is not the case, however, for Brazil, China, India, Mexico, and South Africa.
There are, of course, a multitude of policy actions that have been taken by countries and smaller political units worldwide in an effort to bring down carbon emissions. These include subsidizing production of electric vehicles, implementing cap-and-trade programs that require major emitters to offset emission growth, and placing taxes on carbon emissions. These efforts and growing investor demand for reduced carbon emissions have led to large growth in what are termed ESG (environmental, social, governance) mutual funds that attempt to place strict standards on the environmental performance of firms they include.
ESG asset flows are expected to reach $41 trillion by the end of 2022, with US investors taking the lead. BlackRock, the world’s largest fund manager, has reported some $7 trillion in various environmentally sensitive holdings, which include the shares of firms that have embraced zero-carbon goals.
Efforts by institutional as well as individual investors to assess the environmental record of corporations listed on major exchanges have led, in turn, to more new regulatory actions intended to set standards for and improve the quality of information reported by firms.
But let us not kill the goose that lays the golden eggs. Instead of burdening firms with heavier regulatory reporting, government should encourage the emergence of private credentialing, like Standard & Poor’s or Moody’s, that would rate corporations on their environmental performance. Already, it seems, the world is outrunning the politicians.
Demand for environmental quality is real, and it is bringing carbon reductions, along with new technologies for monitoring and measuring environmental impact and a growing industry that specializes in providing carbon emission offsets. In short, the market process may actually be delivering its own version of Green New Deal. Maybe people should be paying closer attention.
RegData Regulatory Spotlight: An Update to RegData US
Stephen Strosko
Technical Director, Policy Analytics Team, Mercatus Center at George Mason University
United States Federal RegData, often referred to as RegData, is the most influential data project produced by the QuantGov team at the Mercatus Center. First released in 2012, RegData fills the research gap that limited efforts to explore the relationship between regulations and economic outcomes. Economists knew that regulations had real economic effects, but without a way to measure the regulations themselves, it was nearly impossible to draw any conclusions about the effect of regulations on an economy. RegData solved this problem by providing a baseline count of regulatory restrictions (legally binding terms such as shall and must) and is organized via a series of machine learning algorithms that determine the sector(s) of the economy that the restrictions effect. Ultimately, the availability of these data has led to an entire area of research and to meaningful regulatory reform around the world.
The QuantGov team is excited to announce the release of RegData US 4.1. Version 4.1 adds an additional year of regulatory data: 2021. In 2021, the US Code of Federal Regulations (CFR) contained 1,094,447 regulatory restrictions. This is a 1.10 percent increase from 2020. A 1.10 percent increase is below the average 1.97 percent increase in restrictions since 1970. However, when looking at recent years, a 1.10 percent increase is a tick up from the Trump presidency, which saw a 0.18 percent yearly increase in regulatory restrictions on average.
In addition to yearly data, the QuantGov team tracks the daily data on regulatory restrictions. Figure 4 shows data from the RegData US Regulation Tracker. Two trends appear that are not obvious in the yearly data, and they tell a different story about Joe Biden’s presidency than do the yearly data.

First, regulatory restrictions decreased significantly toward the end of 2021 and the beginning of 2022. It is unclear if this decrease was caused by the enforcement of Executive Order 13771 (the “two in, one out” order) signed by President Donald Trump or if the decrease was caused by policy decisions made by the Biden administration.
Second, regulatory restrictions sharply increased between November 10, 2020, and December 31, 2020. These regulations are most likely “midnight regulations” from the Trump administration. The period between the presidential election in November and inauguration in January often produces a major spike in the number of rulemakings being pushed through the regulatory process by outgoing presidents. Rules made in this period have been dubbed “midnight regulations” because they are hurriedly passed before the “clock strikes 12” and the president turns back into an ordinary citizen. With a full picture of the 2020–2021 transition in hand, the Trump administration does not appear to be an exception to the midnight regulations trend.
The new release of RegData US also allows users to examine regulatory shifts at the federal agency level. Some notable shifts over the past year took place at the US Department of Defense, which had a larger percentage decrease in regulatory restrictions than any other agency, at −5.44 percent. The Occupational Safety and Health Review Commission also saw a large decrease, at −3.88 percent, as did the Federal Mediation and Conciliation Service, at −3.06 percent. A few notable movers on the side of increasing regulatory restrictions include the EPA at 2.46 percent, the Library of Congress at 13.83 percent, and the Board of Governors of the Federal Reserve System at 3.80 percent. Forty-four different federal agencies increased the number of regulatory restrictions under their purview, significantly more than the 15 agencies that decreased their restriction counts.
This version of RegData US once again has other useful features, such counts of regulatory restrictions that apply to particular industries and information about the complexity of the language used for specific regulations. These metrics allow for both high-level and granular analyses of regulatory trends. For example, Shannon entropy, a common metric used to measure the complexity of language, is calculated for each piece of regulation in the RegData suite. Since 2003, the CFR has become less complex, with the average Shannon entropy score dropping from 8.144 to 7.852 over that period. At the granular level, title 50, part 17 scores as the most complex document. Given that this piece of regulation lists thousands of animals by their taxonomical names, this finding provides some useful insight! To download the new release of RegData US, users can interact with the QuantGov API, the interactive downloader, or the bulk downloader.
Yandle’s Reading Table
At first encounter, Vivek Ramaswamy’s Woke, Inc. comes off as a tour de force on wokeness and a newly recognized level of corporate engagement with the body politic. Early in the book, the author underlines stakeholder capitalism as a major concern in all this. He says, “there’s a new invisible force at work in the highest ranks of corporate America, one far more nefarious (than just inefficiency). It’s the defining scam of our time—one that robs you of not only your money but your voice and your identity.” Sounds frightening, doesn’t it? Well, maybe not frightening, but given the current controversy between the state of Florida and Disney regarding the firm’s strong public opposition to proposed laws limiting the teaching of LGBTQ behaviors in the public schools, the topic is clearly timely.
Ramaswamy is speaking of the move made by corporate leadership to embrace and espouse wokeness. To get started on his literary journey, the author helpfully defines what he means by “woke”: “Basically, being woke means obsessing about race, gender, and sexual orientation. Maybe climate change, too." He adds, “today more and more people are becoming woke, even though generations of civil rights leaders have taught us not to focus on race or gender. And now capitalism is trying to stay woke too." A highly successful biotech entrepreneur with multiple exposures to America’s elite himself, Ramaswamy confesses to being traitor to his class. How so? Because he, a bona fide member of the group he attacks, attempts to explain how American corporations embraced wokeness for one main reason: to make money. I should add that Ramaswamy’s analysis fits the reported findings of a Harvard Law School study of outcomes that emerged from recent corporate takeovers. Although corporate leaders talked woke, their takeover strategies seemed to accept plant shutdowns and worker layoffs as necessary for increasing profits and executive pay.
But further reflection suggests that his identification of a new class of corporate woke peddlers as forming a threat to democracy seems to overlook centuries of corporate lobbying, supporting candidates and political parties, and pairing up with environmental and other socially concerned groups to form “bootlegger and Baptist” coalitions that use politics to line the pockets of corporate citizens. In a way, Ramaswamy is saying that in the past decade, bootleggers have become Baptists, and so have a lot of other people and groups. But is it just the woke peddlers that threaten democracy? What about the “buy America” cheerleaders and the “drill, baby, drill” promoters? Is it just the Left? Ramaswamy’s well-written book makes one wonder. Still, as he develops his story, the case he is making becomes stronger. After all, stakeholder capitalism has now infiltrated and affected universities, what and how they teach, and the worldviews of their students.
The book’s 15 chapters carry the reader across territory that explores how leading Goldman Sachs executives became interwoven and engaged as top government officials and how, in the author’s view, the notion of stakeholder capitalism began, ascended, and yielded a new government-ordained corporate voice that took sides in and influenced major policy debates. A discussion of current voting rights legislative battles in the states, especially in Georgia, and the oscillating positions taken by Delta Airlines and Coca-Cola in condemning the proposed Georgia legislation is particularly interesting. In this context, the author, who is also a Yale-trained lawyer, carefully distinguishes between the Hobby Lobby controversy, which involved one firm’s effort to contest a federal requirement that violated the owner’s religious beliefs, and the efforts of major corporations to take a political position for the purpose of affecting the broader community and nation.
The book’s treatment of the rise of a large niversityy bureaucracy dedicated to diversity and other woke issues is particularly noteworthy. Yes, the bureaucracy is large, and yes, student tuitions pay for it, just as they pay for every other feature of university life, but the issue here is not just about cost and perhaps inconvenience; it is about the rise of an all-pervading culture that affects how maturing young people interpret life and what they may seek to do in an effort to make the world a better place. The reader may be persuaded that not many graduating university students will proudly say, “I want to start a business so that I can have the pleasure of building an enterprise, producing something of value, hiring some folks, and making a good living for myself and my family.” More likely, the reason is, “I want to work for a nonprofit that is dedicated to building a safer and cleaner world while eliminating unfair outcomes.”
It is with this concern that the author offers a concrete recommendation for countering what he believes to be wokeness’s serious distorting effects on the future. Put simply, the author calls for a national service requirement for all young people, to be satisfied in the last two summers of their time in school. Modeled after Franklin Delano Roosevelt’s Civilian Conservation Corps, the service requirement would engage young people in doing real work on real problems. In effect, the participants would invest sweat equity in efforts to make their nation a better place. In doing this, participants would gain a common sense of citizenship and perhaps a better awareness of what it takes to make things better. Of course, in the previous 14 chapters, the author explains why his proposal would not be accepted politically. After all, the woke culture would have a hard time giving up wokeness for community service.
Ramaswamy has provided a noteworthy discussion of tribal behavior in America, where virtue signaling has become a highly developed art form. Anyone who reads it will think differently about what it means to be woke.
Matt Ridley, noted zoologist, member of the House of Lords, and former editor of the Economist, has done it again. The perennial author of excellent books, including my all-time favorite, The Rational Optimist, Ridley, in his 2020 book How Innovation Works and Why It Flourishes in Freedom, takes the reader on a story-filled review of innovation that both Adam Smith and Isaac Newton would love. The book begins by noting that, thus far, humanity’s most meaningful technical innovations have focused on energy and work related to it where the laws of thermodynamics pretty well dictated outcomes. These energy and work-related innovations have propelled an industrial revolution that began in the 18th century and continues to this day. This sort of discussion would thrill Newton.
But these breakthroughs have not been the result primarily of dramatic discoveries made by hermit thinkers working alone in labs and caves. They are more often the gradual, incremental result of market-driven group interactions that have yielded dramatic changes in how resources are employed to produce larger flows of goods and services that ultimately improve well-being, and Adam Smith would have loved this insight. Studiously avoiding the “great man” theory of innovation breakthroughs, Ridley assures the reader that, generally speaking, there is always what might be called an adjacent point on the supply curve of new products waiting, sometimes briefly (if at all), for the right conditions to emerge.
As already mentioned, Ridley makes frequent reference to the laws of thermodynamics and logically begins his discussion with a chapter on energy. He moves on to public health, then to transportation, food, and low-tech improvements. He covers communications and computing and, with the reader, explores prehistoric innovation, which includes the rise of agriculture, the domestication of dogs, and most important of all, to my way of thinking, the invention of home cooking. Ridley notes that the ability of early humans to gradually switch their common menu to cooked meat enabled the growth of the brain, the frontal lobe, and thus provided the cradle for thought and all future innovation. Cooking over friendly fire also gave rise to the hearth, home, family, and storytelling.
With that, and drawing on lessons gleaned from the stories, the reader is introduced to some key revealed innovation essentials. In some cases, these go against commonly held opinions on the topic. For example, Ridley emphasizes that innovation is gradual, involves trial and error, and is not dominated by sudden breakthroughs. He also reminds readers that luck—i.e., serendipity—plays a large role in the process and that innovation is a team sport.
As in his other famous works, Ridley offers lots of refreshing insights. For example, science is often born from innovation, not the other way around, as in the case of steam engine development, which led to advances in the understanding of thermodynamics, and in the case of how the practical discoveries made in the building of flying machines preceded almost all understanding of aerodynamics. It is at this point that Ridley reminds the reader of the parallel between tinkering and innovating and man’s tendency to barter and trade that laid Adam Smith’s foundation for the rise of markets. As Ridley sees it, and as other researchers have verified, most innovation arises from the factory floor or from within commercial establishment, not from within the halls of ivy. Even the discovery of DNA, Ridley points out, was aided significantly by the commercial development of X-ray crystallography that had arisen with the British textile industry.
Although Ridley’s market-emphasizing innovation story gives reason to be optimistic about future progress that will enable more to be produced with less, he does not conclude with a happy chorus about the future. Instead, the optimist wannabe is left with bootlegger and Baptist concerns about the tendency of modern governments in richer nations to be heavily focused on reducing risks and regulating life to limit experimentation and the trial of new technologies and processes. Instead of being seen as a refreshing enterprise, if that is possible—and Ridley doubts the possibility—government is seen as a retardant to the long-running pageant of progress that past innovation has made possible.
Listen to a conversation with Bruce discussing this Economic Situation Report on the Mercatus Policy Download here.

