With 2022’s first quarter still taking shape and in spite of the tragic outbreak of war between Russia and Ukraine, the US economy is showing a strong rebound from pandemic-related shutdowns and the consequent deep recession. The economy has reacted to massive federal spending increases; supply constraints; somewhat chaotic world economic forces; and a persistent, uncertainty-laden COVID-19 pandemic. Along with all this, Consumer Price Index (CPI) inflation—the result of the massive spending combined with stubborn supply chain issues—is now running at 7.5 percent with little sign of easing any time soon. Now with the Federal Reserve (Fed) committed to calm inflation, a goal made more lofty by the Russia-Ukraine war’s effects on commodity prices, the economy seems positioned to continue growing at a solid pace.
In 2021’s third quarter, real GDP growth hit 2.3 percent, much lower than the 6.5 percent growth registered in the second quarter but closer to what can be thought of as normal. First estimates for 2021’s fourth quarter, released on January 27, were a sizzling 7.0 percent, making third quarter’s weak growth look like an anomaly. The high growth was driven largely by strong consumer spending and businesses replenishing inventories. Annual real GDP growth in 2021 will probably be 5.7 percent, the strongest performance since 1984, when, again, the economy was on the rebound from a serious recession.
Looking further ahead and taking account of the Fed’s plan to slow the economy, Wells Fargo predicts that US real GDP growth will be 3.4 percent in 2022 and 3.0 percent in 2023; the Wall Street Journal calls for 3.3 percent growth in 2022 and 2.4 percent in 2023; and the International Monetary Fund expects to see 4.0 percent and 2.6 percent for 2022 and 2023, respectively. These estimates, along with data for average real GDP growth since 1948, are shown in table 1. As indicated, the US economy is expected to perform at about its historic average.

Real gross output (RGO), which is another important measure of overall economic activity and which includes transactions across the full domestic supply chain, including intermediate goods that are used in producing final products, not just final value added, rose 4.4 percent in 2021’s third quarter, following 19.5 percent growth in the second quarter. RGO is more volatile than GDP but may give a better reading on the zigs and zags of industrial activity. Both measures help to show the difficulties faced by economic agents who are trying to plan production and new investments in a highly unstable economy.
Frankenstein Is Still Here
Yes, America still has what I call a “Frankenstein economy,” meaning that policymakers continue to stitch together rules and actions—some temporary, some not—that seek to define the limits and direction of economic activity. These include shutting down oil exploration on federal land—now reversed by court action—accelerating antitrust action that focuses on the behavior of major social media firms and others, new rules that will regulate cryptocurrencies, transfers of federal funds to states that are yielding some massive budget surpluses, mandates for COVID-19 protective wear across major sectors—altered partly by Supreme Court action—and acceleration of agricultural programs designed to enhance meat production. All of these and more cause the Frankenstein economy to move more or less gingerly and in altered directions. Still, the economy has a force of its own, driven by the decisions and actions of countless purposely motivated individuals and organizations. The economy’s extraordinary ability to roll with the punches continues to impress me.
How This Report Is Organized
This report contains some changes that I hope will make it more interesting and useful to readers. Yes, the report’s main body still examines major economic topics and issues, but faithful readers will see that the State Spotlight section, which focuses on the economy and features of one US state, has been replaced with a section by Stephen Strosko and Thurston Powers on regulation. This new section draws on the extensive research occurring in the Mercatus Center’s highly recognized Policy Analytics project. Each quarter, this new section will report on ongoing work designed to help people understand the effects of regulations not just in the United States, but in other countries.
The report’s next section continues to focus on the national economy, inflation, and reactions to inflation that were featured last quarter. Inflation earns its continuing place on the marquee because actions taken to counter erosion of purchasing power will likely bring serious challenges as this year progresses. This discussion addresses monetary policy actions that are the origin of inflation (after all, the definition of the word is derived from an inflated supply of money) and then expands on what to expect in the months ahead. Any increases in interest rates that might be needed to control inflation can have profound effects on the federal budget, because of massive deficit spending and accumulated federal debt, making it difficult for ongoing government activities to continue unaffected.
A discussion of the White House response to higher prices and the price level and possible changes for trade policy follows the section on inflation. This section explain how politicians may gain by calling on the Federal Trade Commission (FTC) to investigate firms and industries that are raising prices and how changes in trade policies always generate winners as well as losers in the domestic economy. Finally, the last section in the report’s main body brings some good news regarding rising entrepreneurship and small business growth. Driven partly by reactions to the pandemic and always by necessity, lots of people who dropped out of the labor force, or were forced out, have opened businesses.
The report winds down with the new section on regulatory studies followed by two book reviews.
The Inflated Economy: The Monetary Chickens Have Come Home to Roost
News that the January 2022 all-item CPI has risen 7.5 percent since January 2021 and that the companion Producer Price Index was up 9.7 percent for the same period put to rest any ideas that inflation was beginning to wither away. What consumers in grocery stores and filling stations have known for months, politicians now had to grudgingly admit: the cost of living is going up, far faster than average wage increases will cover.
It feels a little late in the game to call inflation “transitory.” On average, typical Americans are getting poorer, at least until government rescue payments are figured into the picture. Perhaps this is one of the reasons that President Joe Biden’s popularity ratings have fallen.
Looking through the Money Lens
But whereas White House commentators point to capitalist greed, climate change, and producer collusion as explanations for the higher price level, those who look at the economy through a monetary lens saw inflation coming months ago. For example, in February 2021 Florida State University economist Jim Gwartney wrote an analysis titled “This Time, We’ll Have Inflation, and Here’s Why.” Gwartney focused on the trillions of newly printed dollars that had entered the economy since COVID-19 first reared its ugly head and showed how those trillions would later give birth to inflation. Around the same time, Johns Hopkins University economist Steve Hanke reported a similar analysis and made an inflation forecast that turned out to be quite accurate. In February 2022, Steve Hanke and Nicholas Hanlon reported on work that examines 60 years of data and finds an indisputably strong relationship between growth in the money supply and inflation.
Monetary academics know, as do laypeople, that it takes time for people to spend trillions of newly acquired dollars. And folks who have worked for a living in relevant fields know that sellers, in trying to get more goods on the shelf more quickly to accommodate increased consumer spending, often face higher costs and try to increase prices in order to keep the ship afloat. More money in circulation enables them to do this with greater ease.
Taking a Look at Some Data
I show a crude form of this relationship between time, money, and inflation in figure 1, where, using Fed data, I plot the year-over-year percentage increase for US demand deposits—money in Americans’ bank accounts—and the monthly CPI. The data are for January 2019 through November 2021.

As indicated in the figure, things get interesting long about March 2020, when the pandemic hit hard and the Trump administration shipped out lots of newly printed money. The level of demand deposits, reflected by the yellow line, rises suddenly and then grows apace as additional cash shots in the arm are injected by President Donald Trump and later by President Biden. But what about inflation? The figure shows CPI acceleration that begins to respond about one year after the action in demand deposits. As can be seen, inflation accelerates and continues to do so right up to the present moment.
What about the future? When will the inflation end? This simple analysis shows the growth of demand deposits weakening in recent months, which hints that inflation could diminish when the amount of money in Americans’ pockets is back to normal—around, say, 2023’s first quarter. But that will only hold if the Fed slows down the printing press. Meanwhile, keep your seatbelts fastened.
How Consumers May View the Temporary Income Surge
There is one last lesson to be learned from the January CPI report. Viewing inflation by way of expenditure categories, one can see that its pace was higher for goods than for services. For example, the 2021 CPI was up 12.2 percent for new vehicles, 12.0 percent for groceries, 40.0 percent for gasoline, and 2.5 percent for medical care services. As it turns out, sales of autos in the United States surged more than 100 percent in April and May of 2021, and consumers increased appliance purchases by 140 percent. In the same period, exports to the United States from China shot up more than 100 percent. There is little wonder that supply chains and ports of entry became stressed during this time. Indeed, pressures like these had never been experienced before.
There are lots of pieces to the puzzle that may explain these differences. One relates to economist Milton Friedman’s “permanent income” hypothesis. According to Friedman, one should distinguish between income viewed by consumers as temporary and income viewed by consumers as permanent.
A permanent income increase, or at least an increase that is perceived as permanent, causes consumers to raise consumption levels—and perhaps witness price increases—across a broad range of goods and services. Temporary income increases, such as a one-time stimulus check, may cause consumers to think about replacing major appliances, upgrading the family pickup truck, or replacing the porch furniture while maintaining permanent income-derived spending habits.
To sum things up, when one looks at the latest inflation data, there is one way in which efforts to deal with the pandemic have been costly for all consumers, not just those who lost work and had to rearrange their lives. The politicians were correct when they said the vaccinations would not require payment and that money in the bank would help make life a little easier for a lot of Americans. But later, when confronted with evidence of rising prices, there was more than just a tendency for political leaders to lay the blame on the Organization of Petroleum Exporting Countries, China, or greedy capitalists. Their own culpability with the monetary printing presses didn’t come up much.
Now it seems the monetary chickens have come home to roost.
So What?
Individuals whose salaries, wages, and Social Security payments are automatically adjusted for inflation have much less to worry about than their neighbors who are on fixed salaries, are facing ballooning grocery bills, and are paying 40 percent more to fill up for the daily commute to work than they did a year ago. On these grounds, inflation may be devastating for some and almost meaningless for others. In a few words, there are differential effects that get larger as inflation increases. Put another way, inflation is a cruel tax that should not be disregarded by those who can do something about it. There is yet one more worry to consider: inflation can be a burden for people who live in states with graduated income taxes and find themselves hit with a heavier tax bill that results from their inflated income. Seven states have no broad-based income tax, and three have a flat-rate income tax, but the rest have rates that rise with income.
Although inflation’s harmful distributional effects can be serious and should, if possible, be avoided by political policymakers, there is yet one more serious matter to consider: the rate of inflation gets captured in interest rates that borrowers must pay, especially for longer-term debt. Common sense says that lenders hope to be paid back with at least as much purchasing power as they had before lending. If inflation is ticking away at 4.0 percent, one expects to see interest rates rise with expectations that inflation will continue. In effect, credit market participants have to guess what that rate will be. In any case, higher interest rates mean higher interest costs to be paid annually on all forms of public and private debt. As a result, mortgage rates rise, all forms of construction suffer, and businesses postpone making large investments in plant and equipment.
Consider the public debt, especially the federal debt that ballooned from large deficits in recent years. (I note that, for 2020, federal revenues were $3.4 trillion, and spending was $6.6 trillion.) Interest on the national debt in 2008 was $253 billion and remained at about that level through 2015. Even though the debt doubled in those years, sharply falling interest rates and low inflation worked to contain the interest cost of the debt. But that was yesterday. Today, America has higher inflation and rising interest rates, perhaps with more to come. For 2021, the Congressional Budget Office (CBO) estimates interest cost of public debt was $413 billion. Obviously, each dollar spent on interest is a dollar that cannot be spent providing government benefits and services to taxpayers.
What about the future? Worse or better? Looking ahead, the CBO estimates interest costs on the debt will rise with higher interest rates and continuing deficits. For 2026, the interest rate on the 10-year Treasury note is predicted to be 2.6 percent, versus the current 1.5 percent, and interest on the debt is predicted to be $524 billion. For 2030, if, according to CBO projections, the 10-year note interest rate rises to 2.8 percent, interest costs will hit $829 billion. That’s real money. Just to put $829 billion into perspective—in 2020, the United States spent $714 billion on defense, $769 billion on Medicare, and $914 billion on all nondefense discretionary spending. Back of envelope calculations suggest strongly that some of these other spending categories will have to give if inflation-driven interest costs rise to the CBO-predicted level.
Final Thoughts
The United States is experiencing an inflationary surge caused fundamentally by the injection into the economy of trillions of dollars without any accompanying production of goods and services that might be purchased with the new dollars. Rising demand and troubled supply are causing costs and the price level to rise. The inflationary forces will be here until the stimulus dollars work their way through the economy and the federal government stops printing more money. Inflation is painful to large categories of people and beneficial to only a few. When inflation becomes captured in rising interest rates, people who borrow must cut back, husband resources, and find ways to conserve cash. As the inflationary process continues, government itself—the source of inflation in the first place—will face hard choices when confronted with high interest costs that go with past deficits and rising debt. And that, as they say, is when the rubber will hit the road.
High Prices, Money for Nothing, and the New Stance on Trade
With the price of a gallon of gasoline at the pump up more than a dollar in the past 12 months and destined to continue rising as the Russia-Ukraine war unfolds, and with consumers fuming about inflation, President Biden chose early on to follow the typical political strategy: blame the problem on gasoline producers and sellers and call on the FTC to investigate the industry for possible price gouging. Putting the industry in the spotlight will call attention to the billions of dollars oil companies are making, humiliate executives for earning so much, and remind ordinary people far and wide that the government will bring relief. It’s good politics. Now, of course, Russia can logically be blamed for making gasoline even more expensive.
Most likely, when all is said and done, the FTC’s investigation will generate some long reports and testimony and identify some anomalies in the pricing data. But in the end, it will show that what America has is a problem of supply and demand.
Calling the FTC Cops
Yes, America has seen this Shakespearean tragedy before, but not always with an ordered FTC investigation. A few weeks ago, rising meat product prices were the burr under Biden’s saddle. Before that, during the Trump era, it was drug prices that had to come down; Canadian wood and dairy prices that needed to go up; and production of aluminum, steel, ventilators, and automobiles that needed fixing.
Long before all this, back in the Reagan years, it was congressional concern about life insurance pricing that led to an FTC investigation. And in the Carter years, it was unhappiness with funeral home pricing and car dealer marketing tactics that led to FTC investigations and rulemakings.
Indeed, the political response to perceived market inequities is so commonplace that regulatory scholars have given the process a name. The late law and economics scholar and FTC official Fred McChesney described it ass a way for politicians to get “money for nothing.”
Let me explain. Politicians need campaign contributions if they are to gain and keep office. Businesses and industries can benefit from government action and need to hold on to earnings as much as possible so that they, too, can keep their places in the sun. A new threat to regulate from inside government itself brings a predictable lobbying response and expenditure. To avoid costly regulation and endless infighting, businesses make political contributions so that the politicians will do nothing. For example, at the moment, high technology firms such as Amazon, Facebook, and Google are under the gun following threats from politicians to impose new antitrust restraints on them. In 2021, Google spent $9.6 million on lobbying expenses, up 27 percent from 2020. In 2020, Amazon, Apple, Facebook, Google, and Microsoft spent a combined $61 million on lobbying activities. The variation in expenditures across firms appears to relate roughly to the extent to which particular firms or activities are currently being targeted for legislative action.
Working the Legislative Trenches
It is well known that, reaching back to John D. Rockefeller’s political battles, the petroleum industry has been a seasoned Washington player. Making regular campaign contributions is standard fare for the industry. The same is true for many other industries. The continual flow of political payments may be thought of as an effort not just to get some new beneficial laws passed, but to avoid the passage of laws and regulations that will prove harmful to the industry. Businesses have every reason and incentive to do this, and they are used to public scrutiny. But one should not always view the political showmanship involved as anything more than it is.
At times, one sees money being spent for nothing; at other times, the funds are spent for something. Meanwhile, politically savvy presidents can look consumers in the eye and say without blinking that they have the people’s back and will put all the power of the federal government to work—night and day—to bring needed relief to today’s pressing problems.
A New Stance on Trade: Shifting from Tariffs to Quotas
During the October 2021 G20 gathering in Rome, the Biden administration celebrated revisions to trade restrictions imposed by the Trump administration on steel and aluminum imports from China, Europe, and most of the rest of the world. But before grabbing confetti and champagne, people should acknowledge that the change will ultimately strengthen participating governments’ hands with importers and exporters. It is not a return to the more open market economy that was present earlier.
Recall that the recent tariff surge started in 2016. A self-styled “Tariff Man,” President Trump saw himself as America’s gatekeeper. He was not reluctant to limit the flow of goods across US borders and tax American consumers by way of tariffs, even as he took pride in successfully reducing other taxes. Trump claimed that when steel and aluminum crossed US borders, tariff revenue would bolster the position of the Treasury. Perhaps it would even help to offset diminished income tax revenues. (These points notwithstanding, tariffs and other trade restrictions are commonly shown to impose costs on consumers.)
The new Rome agreement, which basically excludes China, replaced a 25 percent tariff on steel and 10 percent on aluminum with quotas that limit the total amount of specific metal products that can enter American markets. It’s not simple. In all, there are 54 distinct quotas for different types of steel and 16 for different types of aluminum. A new crop of US gatekeepers will keep score on who and what is shipping into the country.
Now, when those metals cross the border, there will be no accompanying flow of tariff money to the US Treasury. Instead, higher corporate income and wealth taxes, if approved by Congress, may generate revenues that help replace the diminished tariff flows. Meanwhile, inflation-weary consumers may get a wee bit of relief, given that tariffs are inevitably passed on to them by US importers.
The new steel and aluminum agreement was celebrated by some US manufacturers of metal-using products, organized labor, and the Steel Manufacturers Association—but not by the aluminum industry, which preferred a simple tariff phase out. Dealing with the quotas’ score-keeping complexities raised major concerns for some importing firms, especially smaller ones that lack the specialized personnel for managing such matters. As with most federal regulations, larger firms with more money and compliance personnel will enjoy economies of scale while operating in this more complicated regulatory environment.
All steel and aluminum importers will become more engaged with, and therefore more dependent on, government officials. Opportunities for favor seeking and beneficial political influence will abound.
And unlike tariffs, quota-managed imports strengthen the hands of foreign officials in the countries America imports from. These officials must determine which of their countries’ firms should receive permission to export a limited amount of products, how much those firms will ship, and how it will all be managed. Past US experience with quotas on textiles and apparel and with similar “voluntary restraints” on Japanese automobiles, shows how quotas become marketable across individuals and borders and how decisions became biased.
For example, Hong Kong became a textile and apparel center where quota “owners” profited at the expense of American taxpayers who would have gained from simpler tariff revenues. And in Japan, some smaller auto manufacturers were shut out of the US market entirely, whereas their larger competitors gained sway. Eventually, major Japanese producers built US plants so that they would no longer be affected by tariffs or quotas.
In short, trade restrictions always inspire adaptations and create winners and losers, determined sometimes in unexpected ways.
Biden’s revision of the policy does open the door to America’s markets for tariff-free shipments of some needed basic raw materials, but the complexities involved make it difficult to know whether to celebrate or run for cover. Yes, there will be winners and losers, but it is hard to know which group is largest and which countries will gain the most.
COVID-19, the Search for Workers, and the Starting of New Businesses
My conversations about the economic situation with local South Carolina employers have a common theme. For some, the business outlook is the brightest in recent memory, and in some cases, capacity is sold out for the year ahead, but the availability of labor, lumber, steel buildings, and even doorknobs for completing large apartment projects is as bad as it has been in recent memory. My discussions with construction employers bring back personal memories of the years just after World War II, when new 1946 automobiles were arriving without bumpers or taillights because of the yet-to-be healed supply chain problems. But no one then referred to “supply chains”; they just said, “We can’t get the parts!” As one local executive told me recently, his firm is completing large construction projects with substitute floor tile, doors, and hardware that will have to be replaced later when the right stuff becomes available again. Little wonder that construction costs are rising.
However, while the pandemic is generating pain and anxiety for many, related gales of change are making the economy more productive and may be generating what will be go down as a golden age for entrepreneurship. Let me explain.
In their search for ways to satisfy surging consumer demand, many nimble employers are reassessing worker skills and what some term “adjacent capabilities,” which is another way of saying underutilized or yet-to-be-recognized skills and abilities. The result: more effective deployment of workers and better pay. Whereas expanding businesses normally look for ways to move specialized production capabilities into new product categories, such as shifting production of steel sheeting for automobiles into production of corrugated galvanized steel for industrial buildings, and so improve profits, there is now a push to reposition workers and the workplace itself so that newly emerging crucial needs get satisfied in house. Much of this effort can lead to the discovery of lower costs and even happier employees. In this way, pandemic-induced scarcities and disrupted supply chains may be seen later as the prelude to plenty. Americans should recognize that the noted adjustments are occurring globally, and big changes are assisted by emerging cloud computing, which makes available ultimate IT economies of scale to all who will pay the price and enables a “work wherever you wish” employee deployment.
Increasing New Business Starts
Yet although a sort of pandemic-generated global industrial revolution is occurring, one should not be surprised to know that a veritable explosion of new business starts is occurring in the United States. Indeed, out of necessity, hard times generally cause people to find ways to put bread on the table, sometimes literally, such as when a family decides to turn its kitchen into a bakery and its front living room into a small café. As the old saying puts it, “When the going gets tough, the tough get going.”
A recent 60 Minutes segment zeroed in on Greenville, South Carolina, a burgeoning upstate city, and examined how the pandemic has brought dramatic changes to work and employment patterns. In one of the program interviews, CBS correspondent Bill Whitaker asks Greenville restauranteur Carl Sobocinski about difficulties in finding help and why it seems that a lot of people are just not interested in coming back to work.
Sobocinski responds that he has a different take on the situation: the people he would have been interested in hiring or getting back to work are already working—they have started their own businesses. It turns out that America is experiencing an explosion in small business startups, and pandemic relief is part of the story.
How Big Is the Startup Boom, and Will That Matter?
New business startups are required to register themselves with the Census Bureau and obtain a government-issued official business number. Because of the procedure, the Census Bureau can track and report what is going on nationally, by state, by county, and by business category. In the process, the Census Bureau identifies firms with announced plans to hire workers as “high propensity” applicants. Figure 2 shows data for July 2004 through January 2022. The postpandemic surge is obviously large and without precedent in the 16-year series.

In December 2021 there were more than 419,000 new business applications, up 21 percent from December 2020. As the figure shows, that level of activity was ongoing for most of 2021. Just to make the counting easier, one can round that monthly number to an even 400,000. Annualized, that is 4.8 million startups in 2021. And each of the new businesses has at least one person working. In other words, in 2021 at least 4.8 million people went into business for themselves instead of going to work for someone else. In December 2021, the US labor force counted 85.3 million workers or people seeking work. The number starting businesses is better than 5 percent of the workforce. To add another bit of perspective, in November 2021, there were 11 million job openings waiting to be filled, as reported by the Bureau of Labor Statistics. The number of new business startups was a bit less than half the number of open jobs.
The sizable small business surge is apparently large enough to add an optimistic spin to expected growth in bank lending, which, of course, is what drives the economy. In his January comments, Bank of America CEO Brian Moynihan indicated that the largest part of his bank’s expected 2022 lending volume would be small business driven.
When people see all those “Now Hiring” signs and wonder why labor markets don’t seem to be working so well, they should remember that those who want to put people on a payroll are competing with people who want to be on their own payroll. Of course, everybody knows that that there is high failure rate for new businesses—20 percent fail in the first year, according to some research. By the end of the second year, 30 percent of that first batch of startups will have failed, and after 10 years, just 30 percent of that cohort will remain among the living. Despite those discouraging statistics, however, one can know that the pandemic business startup revolution will leave a mark on the future economy.
RegData Regulatory Spotlight: International Regulatory Trends
Stephen Strosko
Technical Director, Policy Analytics Project, Mercatus Center at George Mason University
Thurston Powers
Database Engineer, Mercatus Center at George Mason University
For a long time, researchers have lacked a consistent way to measure the effects of a regulation on the economy. To solve that problem, the Policy Analytics project at the Mercatus Center has pioneered new ways of measuring regulation and produced unique datasets such as RegData. RegData contains counts of the legally binding terms in regulations, statutes, guidance documents, and other forms of legal text. These data are filtered by industry and by geographic location, allowing scholars make to comparisons of the economic effects of regulation.
Each quarter this section will dive into new data, innovations, and trends on the topic of measuring various forms of regulation from around the world. This quarter we focus on brand-new 2020 and 2021 data on regulatory and statutory codes in Australia, Canada, and the United Kingdom. Next quarter we will focus on brand-new 2021 US regulatory data to provide an update on the Biden administration’s regulatory actions.
The final quarter of 2021 was an exciting time for the Policy Analytics project at the Mercatus Center. Not only did the team release updated international regulatory data for Canada and Australia, it also added a dataset for a third country, the United Kingdom. Federal-level findings for both regulations and statutes are displayed in figure 3.
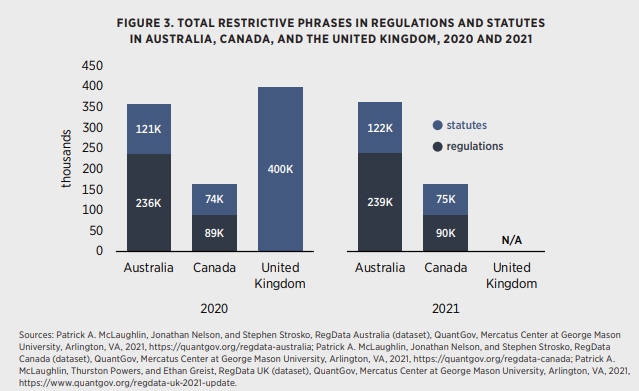
Australia experienced a 1.4 percent growth in regulations and a 0.99 percent growth in statutes. Canada experienced a 0.47 percent growth in regulations and a 0.76 percent growth in statutes. These numbers line up astoundingly well with the regulatory growth trend for the United States. Since 2000, the United States has experienced a consistent year-over-year growth rate of 1.2 percent in regulatory restrictions. The largest deviation from that trend was during the four most recent years of data, 2017–2020, where the average growth rate was 0.18 percent. Next quarter, when this report discusses the release of 2021 data, it will be interesting to explore if this four-year decrease in regulatory growth was a result of a new administration or a new regulatory trend that will span multiple administrations.
The RegData Canada and Australia data series provide more than just federal-level data. The 2021 update for both countries also covers province-level data in Canada and state-level data in Australia. Two articles visualize data for these subnational jurisdictions. The panel data produced by the Policy Analytics project on the subnational jurisdictions of both Canada and Australia allow researchers to ask and answer unique questions about legal document trends. For example, Queensland (a state in Australia) has maintained a higher restriction density, meaning that a greater percentage of the words in statutes and regulations are restrictive phrases than in other jurisdictions within Australia. It is not immediately clear if a greater density of restrictive phrases is preferable. On one hand, Queensland regulations may be more concise and easier to follow; on the other hand they may have a higher number of restrictive phrases than needed, which can have adverse effects on the economy. Maybe this density is an inadvertent effect of economic makeup—Queensland might have more industries that require less verbose regulations.
As mentioned before, the Policy Analytics project is excited to add the United Kingdom to the international RegData datasets. Although 2021 data are not available for the United Kingdom, data for 1992 through 2020 are. The dataset offers insights into the workings of the United Kingdom’s legal system and how it compares with similar systems. One surprising trend in the United Kingdom’s statutory data is the slowing of the annual growth rate of in-effect statutes and restrictions. This shift could represent several different changes in the legislative behavior of the United Kingdom, and the trend begs further exploration.
An additional finding in the UK data that begs exploration is the divergence in the total growth in words and total growth in restrictive phrases since around 2000. From 1992 to 2000, the United Kingdom saw an average of 3 percent growth in word count. At the same time, there was a steady decline in the growth of restrictive phrases, which averaged around 3 percent before the year 2000 and which has averaged less than 1 percent since. The explanation for this divergence could be as simple as a changing trend in statutory language or statutory structure. But is that the entire story? Has there been a shift in the restrictiveness of the United Kingdom’s statutes over the past 20 years, and if so, what effect has this shift had on important economic factors such as business dynamism, regressive effects, and economic growth?
Those who wish to explore these new data more may visit quantgov.org/download-data. Data can be downloaded in bulk, by data series, or even by individual document when using RegHub or the RegCensus API.
Yandle’s Reading Table
Certainly on a timely topic, Klaus Schwab and Thierry Malleret’s COVID-19: The Great Reset offers a two-part discussion of some of the major forces unleashed by the ongoing pandemic. The book’s first part examines macro forces, specifically economic growth and employment, fiscal and monetary policies, and inflation. This part of the book also looks at how society has changed with respect to inequality, social unrest, and the rise of big government. Sections of particular interest are devoted to the rise of nationalism, new twists and turns taken with respect to environmental use and protection, and how the COVID-19 pandemic has hastened the application of technologies for tracing and managing human behavior.
As founder (in 1971) and a major force in the World Economic Forum (WEF), Schwab has seen, heard, and participated in countless presentations and discussions of economic policy and political economy. It should be noted that one of Schwab’s principal purposes in founding the WEF was to promote the concept of stakeholder capitalism. The topic receives heavy treatment in the book. Coauthor Malleret, who is also associated with the WEF, has deep professional experience with think tanks and university teaching and is the producer of the Monthly Barometer, which offers indications of where the world economy might be headed.
I should note that whereas Schwab famously endorses and encourages stakeholder capitalism in normative terms, I do not, but I certainly see the stakeholder model as being a strong one for explaining the way the political economy is working. To my mind, stakeholder capitalism is another way of saying Bootlegger-Baptist capitalism, which is to say a political economy where politicians and rent-seeking economic agents find moral explanations for behavior that engenders broad political support and improves their relative wealth-seeking positions.
Turning to the book’s second section on the micro reset, one finds a rich discussion of how industry has reacted to and changed as result of pandemic forces and how questions of which changes may be temporary and which may be permanent continue to plague business decision makers. The micro reset discussion then focuses on individual behavior; how, perhaps, a more humane society has been affected by the fact that all people together face a common threat; and how, as a result, individuals and communities are confronting what the authors describe as moral choices. The matter of mandatory masks is given as an example of a COVID-19 policy initiative that has yielded a battlefield of debate and moral posturing. Going further with the micro discussion, one finds discussion of the pandemic’s effects on mental health and, ultimately, on how individuals are reevaluating what is important in their daily work and family lives. As I read this last section, I was reminded of Voltaire’s Candide and his end-of-global and almost life-taking-struggle recommendation: that people should stay home and tend their gardens.
Although I found COVID-19: The Great Reset to be a well-written and enjoyable read, I find fault that may be real, but my criticism may be, in a sense, unfair. The book was published in 2020, which means that much of the material found in the book emerged in 2019. Put simply, reactions to the pandemic have changed rapidly and meaningfully in the 12 months since the book was published. In any case, the book can serve as a foundation for generating a healthy discussion of the current pandemic that seemingly will not go away.
Some of my most enjoyable reading adventures have been facilitated by my daughter, Kathryn Smith. A well-established writer herself, she reads widely and then passes along some exceptional books to me. They are not always of the latest vintage, but that, sometimes, makes them all the more interesting. This is certainly the case with Benjamin Woolley’s The Queen’s Conjurer: The Science and Magic of Dr. John Dee, Adviser to Queen Elizabeth I, a fascinating biography of John Dee (1527–1609), who ranked high on the list of Queen Elizabeth I’s scientific and metaphysical advisers.
The setting is 16th-century England and Europe at a time when mathematical science, astronomy, and newly invented instruments for navigating unexplored seas were emerging; yet it was also a time when what might be termed competing séances, astrology, and literal crystal ball gazing sessions were generally accepted as legitimate and useful in the search for gaining an understanding of world forces.
What might be thought of as Dee’s professional lifetime started just 75 years or so following the invention of Johannes Gutenberg’s printing press in 1436 and just 50 to 75 years following the discovery of America. Dedicated to accumulating and owning the kingdom’s largest library and highly educated in mathematics, Dee turned down professorships in Paris—after having regularly lectured there on mathematics—and at Oxford in the hopes that he would someday be invited to join Elizabeth’s court as an official member. Alas, this was not to be. Dee nonetheless enjoyed a close friendship with the queen, was a trusted adviser, and was, as the book title suggests, a conjurer. This was a person who practiced magic arts.
For the sake of perspective, one should remember that Dee’s time was when Spain and Portugal were dominant in discovery, laying claim to new territories and bringing home the gold. England, certainly by comparison with those two countries, was poor, practically broke, and racked with highly destructive and divisive ongoing battles between Protestant and Catholic interest groups. Of course, the search for new worlds to claim was driven partly by a yearning for gold, as well as discovery of shorter routes to the spice-producing countries.
Wooley provides a fascinating account of this period and Dee’s leading position in it as part of a formation of a major chapter in the history of science. Yet what one may think of as science, as represented by astronomy, was emerging from the world of astrology, which emphasized locations of constellations, positions of stars and planets, and what those changing positions might portend. Lying inside all this were deeply held religious teachings and a belief—for some, that God himself could be revealed by the patient application of mathematics in deciphering ancient texts and teachings. Among language scholars and mathematicians there were some who believed God spoke to Moses and other Bible characters in their language, which was Hebrew. Following this assumption, the study of ancient Hebrew was seen as a way to tap into ultimate supernatural forces.
Dee was deeply engaged in this effort and was counted as a being skilled in magic—which at the time was about knowledge and the study of hidden forces—but not as one who clung to superstition—which was viewed as being exploitive of ignorance and totally unscientific. It is worth recalling that Dee’s time was also the time of Nicolaus Copernicus, another mathematician whose scholarly research developed the theory and logic for a universe centered on the sun, rather than the Earth. Yes, it was a time of large breakthroughs and, therefore, deep disturbances that rattled the already-shaky foundations of religious institutions and the earthly empires they attended.
Among the more delightful sections of the book, one finds fascinating accounts of expeditions at sea inspired by stories and superstition and assisted by Dee’s newly improved instruments for finding direction. Here one encounters discoveries of regions and people who, by comparison to the Europeans are either primitive and ignorant (in the case of Newfoundland) or highly sophisticated and living in cities larger than London (in the case of Muscovy) . Finally, I should mention that it was Dee who helped influence Queen Elizabeth to enter the global discovery competition and lay claims for major parts of the new world. In making his case, Dee hoped that he would become the great navigator, but it was not to be. Instead, a younger man, Sir Walter Raleigh, became the queen’s choice.
Different from most anything I have read in years, The Queen’s Conjurer carried me into a world and to a time of scientific development that was both fascinating and beneficial in my efforts to better understand my own world, where superstition and religious belief still hold sway.
Listen to a conversation with Bruce discussing this Economic Situation Report on the Mercatus Policy Download here.

