Using RegData, an innovative dataset from the Mercatus Center at George Mason University, this policy brief summarizes and contextualizes the volume of regulatory restrictions in four states (plus the District of Columbia) constituting the Mideast region as classified by the Bureau of Economic Analysis (BEA). In 2012, the Mercatus Center created RegData to quantify regulation at the federal level in the United States. RegData was created using text analysis and machine learning algorithms to convert legal text into quantitative data. Using these data, one can quantify the regulations in a jurisdiction. The primary unit of measurement of regulation in RegData is the regulatory restriction, or instance of the terms shall, must, may not, prohibited, and required appearing in administrative laws. Regulations by nature impose restrictions on individuals and businesses, either by requiring or by prohibiting activities. These terms approximate the restrictions that regulators impose on a jurisdiction.
In 2019, the Mercatus Center created State RegData, a dataset similar to RegData that quantifies regulations in state administrative codes. State RegData allows for aggregate levels of regulation across the various states to be compared with one another. This policy brief takes a dive into the data contained in State RegData and other Mercatus datasets to better understand the regulatory landscape in the Mideast region of the United States. Specifically, this report summarizes data for four states—Delaware, Maryland, New York, and Pennsylvania—plus the District of Columbia. (New Jersey is excluded from this analysis owing to data availability issues, despite New Jersey being a Mideast state according to the BEA.) Using data from State RegData version 2.1, as well as other sources, the brief compares these states’ regulatory environments along a variety of dimensions, including overall word counts in state codes, restrictiveness of regulations in state administrative codes, complexity of regulatory text, restrictions across industries, federal regulation of the various states, and population-adjusted restrictions.
The analysis presented here provides new insights into the size and scope of regulation across the Mideast region, which should prove useful to academics, policymakers, and even the regulators themselves as they seek to understand the consequences of the regulatory state in America.
Word and Restriction Counts and Complexity in State Regulations
Almost every state in the country has a regulatory code where its administrative laws are housed. Regulations are distinct from traditional laws written by legislators in that they are written mostly by unelected officials working at executive branch agencies that are delegated lawmaking powers from elected representatives in a legislature. Executive branch agencies are typically run by political appointees (although sometimes they are run by elected officials), and the staff who work at agencies are career civil servants. Thus, the administrative laws (i.e., regulations) written by these officials are different from statutes written by legislators in that there is generally no direct line of accountability from voters to the writers of these laws.
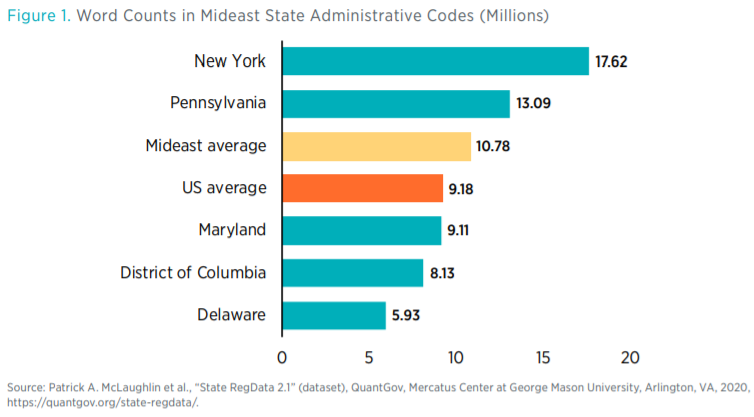
Number of Words in Regulatory Code
Perhaps the simplest way to compare states’ regulatory environments is to count the words in each states’ administrative code (figure 1). For example, the New York Codes, Rules, and Regulations contains over 17.6 million words, whereas the Delaware Administrative Code contains 5.9 million words, the fewest in the Mideast region. The average state in the country has about 9.2 million words of regulation, meaning that Maryland, the District of Columbia, and Delaware fall below the national average, whereas Pennsylvania and New York are above the national average.
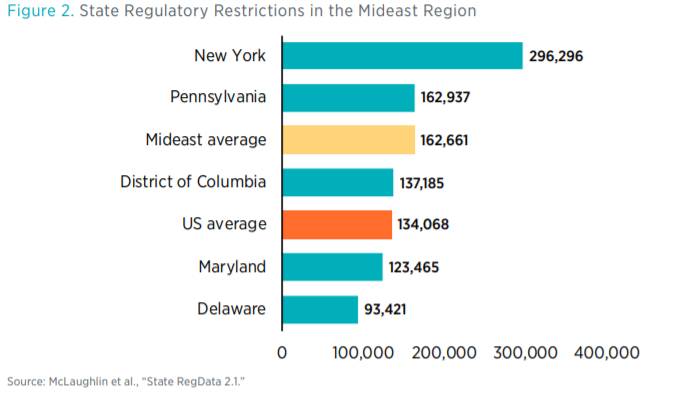
Number of Regulatory Restrictions
If one instead counts the restrictive terms in administrative codes, then New York remains the most regulated Mideast state, with 296,296 restrictions, whereas Delaware is the least regulated in the region, with 93,421 restrictions (see figure 2).
Complexity of Regulatory Text
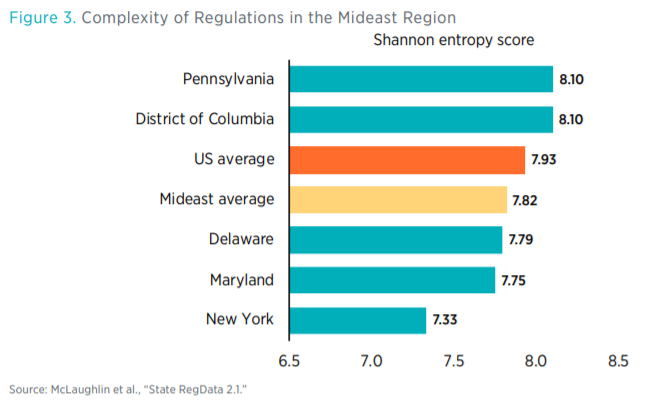
Highly complex regulations can create confusion and can be misunderstood by regulated entities. RegData measures the complexity of regulatory text by borrowing the Shannon Entropy score concept from the field of information theory. Shannon Entropy is a measure of the average information contained in a document. Documents with lower Shannon Entropy scores are less complex and easier to read than those with higher scores. Higher scores mean that the content of a document spans a wider range of topics and concepts. Documents with high entropy scores therefore contain more information and would likely require more mental bandwidth to understand and perhaps be more costly to comply with as well. There is no standard interpretation of the magnitude of this measure. Generally speaking, documents with a higher Shannon Entropy score are more difficult to read because they introduce more varied information. As a point of reference, Shakespeare plays typically have a Shannon Entropy score of 9.0 to 9.8.
Using the Shannon Entropy score, we notice that the complexity of regulatory text varies somewhat across the states in the Mideast region. Pennsylvania and the District of Columbia tie for having the most complex regulations in the region, whereas New York has the least complex regulations (figure 3). However, in general the complexity of regulations in the Mideast region stays within a fairly tight range.
Regulation of Industry at the State and Federal Levels
Another way to analyze the regulatory systems in these states is to look at the industries that are targeted by state and federal regulation. RegData was created using machine learning algorithms that are trained to identify text relevant to particular industries. When the probability that a certain piece of legal text applies to a particular industry is combined with regulatory restriction data, one can produce an estimate of the regulatory restrictions targeting particular sectors of the economy. Figure 4 shows the number of state regulatory restrictions for the most regulated industries in each state of the region. The figure shows clearly that the number of regulatory restrictions varies widely both within and across states. In other words, for particular industries, some states impose far more regulation than others. And within particular states, some industries are far more regulated than others.
The five most regulated industries by estimated restriction count are shown. Because some industries are among the five most regulated in multiple states, the figure shows 14 industries, not 25. Furthermore, the figure shows all 14 industries for each state in the region, regardless of whether any of those industries are among the 5 most restricted in a particular state. For example, we include restrictions on paper manufacturing in Delaware because that industry is among the top-five most restricted industries in Pennsylvania, not because it is among the top five in Delaware. Figure 5 includes 13 of the 14 industries because the BEA data on contribution to state GDP do not include food and beverage stores.
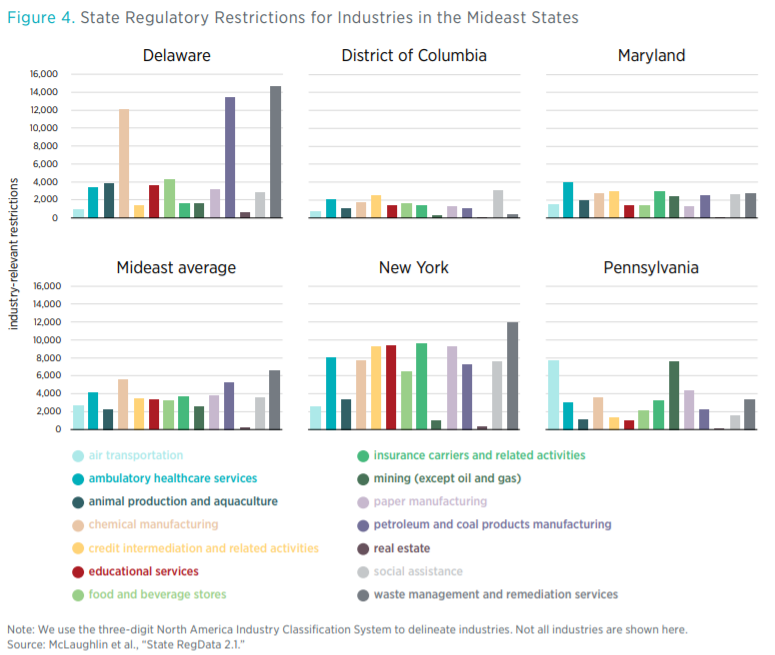
A few interesting observations can be made about the data in figure 4. Waste management and remediation is one of the most regulated industries across all states. On average, there are 6,621 industry-relevant state-level regulatory restrictions on waste management and remediation services in the region. In New York and Delaware, it is the most regulated industry. However, in the District of Columbia this industry is lightly regulated. In Pennsylvania, the air transportation industry is the most regulated industry, followed by mining.
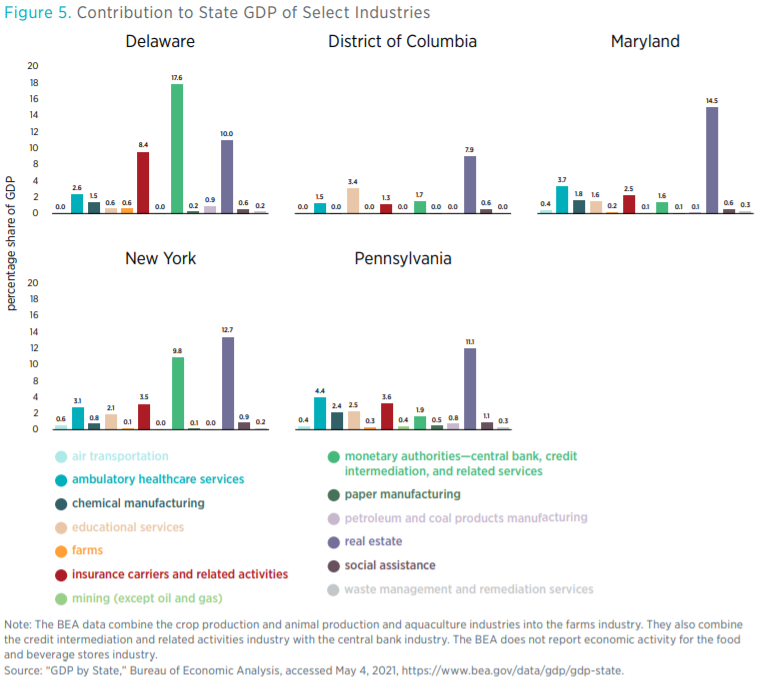
The variety in the number of restrictions targeting industries across this region could be explained by the relative importance of each industry to each state’s economy, though perhaps not always. Without assuming any direct causal relationship between the volume of regulations that falls on an industry and that industry’s contribution to state GDP, in figure 5 we present the percentage of state GDP associated with each of these industries for the four states plus the District of Columbia. The real estate industry is important to the economies of all states in the region as one of the biggest contributors to state GDP, but it tends to be less regulated than other industries. The ambulatory healthcare services industry, which constitutes a significant portion of GDP in all states in the region, tends to be relatively highly regulated too. Of the industries presented, ambulatory healthcare services is the most restricted industry in Maryland, whereas it is the second-greatest contributor to state GDP, after the real estate industry.
States also vary in terms of the degree to which their economies are targeted by federal regulation. For example, the average number of regulatory restrictions for the four states plus the District of Columbia is 162,661. By comparison, there are approximately 1.09 million regulatory restrictions in the US Code of Federal Regulations. Therefore, it is quite possible that federal regulations have a larger impact on these states’ economies than do the states’ own regulatory restrictions.
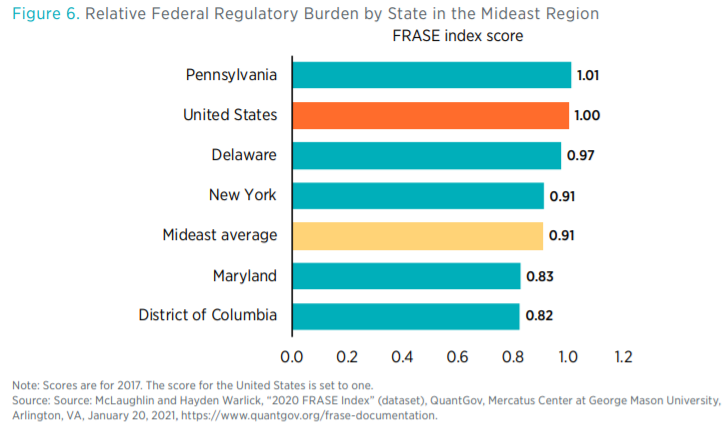
The Mercatus Center has also produced data to better understand the degree to which federal regulation targets states. By weighting estimates of industry-relevant federal restrictions according to how important various industries are to state GDP, the Federal Regulation and State Enterprise (FRASE) index ranks the states in terms of how regulated they are by the federal government (figure 6). In 2017, Pennsylvania received a score of 1.01. This ranking is scaled relative to the nation as a whole, which received a score of 1.00 in 2017, so a score of 1.01 means that Pennsylvania’s industries in 2017 were targeted by federal regulation 1 percent more than industries across the nation as a whole.
Regulation and Population
There are also reasons to believe that more populous states might tend to have more regulation than less populous states. For example, more populous states might have more industries, so some forms of regulation may not be necessary in less populous states. It may also be that there are fixed costs associated with regulating and that larger populations are able to absorb these fixed costs more easily by spreading them across a greater number of people. With more people, it might also be more difficult for the population to organize and lobby against regulations that bestow benefits on special interest groups at public expense.
For these reasons, it could make sense to adjust for population when reporting regulatory restrictions. Figure 7 shows the number of regulatory restrictions for each thousand residents in each of the Mideast states. The District of Columbia (with 194.4 restrictions per 1,000 residents) is the most regulated in the Mideast region, adjusting for population. Pennsylvania (12.7) is the least regulated state in the Mideast region. Only New York and Pennsylvania fall below the nation (19.4) and the region (20.3).
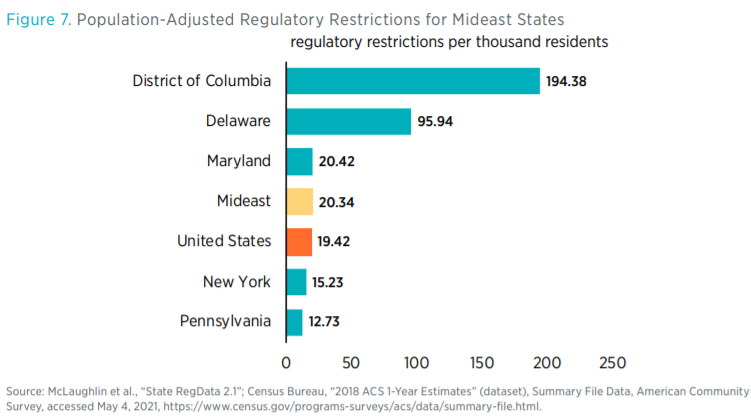
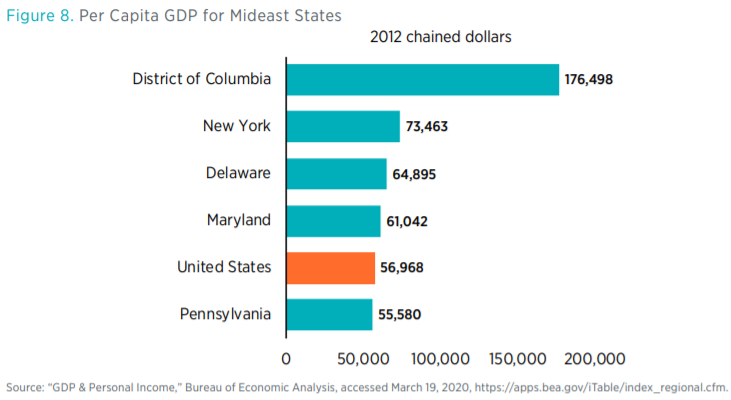
Though Pennsylvania has the fewest regulations per thousand residents, it also has the smallest GDP per capita, and similarly the District of Columbia has the most regulations per capita and greatest GDP per capita. Again, we stress that we are not attempting to establish a causal relationship between regulation and GDP per capita but merely are putting the volume of regulatory restrictions in the context of the local economies.
Conclusion
There are a variety of ways in which one can compare the regulatory environments across states, as this policy brief has done for states in the Mideast region of the United States. We have examined word counts, regulatory restriction counts, complexity, counts of regulatory restrictions targeting industries in these states, and the population-adjusted volume of state regulation. We have also examined the extent to which federal regulation targets each state’s industries.
Each of these metrics has its own advantages and disadvantages. All told, the amount of regulation in the states is considerable. Further research will help gauge how levels of regulation are evolving in these states over time and what this evolution implies. This snapshot of state regulations, however, provides a glimpse into the reach of various kinds of regulation in the Mideast region.

