- | Regulation Regulation
- | Policy Briefs Policy Briefs
- |
Tracking the Progress of Kentucky’s Red Tape Reduction Initiative
In July of 2016, seven months after taking office, Governor Matt Bevin kicked off the Kentucky Red Tape Reduction Initiative, an effort to reduce the burdens of state regulations.[1]Notably, as part of the effort, Bevin pledged to reduce regulations in the state by 30 percent.[2]Given that the effort has been underway for some time now, it makes sense to take stock of how things have gone. Therefore, this policy brief explores how the regulatory reform effort has fared thus far.
Information about the Kentucky Red Tape Reduction Initiative can be found at redtapereduction.com, which lists regulations repealed or amended by the administration.[3]According to the site, of more than 4,700 Kentucky regulations initially on the books, 617 have been repealed and 661 have been amended as of May 2019. That means that 27 percent of rules have been either repealed or amended as part of the effort. If one takes this count of repealed or amended rules as a blunt measure of red tape reduction—which assumes that amending rules amounts to cutting red tape insofar as the amendments lighten the regulatory burdens of older rule versions—the Bevin administration appears quite close to its goal of reducing red tape by 30 percent, and it may even succeed before the end of 2019.
But this measure of red tape reduction could be misleading for several reasons. First, it seems likely that new regulations were added during the governor’s term, which would counteract some of the effect of the regulations that were revoked. Second, regulatory burden may not be directly proportional to the number of regulations, so even if a lot of rules were revoked, that may not eliminate much burden. Finally, for political reasons, it may be easier to modify or eliminate regulations of the least consequence, leaving in place rules that are favored by politically entrenched groups, even if those remaining rules create heavy burdens.
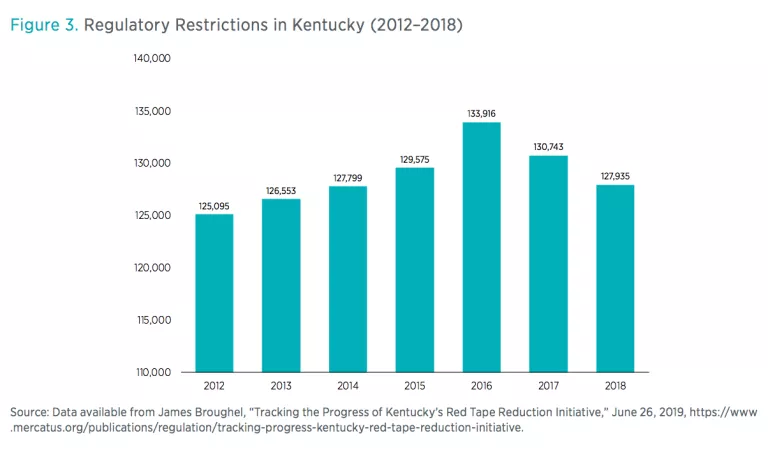
While estimates of the cost of individual Kentucky regulations are unavailable, there are measures of the aggregate level of regulation in Kentucky, which can serve as a comparison with the numbers reported by the Bevin administration. These measures include counts of regulations, counts of words in the state administrative code, and counts of restrictive words in the code, such as “shall” or “required.”
Alternative Measures of Red Tape Reduction
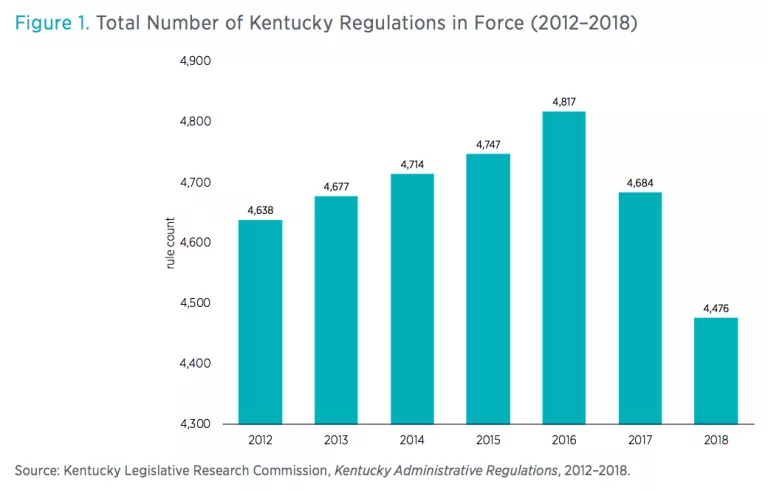
An electronic version of Kentucky’s regulatory code, known as the Kentucky Administrative Regulations(KAR),[4]is compiled by the state Legislative Research Commission each summer, capturing the code as it stands on June 15 of each year. As a result, historical data of the KAR are available for the years 2012 to 2018 (see figure 1). In June of 2016, roughly the time the Red Tape Reduction Initiative began, there were 4,817 regulations in the code. By 2018 that number stood at 4,476 regulations,[5]a decline of 341 rules, which represents a 7 percent reduction in the total number of rules in the KAR. In other words, looking at the net rather than gross number of regulations repealed, the Bevin administration appears short of its goal of a 30 percent reduction.
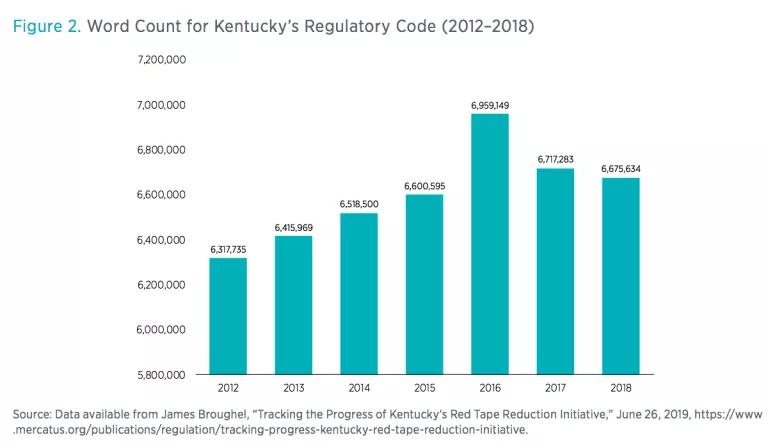
Another way to evaluate whether the regulatory code is growing or shrinking is by counting the total number of words of regulatory text. Again, the electronic version of Kentucky’s regulatory code can be useful here. As shown in figure 2, the overall number of words fell by 283,515 words between 2016 and 2018, representing decline of just over 4 percent.
Evidence of Deregulation
By all these measures—counts of rules, words, and restrictions—the overall level of regulation was trending upwards in Kentucky before 2016 but began falling thereafter. Even if the 30 percent reduction the governor envisioned is not met, slowing and reversing the rate of growth in regulation may nonetheless constitute a real achievement.
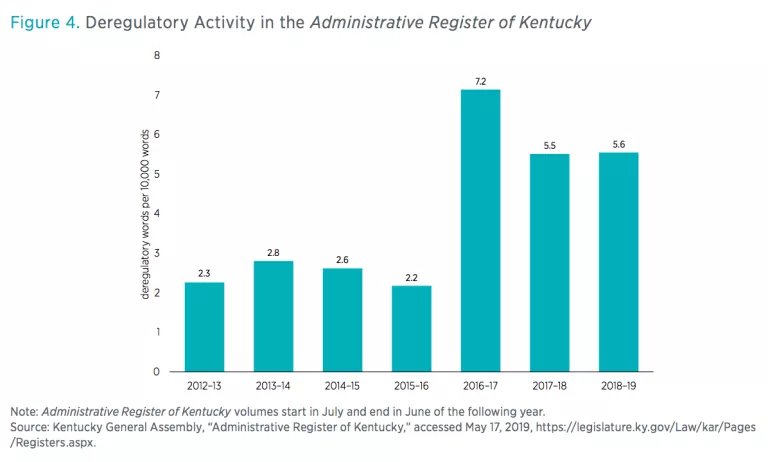
This trend away from regulation and toward deregulation is confirmed when looking at the ratio of deregulatory words to total words in theAdministrative Register of Kentucky, which is a monthly bulletin that contains regulations and other bureaucratic actions in Kentucky.[7]There is a noticeable spike in deregulatory language that coincides with the beginning of the Red Tape Reduction Initiative in 2016. The number of deregulatory words for every 10,000 words in the Administrative Register of Kentuckyjumped from 2.2 in the 2015–2016 volume to 7.2 the following year. That number has since declined somewhat, but it still remains far above its historical level.
Learning from Success
Kentucky has made some progress when it comes to cutting red tape, but there is more work to be done. A number of other jurisdictions have, or continue to be, engaged in similar regulatory reduction programs as Kentucky’s. Kentucky should try to learn from these efforts.
One state that could serve as a model for Kentucky is Idaho. An executive order early in Governor Brad Little’s first term required state agencies to identify two regulations for repeal or significant modification for each new one added over a two-year period.[8]Notably, the order included the statistic that Idaho has an estimated 72,000 regulatory restrictions, so Idaho is using the Mercatus restriction count measure to guide its efforts. From this baseline, the state will be able to track what happens to the overall level of regulation going forward.
Similarly, Virginia is a state that is implementing a bipartisan regulatory reduction program. As part of this effort, state agencies are being tasked with reporting a total count of regulations and regulatory requirements under their purview.[9]
A critical difference between the Idaho and Virginia efforts and that of Kentucky is the measure of regulation used to track progress. Idaho chose to use the Mercatus Center’s regulatory restriction measure,[10]and Virginia chose to manually count individual requirements. By keeping an eye on the aggregate level of regulation, these states are able to account for eliminated regulations, as well as any regulations that may be added over time. By contrast, since Kentucky has focused on the number of rules repealed or modified, the aggregate level of regulation has received less attention, and so new rules are offsetting some of the trimming of old rules. These different experiences highlight the critical importance of having a comprehensive regulation measure when setting targets for reducing red tape.
Conclusion
Kentucky has taken steps in the right direction with its Red Tape Reduction Initiative, but progress remains slow. Fortunately, it may not be too late for this reform to gain traction. One simple but meaningful change would be to mandate that state departments report counts of their regulatory requirements or restrictions annually. This would add a degree of transparency and accountability currently missing from Kentucky’s reform effort. Another option would be to implement a regulatory cap of some kind. For example, a one-in, one-out policy, such as was implemented in Texas,[11]or a one-in, two-out policy, following Idaho’s example, would lock in reductions and help keep regulatory creep from returning in the future. The state legislature could also take decisive action and legally mandate that the governor’s goal of a 30 percent reduction be met.
The Bevin administration deserves credit for trying to tackle the problem of regulatory accumulation. Furthermore, setting a concrete goal—like a 30 percent reduction target—is both ambitious and risky, as the administration must have known it would be held accountable to that promise in the future. In this case, by most measures examined above, Kentucky’s Red Tape Reduction Initiative appears to have fallen short of its goal. But this should not be viewed as a failure nor discourage similar efforts of this kind. Rather, Kentucky’s experience should be taken into account when designing other red tape cutting efforts in the future, particularly the important lesson that the aggregate amount of regulation in a state should be measured and tracked. Furthermore, Kentucky itself can and should build on the reductions it has achieved, which can serve as the foundation for further, more significant, and lasting reductions in regulatory burdens going forward.
Acknowledgment
The author would like to thank Jonathan Nelson and Stephen Strosko for helpful research and programming assistance.
[1]Kentucky Cabinet for Economic Development, “Gov. Matt Bevin Unveils Red Tape Reduction Initiative to Attack Outdated, Unnecessary Business Regulations,” press release, July 6, 2016, https://www.thinkkentucky.com/Newsroom/NewsPage.aspx?x=07062016_RedTape….
[2]Matt Bevin, “State Red Tape Initiative’s Goal Is to Reduce Regs by 30 Percent,”Paducah Sun, August 22, 2016.
[3]Red Tape Reduction Initiative home page, accessed May 8, 2019, http://redtapereduction.com/.
[4]The official printed version of the code is known as the Kentucky Administrative Regulations Service.
[5]Kentucky Legislative Research Commission, Kentucky Administrative Regulations, 2012–2018.
[6]State RegData is part of a broader project called QuantGov, which seeks to quantify legal text. See Patrick A. McLaughlin and Oliver Sherouse, “QuantGov—A Policy Analytics Platform,” QuantGov, December 20, 2017.
[7]Deregulatory words here are defined as the words “delay,” “deregulate,” “eliminates,” “eliminate,” “unnecessary,” “obsolete,” “repeal,” “withdraw,” “withdrawing,” “remove,” and “replace.”
[8]Exec. Order No. 2019-02, Red Tape Reduction Act (January 21, 2019).
[9]H.B. 883, 2018 Gen. Assemb., Reg. Sess. (Va. 2018).
[10]Idaho is also counting chapters, words, and pages of regulation, highlighting how the use of multiple measures can add perspective as to how aggregate regulation levels evolve over time.
[11]H.B. 1290, 2017 Leg., 85th Sess. (Tx. 2017).

