- | Regulation Regulation
- | Research Papers Research Papers
- |
Unintended Consequences of Raising the Minimum Wage
The minimum wage tends to be an emotionally charged topic because both sides believe that they are arguing (at least in part) in defense of the poor. Each side then naturally assumes that the other side must be arguing in opposition to the poor. To promote civil discussion, it is important to recognize that both sides are truly interested in helping the poor. Once we realize that we share this common purpose, we can work together to examine honestly the arguments and evidence for and against the minimum wage.
The purposes of this paper are to examine arguments for and against minimum wage increases and to present new results by comparing employment for workers with differing educational attainments. I begin by looking at minimum wage workers: how many there are, how old they are, in what industries they work. I then list common arguments for and against the minimum wage and show evidence supporting and refuting these arguments. No discussion of the minimum wage is complete without reference to the famous study by economists David Card and Alan B. Krueger, showing that increases in the minimum wage result in more employment.1 What is less widely noted is the fact that Card and Krueger do not actually measure employment. They measure managers’ claims about employment changes that they had instituted or planned to institute. Therefore, no discussion of the minimum wage should be complete without reference to the study by economists David Neumark and William Wascher that attempts to replicate Card and Krueger’s results. Neumark and Wascher, publishing in the same academic journal as Card and Krueger, replicate Card and Krueger’s study but measure employment using actual payroll data. They find that employment did decline following New Jersey’s minimum wage hike.2 This is precisely what standard economic theory predicts should occur. Finally, I will examine some studies that offer compelling theoretical reasons why the minimum wage might not create unemployment.
To close, I will show additional evidence—at the national and state levels—of the relationship between the minimum wage and unemployment, and between the minimum wage and income inequality.
Who Earns the Minimum Wage?
In 2012, there were 127.6 million full- and part-time workers in the United States. Of these, less than 3 percent earned at or below the minimum wage.3 This statistic excludes workers who are paid under the table (and who may or may not earn less than the minimum wage after taxes are considered). It also excludes the selfemployed, who may or may not earn less than the minimum wage, depending on the profitability of their businesses.4 Slightly more than 1 percent of full- and parttime workers earn less than the minimum wage. However, legally employed workers in jobs that pay less than the minimum wage often earn tips, and, by federal law, employers are required to make up the difference if the tips do not bring their wage up to the minimum.5 As these workers have an incentive not to report cash tips, it is possible that they make significantly more than the minimum wage. If all these subminimum wage workers actually earn more than the minimum wage, then minimum wage workers comprise 1.6 percent of the workforce. If all these subminimum wage workers actually earn the minimum wage, then minimum wage workers comprise 2.8 percent of the workforce. In sum, minimum wage workers constitute between 1.6 percent and 2.8 percent of all US workers. Of all minimum wage workers, 44 percent work in a single industry: food service and preparation. The next largest concentration, constituting 15 percent of minimum wage workers, is found in sales and sales-related jobs. See figure 1 for a comparison of nationwide wage statistics with those of New Jersey.
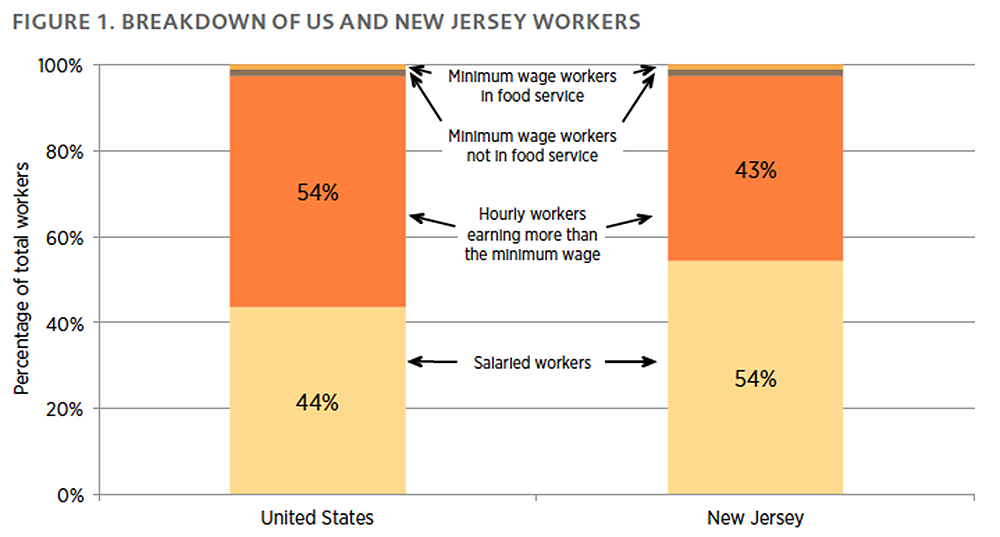
Note: Minimum wage workers constitute a small fraction of all US workers (2.7 percent in the United States and 2.6 percent in New Jersey). The plurality of minimum wage workers works in the food service industry. Nationally, 68 percent of hourly workers earning more than the minimum wage are full time (35 or more hours) versus 31 percent of minimum wage workers. Sources: Bureau of Labor Statistics, US Department of Labor, Characteristics of Minimum Wage Workers: 2012, February 26, 2013, www.bls.gov/cps/minwage2012.pdf; Bureau of Labor Statistics, US Department of Labor, table 5, “Employees on Nonfarm Payrolls by State and Selected Industry Sector, Seasonally Adjusted,” Economic News Release, last modified September 20, 2013, www.bls.gov/news.release/laus.t05.htm.

