- | Regulation Regulation
- | Policy Briefs Policy Briefs
- |
RegData Canada: A Data-Driven Approach to Regulatory Reform
RegData Canada, a data project from the Mercatus Center at George Mason University that was launched in 2018, allows regulators and policymakers to better identify and prioritize regulations that may need reform. The RegData Canada project involves applying customized text-analysis software and machine learning algorithms to regulatory text issued by federal and provincial regulators, resulting in 14 unique datasets: a Canadian federal dataset and 13 provincial datasets. All of these datasets are freely available online at QuantGov.org.
RegData Canada provides a variety of quantitative data and indicators, including
- regulatory restriction counts,
- relevance of regulations to economic sectors and industries,
- the prevalence of incorporation by reference,
- linguistic complexity,
- the location of outdated language, and
- the likelihood that a regulation includes prescriptive design standards.
We describe some of these below. Additionally, these datasets have been used to create an interactive Canada Regulation Tracker, available online alongside the aforementioned datasets at QuantGov.org.
Regulatory Restrictions
Regulatory restrictions are words and phrases in regulatory text that indicate specific obligations or prohibitions created by a regulation.
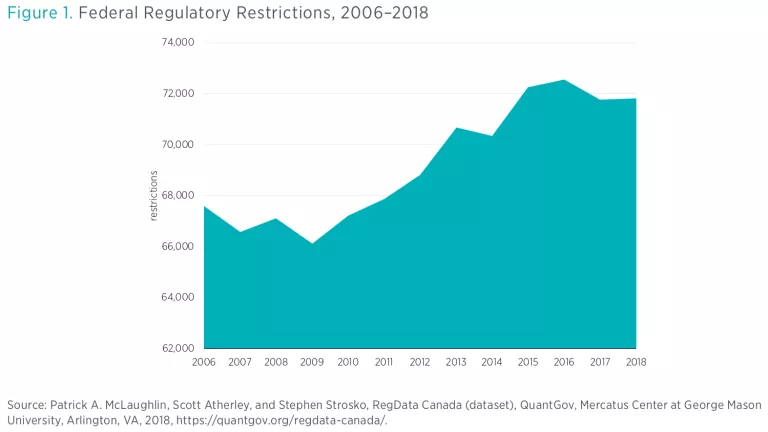
RegData Canada datasets include counts of the following words and phrases: shall, may not, must, required, and prohibited. Figure 1 shows the results for all Canadian federal regulations.
Industry and Sector Data
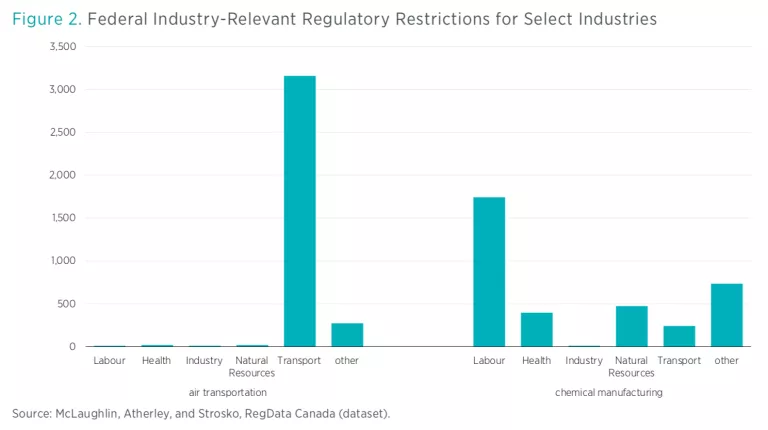
The second core component of RegData Canada involves the estimation of the applicability of regulations. We use a set of machine learning algorithms developed over the course of the RegData project—which initially launched in 2012—that maps segments of regulatory text to the sectors and industries to which they are most relevant, based on the text of the regulation itself. This approach allows us to develop estimates of the number of restrictions and words that apply to specific sectors of the economy. We use the North American Industry Classification System (NAICS) to define industries. The NAICS standard is widely used across academia and in government, and it has the distinct advantage of being conceptually identical across the United States and Canada. Figure 2 shows the results for two sample industries, broken down by ministry.
Provinces and Territories
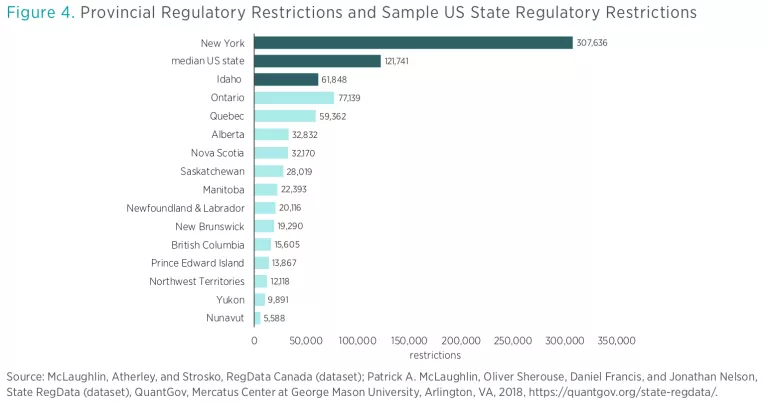
In addition to processing Canadian federal regulations, we also apply a comparable methodology to regulations published by individual provinces and territories. The 13 Canadian province and territory datasets offer a comprehensive cross section of provincial and territorial regulations as of July 2018. Figure 3 presents total restriction counts across the provinces and territories.
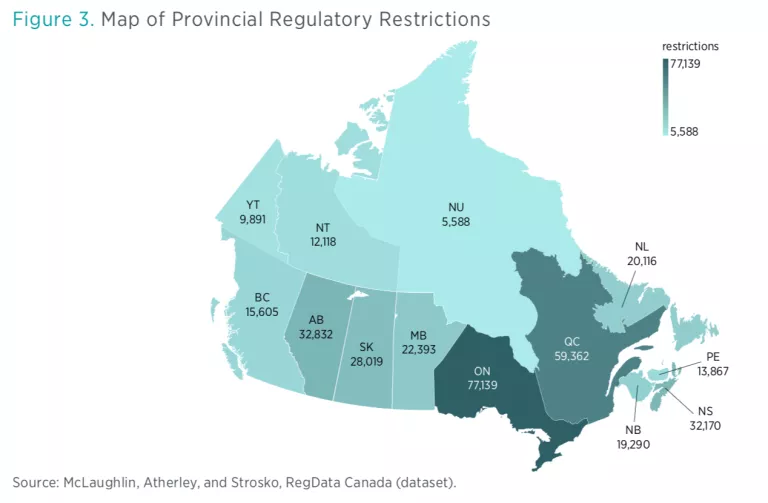
Figure 4 also presents provincial and territorial regulatory restriction counts alongside some results from a sample of US states. The US states selected for figure 4—New York and Idaho—represent the maximum and minimum (respectively) restriction counts of the states for which we have data at this point in the project. The median US state is Maryland at the time of this writing.
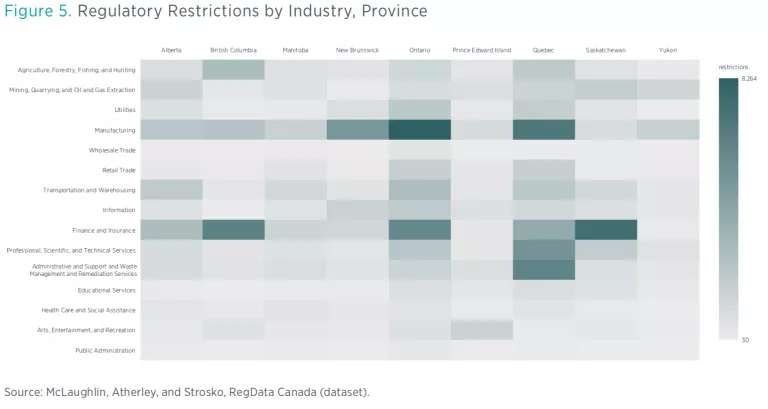
Restrictions by industry vary considerably across the provinces. Oil and gas extraction and related industries show particularly high levels of restrictions in high-production areas, including Alberta and the Northwest Territories, where such activities make up a substantial portion of the provincial GDP. By contrast, Ontario and British Columbia, whose economies are comparatively more service oriented, show more service-related industry restrictions, particularly on financial and insurance-related industries and professional services.
Figure 5 summarizes total restriction counts by substantive NAICS two-digit industries and Canadian provinces. This graphic allows for comparisons of regulatory distribution. For example, finance and insurance regulations are abundant in British Columbia and Saskatchewan, while manufacturing is more highly regulated in Alberta and Ontario.
Linguistic Complexity
The complexity of a regulation is significant for a number of reasons. Prominently, complexity is expected to raise compliance costs, as regulated entities need to spend more time to understand complex regulations. This may force regulated entities to employ more lawyers, which is an additional cost.
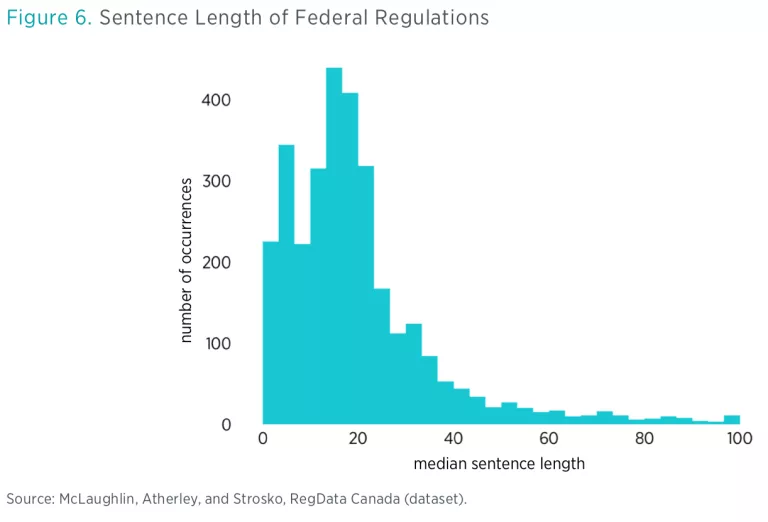
RegData uses two different metrics to compare the complexity of regulations. The first of these is a simple, commonly used measure: sentence length. This measure uses the median-length sentence in a document, which avoids outliers caused by limitations in parsing sentences, such as large tables or other nonstandard bodies of text.
Figure 6 shows the distribution of median sentence length for all of the regulations. While the analysis shows a mean of 25 words per sentence across all regulations, the median for all regulations is 17, indicating that many regulations are in line with the Canadian Treasury Board recommendation of 20 words per sentence. There are, however, a number of regulations with greater than the recommended 20-word-per-sentence average, which may have room for improvement in terms of readability by rewriting the regulations to simplify or break up sentences.
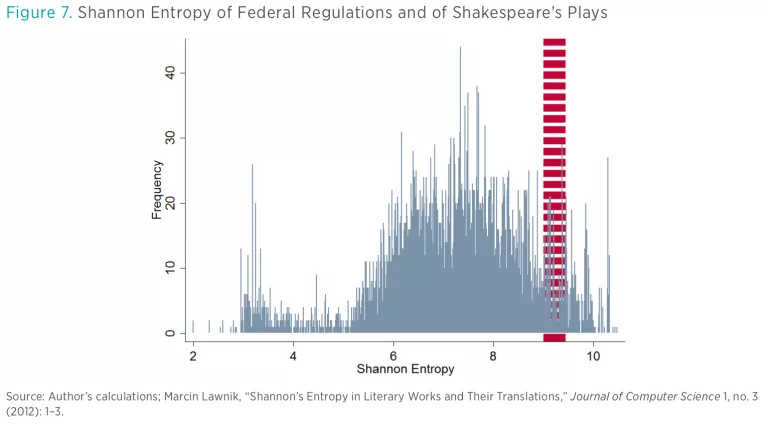
The second metric examined was Shannon entropy, which is slightly more complex. Shannon entropy measures, in broad terms, the frequency of new ideas introduced in documents, with simpler and more focused documents having a lower entropy score. The average federal regulation has an entropy score of 6.79. For the sake of comparison, compositions by Shakespeare tend to have an entropy score between 9.0 and 9.7.
Figure 7 shows the distribution of Shannon entropy for federal regulations. The red area shows the range of Shannon entropy for Shakespeare’s major plays. The figure readily suggests that a “Shakespeare Test,” in which any regulation with a Shannon entropy score greater than the Shakespeare range would qualify for a closer read to determine if it needs simplification or updating, may be useful.