- | Policy Briefs Policy Briefs
- |
Declining Fiscal Multipliers and Inflationary Risks in the Shadow of Public Debt
As in every economic crisis, fiscal stimulus discussions became more prominent during the pandemic-induced downturn of 2020. Policymakers and economists’ renewed faith in large fiscal multipliers led many to contend that government stimulus spending can stabilize a country’s ailing economy by stimulating aggregate demand and closing the output gap. Despite over a decade of theoretical innovations and empirical discovery, many economists continued to make bold claims about large fiscal multipliers in the range of 1.5 to 2.0. One economic variable that has been increasingly drawing the attention of economists is the level of public debt, or the fiscal position of an economy, in relation to the size of the fiscal multiplier.
In this policy brief we discuss what economists know (and don’t know) about fiscal spending multipliers. We then review the growing economic literature on the relationship between the fiscal position and the size of the fiscal multiplier. In addition, we explore the inflationary risks that arise with future economic downturns if public debt levels continue to rise at projected rates. The bulk of empirical literature reveals a significant negative relationship between public debt levels and the size of fiscal multipliers. As debt levels continue to rise (and multipliers subsequently fall), policymakers will feel compelled to commit larger packages of stimulus spending during economic downturns, which poses a significant inflationary risk for future economic crises.
Fiscal Multipliers: What Economists Know (and Don’t Know)
In simple terms, the fiscal multiplier, an idea popularized by the economist John Maynard Keynes, is a measure of the effect that increases in government spending have on economic output, or GDP. Economists typically define the fiscal multiplier as the ratio of a change in the dollar value of output to a change in government spending. A multiplier of 1.0 means that for every additional $1.00 the government spends, GDP is boosted by an equal amount ($1.00). A multiplier greater than 1.0 means that for every additional $1.00 the government spends, GDP is boosted by an amount larger than $1.00. A multiplier smaller than 1.0 means that for every additional $1.00 the government spends, GDP is boosted by an amount smaller than $1.00, which often occurs when an increase in government expenditure creates a negative wealth effect, crowding out private investment and consumption.
Over the past two decades, economists have been debating the size of fiscal spending multipliers to determine whether large government investments or economic stimulus packages are effective at raising economic output. Early theoretical Keynesian investigations placed great faith in the importance of marginal propensity to consume and tended to find multipliers as high as 3.0 or more. Such results were often perceived as a full-throated endorsement of government stimulus spending. In the 1980s, neoclassical economists began to observe the empirical relationship between defense spending and economic output and found the effects to be positive, but typically below 1.0.
In recent decades, economists have been adopting theoretical innovations including the effects of labor market slack, consumer behavior, sticky prices, and interest rates at the zero lower bound (ZLB). Newer studies have incorporated exogenous variation in policies to determine how the output effects of government spending depend on particular economic, social, and political circumstances. The bulk of economic literature published in recent years tends to find a range of estimates for the fiscal multiplier between 0.3 and 1.0, with a small number of studies finding multipliers outside of that range. Figure 1 shows 23 notable studies from the fiscal multiplier literature published in the past two decades with the ranges of multiplier estimates displayed on the x-axis.
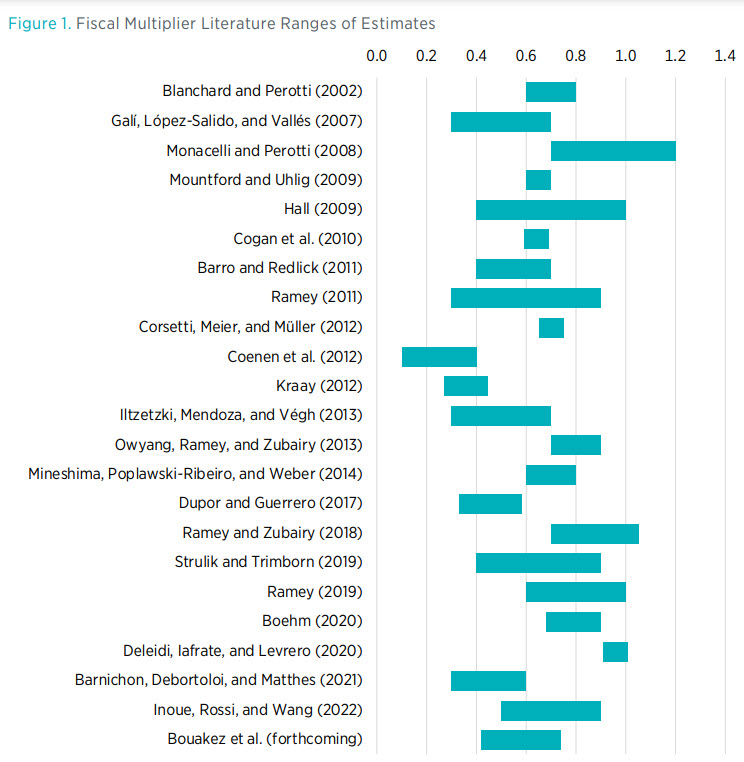
A 2019 study by economist Valerie Ramey reviews the estimates of studies with strong methodological approaches to find a range of estimates for spending multipliers. She finds that the bulk of estimates for average spending multipliers lie in a fairly narrow range of 0.6 to 1.0. Multiplier estimates in each study depend on the time horizon observed. A study by Andrew Mountford and Harald Uhlig finds that multipliers are largest upon impact, but a study by Robert Barro and Charles Redlick finds that multipliers are larger at longer-term horizons, often after around two years.
Several studies focus on the relationship between labor market slack, interest rates at the ZLB, and fiscal multipliers. A 2011 study by Ramey finds that spending multipliers tend to be around 0.3 during periods of low unemployment and close to 1.0 during periods of high unemployment with interest rates at the ZLB. Other studies find that neither labor market slack nor ZLB interest rates lead to higher multipliers. A more recent analysis by Atsushi Inoue, Barbara Rossi, and Yiru Wang finds that fluctuations in multipliers over time cannot be explained by variables such as unemployment or whether interest rates are at the ZLB.
The Relationship between Public Debt and the Fiscal Multiplier
While economists continue to debate the effects of different variables on the size of spending multipliers, one variable is being increasingly recognized as significant: fiscal position. Since the Global Financial Crisis (GFC), there has been a growth in empirical literature analyzing the relationship between public debt levels and the size of fiscal multipliers.
In the aftermath of the GFC, economists Markus Kirchner, Jacopo Cimadomo, and Sebastian Hauptmeier studied the effects of government spending shocks and the fiscal transmission mechanism in the Eurozone in 1980 to 2008. Using time-varying structural variable autoregression (VAR) techniques, the authors found that the short-run and long-run effectiveness of government spending in stabilizing real GDP has decreased since the 1980s. Being econometric evidence on the forces driving time variation of spending multipliers, the results indicate that high government debt-to-GDP ratios negatively affected long-term multipliers. Specifically, the authors found that a 1 percentage point increase in the debt-to-GDP ratio caused on average a decline in the multiplier on output by 0.01 points in all regression specifications considered.
Observing the effect of public debt levels on the fiscal multiplier in the Eurozone, one 2013 study by Radu Vranceanu and Damien Besancenot estimates a regression model using data from 26 EU countries from 1996 to 2011. The analysis finds that a large public debt not only has an adverse effect on growth, but also reduces the positive effects of a given fiscal stimulus. A 10 percentage point increase in the debt-to-GDP ratio reduces the deficit-stimulating effect from 0.959 to 0.869. What’s more, for a debt-to-GDP ratio greater than 150 percent, the multiplier becomes negative.
A study by Ethan Ilzetzki, Enrique Mendoza, and Carlos Végh contributes to the debate on the real effects of fiscal stimuli by showing that the impact of government expenditure shocks depends largely on country characteristics, including trade openness, exchange rate regime, public indebtedness, and level of development. Adopting a panel ordinary least squares regression for a sample dataset of 44 countries, the study finds that fiscal multipliers are smaller in high-debt countries and turn negative at long-term horizons. The impact multiplier for countries with a debt-to-GDP ratio less than 60 percent is found to be 0.73, and the long-run multiplier is found to be 0.41 after six years. For countries with a debt-to-GDP ratio greater than 60 percent, the impact multiplier is found to be just 0.06, and the long-run multiplier is found to be −2.3 after six years.
Using dynamic panel techniques for a panel of 55 countries, a Bank of Mexico working paper by Juan Contreras and Holly Battelle estimates the size of fiscal multipliers dependent on monetary accommodation, level of development, exchange rate regime, and levels of indebtedness. In the long run, the multiplier could reach as large as 1.49 for low-debt countries, but only 0.39 for high-debt countries, whereas impact multipliers were found to be 0.44 and 0.37 respectively. The authors suggest that an increase in government spending in a high-debt country may signal either difficulty of payment later or inflationary concerns, driven by an increase in the interest rate.
Using a slightly different approach, a 2014 study by Christiane Nickel and Andreas Tudyka measures the persistence of fiscal multipliers between low- and high-debt regimes for a sample of 17 European countries from 1970 to 2010. The authors find that, although the overall cumulative effect of a spending shock on real GDP is positive and significant at moderate debt-to-GDP ratios, this effect turns negative as the ratio increases. Specifically, for low-debt countries (debt-to-GDP ratio up to 35 percent), the positive multiplier reverts back to zero over a long period (about eight years), but for high-debt countries (debt-to-GDP ratio around 105 percent) the multiplier reverts back to zero—and then turns negative (less than −1.0)—after about two years. The authors conclude that “these results lend additional support to increased prudence at high public debt ratios because the effectiveness of fiscal stimuli to boost economic activity or resolve external imbalances may not be guaranteed.”
One 2016 study by Marie-Pierre Hory analyzes the impact of certain macroeconomic factors on multiplier effects for emerging market economies (EMEs) and advanced economies (AEs) from 1990 to 2013. Using a panel conditionally homogeneous VAR, the study finds that public indebtedness acts in the same way for both EMEs and AEs. In AEs the spending multiplier is around 1.15 at low levels of indebtedness (less than 40 percent), but the spending multiplier decreases to around 0.80 when public debt levels exceed 100 percent of GDP. Focusing specifically on central and eastern European countries (CEECs), another 2016 study uses a panel vector error correction model, which captures the common long-term path of CEECs while allowing for different short-run dynamics. Both impulse and cumulative fiscal multipliers are sensitive to a range of CEEC characteristics, including the level of economic development, the exchange rate regime, the fiscal stance, and the trade openness. For countries with a debt-to-GDP ratio of 22 percent on average from Q1 1999 to Q3 2013, the cumulative multiplier is 0.28, whereas for countries with a debt-to-GDP ratio of 48 percent on average over the same period, the cumulative multiplier is just 0.10.
Using a dataset of 120 countries covering 1960–2014, a study by World Bank economist Wee Chian Koh evaluates the effectiveness of fiscal policy at different levels of public debt, at different levels of financial development, in a financial crisis, and during business cycle downturns. When the debt-to-GDP ratio exceeds 60 percent, the long-run fiscal multiplier is positive but low, at 0.4. When the debt-to-GDP ratio exceeds 100 percent, the fiscal multiplier is close to zero. When public indebtedness is increasing, forward-looking economic agents anticipate higher future taxes (to finance deficit spending) and therefore increase their savings (decrease their consumption) in reaction to expansionary fiscal policy.
A 2019 study by António Afonso and Frederico Leal computes the value of fiscal multipliers in Eurozone countries since the creation of the currency union (2001–2016) to understand how the values may vary according to public debt levels. Baseline results show that government expenditure has a positive output effect, though notably smaller than 1.00. The baseline spending multiplier is 0.44 after one year and peaks at 0.62 after two years, which is largely consistent with prior studies. For countries with a debt-to-GDP ratio greater than 60 percent, spending multipliers are just 0.29, whereas for countries with a debt-to-GDP ratio less than 60 percent, spending multipliers are 1.09. Of note, the study also finds that tax multipliers, which tend to be negative and significant in most cases, can actually be positive in low-debt countries. This finding may reflect better spending decisions in low-debt countries versus spending on questionable programs in high-debt countries. It also suggests that not only does stimulus spending become less effective in high-debt countries, but also tax increases become increasingly damaging to output in high-debt countries, making revenue-focused fiscal consolidation increasingly difficult.
A study by Raju Huidrom and coauthors empirically documents the effect of the fiscal position on fiscal multipliers, specifically through two channels: the Ricardian channel and the interest rate channel. The Ricardian channel involves households reducing consumption in anticipation of future tax increases to finance deficits, whereas the interest rate channel involves investors demanding a risk premium, which raises interest rates and subsequently reduces domestic investment. The study finds two-year multipliers to be around 0.6 when debt is low (10th percentile of the sample) and around 0.0 when debt is high (90th percentile of the sample). The difference in the estimated multipliers for low and high levels of debt remains significant at longer horizons. Importantly, high debt levels reduce multipliers, even in recessions, meaning that fiscal policy is less effective than it would otherwise be at stimulating output during a downturn when debt levels are high.
A 2021 working paper by Pragyan Deb and coauthors examines the effects of fiscal policy measures of 52 countries during the COVID-19 pandemic by breaking down the effects on economic activity by country characteristics. Consistent with most of the evidence in the literature, the study finds that “fiscal shocks are likely to be much more effective in countries with lower public debt levels before the crisis, as the crowding out effects on private investment and consumption are typically larger in countries with high debt.” Specifically, countries with low levels of public debt entering the 2020 crisis saw multiplier effects on industrial production around 0.7–0.8, whereas countries with high levels of public debt experienced multipliers around 0.0 (figure 2).

Analyzing pre- and post-GFC expenditure multipliers, one 2021 study by Sam Ouliaris and Celine Rochon focuses specifically on the effects of higher debt levels, quantitative easing, and lower interest rates on real GDP in the United States. Drawing on the empirical approach of Olivier Blanchard and Roberto Perotti, the authors find that spending multipliers have declined appreciably since the GFC. Although low real interest rates have increased the size of multipliers since 2008, the negative influence of debt accumulation has outweighed the positive influence of low interest rates. When calculating expenditure multipliers before and after the GFC, the authors find that pre-GFC multipliers reached levels around 1.2; including post-GFC years in the dataset, the authors find a peak multiplier of about 0.5 after four years and close to 0.0 during the first year. The authors conclude by noting that despite an environment of low interest rates, both high levels of public debt and a bloated central bank balance sheet have contributed to the declining effectiveness of fiscal policy after the GFC.
A recent study by Fernando Broner and coauthors takes a slightly different approach to measuring the effect of debt on fiscal multipliers. The study explores the connection between fiscal multipliers and foreign holdings of public debt and finds that countries with a large share of public debt held by foreigners (e.g., Ireland, with 64 percent of public debt held by foreigners) typically have fiscal multipliers larger than 1.0, whereas countries with a small share of public debt held by foreigners (e.g., Japan, with 6 percent held by foreigners) typically have fiscal multipliers around 0.0. Larger domestic purchases of public debt have crowding-out effects because the resources used to acquire public debt reduce domestic consumption and investment. These findings are particularly important in the United States, where the proportion of public debt held by foreign investors reduced from around 50 percent in 2007 to around 30 percent today. Foreign holdings of US debt have been trending downward for the past decade (see figure 3). If this trend continues, fiscal multipliers in the United States are likely to decline further as the share of public debt held by domestic actors increases.

Growing Public Debt, Shrinking Fiscal Multipliers, and the Risk of Inflation
A notable pattern emerges from existing research published since the GFC pointing toward a broadly well‐founded conclusion that high levels of public debt have a negative impact on the size of spending multipliers. Because the level of public debt in the United States has been on an upward trajectory for over four decades (especially since 2008) and is projected to surpass 200 percent of GDP by mid-century, the use of fiscal tools to alleviate future economic crises will prove increasingly futile.
Recent experiences with the COVID-19 pandemic and global economic crisis in 2020 offer some lessons in how shrinking fiscal multipliers might cause serious policy miscalculations in future economic crises. At the onset of the 2020 crisis, economists at the Federal Reserve Bank of San Francisco argued that fiscal multipliers would be greater than 1.0 and perhaps around 1.5, suggesting that “the output boost from the current fiscal response is likely to be large.” One year later, the same institution published research arguing that fiscal multipliers at the zero lower bound are likely to be well greater than 2.0 and highly persistent. These large multiplier estimates are out of sync with the bulk of empirical literature, and they overlook two decades of empirical and methodological innovations. Best estimates for the multiplier effect of fiscal stimulus in 2020 are 0.58, whereas the range of estimates for specific government policies included in the Coronavirus Aid, Relief, and Economic Security Act vary from 0.36 to 0.88. Similarly, Penn Wharton economists estimate an upper range output multiplier of 0.56 for the $1.9 trillion American Rescue Plan stimulus package in 2021.
A key concern of economists and policymakers during an economic downturn is avoiding a negative economic output gap—that is, the gap between nominal GDP and potential nominal GDP. When an economy experiences negative growth, as in 2020, fiscal stimulus is often encouraged as a primary tool for boosting aggregate demand and closing the output gap. In pursuit of that goal, US policymakers in 2020 passed a series of fiscal stimulus packages spending a total of $5.2 trillion ($6.0 trillion was authorized). The unprecedented level of government spending was financed with both reserves created by the Federal Reserve (M2 money supply increased by over 40 percent between February 2020 and February 2022) and borrowing from the public by the Treasury (the deficit grew from $984 billion in 2019 to $2.8 trillion in 2021). This spending was circulated to the population through stimulus checks, expanded unemployment insurance, and other fiscal stimulus programs.
Stimulating demand was risky, given that the country was on lockdown, stay-at-home orders had been issued, and people were too afraid to leave their homes, preventing output from rising in response to elevated demand. In addition, the size of the stimulus was out of sync with the size of the output gap. At the start of the pandemic, the output gap was $2.3 trillion while the various COVID relief bills passed in 2020 totaled $4.0 trillion. In 2021, policymakers doubled down and passed a fiscal stimulus package of $1.9 trillion. At the time, the output gap that economists and policymakers were intent on closing was estimated at $700 billion for 2021 and 2022. Applying the Penn Wharton upper-range multiplier estimate of 0.56 to the level of spending passed by the American Rescue Plan, we can calculate that this level of stimulus was roughly $550 billion larger than the amount needed to close the output gap.
This explains why output eventually overshot its prepandemic trend following the passing of fiscal stimulus under the American Rescue Plan (see figure 4), causing the economy to overheat and creating the highest surge in inflation in over four decades.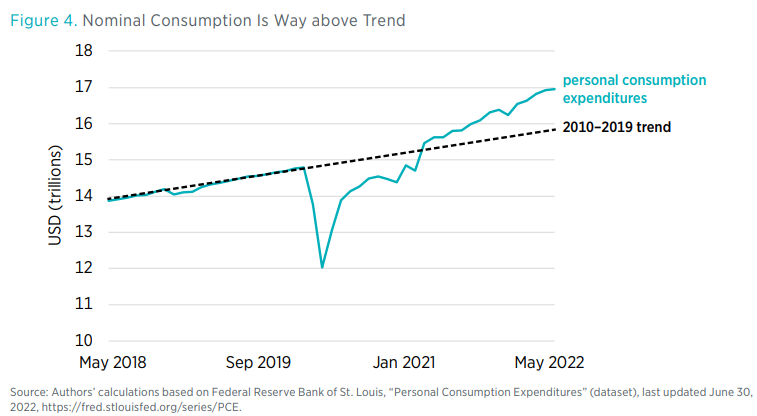
However, one must be aware of another fiscal dynamic to understand why America has high and persistent inflation. While the government was printing and borrowing an enormous amount of money to pay for all this spending, it had no plan (or expectation) to repay its debts or soak up the increase in money supply to reduce demand. That lack of fiscal probity is an important factor for why America has inflation today. Inflation emerges when the level of debt is too high relative to people’s expectations that this debt will be repaid in the future through higher revenues or reduced spending. This has important implications for the future ability of Congress to respond to emergencies.
Although the overheating and subsequent inflation of 2021 and 2022 are unlike anything experienced in the United States since the Great Inflation of the 1970s, the risk of high and persistent inflation following economic crises may well become more common now. If during the next emergency, government debt is too high relative to people’s expectations of repayment, then an increase in the deficit can cause inflation. That in turn would cause further fiscal problems. As the Federal Reserve raises interest rates to tame inflation, the cost of servicing public debt increases. If that increase is paid for with borrowed money, that could fan the flames of inflation further because investors may believe that inflation is the only way the government will discharge its debt. The fear of future inflation creates inflation today and raises the risk of a fiscal crisis.
Making matters worse, foreign demand for US Treasury debt has diminished in recent years (see figure 5). Since September 2019 the Federal Reserve has purchased almost $3.7 trillion of the roughly $6.3 trillion in newly issued debt, or about 58 percent of new debt issued by the Treasury. The Federal Reserve finances these debt purchases by increasing bank reserves, which add to the money supply. In addition, some of the debt is purchased by banks and domestic investors.
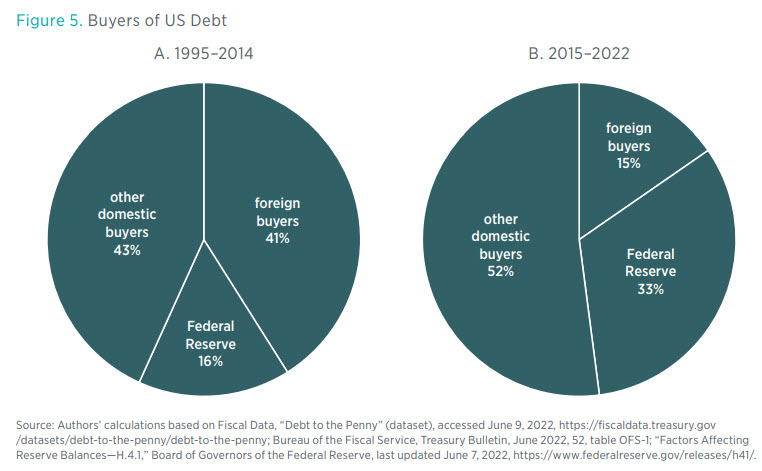
If this trend continues, the United States may no longer be able to rely on demand by foreign and domestic investors to absorb almost all of the debt the government issues, meaning that more of growing US deficits will have to be financed by the Federal Reserve, which in turn will increase inflationary pressures.
To illustrate how growing debt and diminishing fiscal multipliers could increase inflationary risk for the US economy moving forward, we use budgetary projection data and empirical estimates from the multiplier literature. On the basis of Congressional Budget Office (CBO) estimates and Penn Wharton budget models, we assume that fiscal multipliers in 2020/21 were roughly 0.6. CBO projects that in 10 years (2032) the public debt-to-GDP ratio will have increased by 10 percentage points from its Q1 2021 level. Applying estimates from the studies by Kirchner, Cimadomo, and Hauptmeier and Vranceanu and Besancenot as a rough rule of thumb, we estimate that fiscal multipliers are likely to decline from around 0.6 in 2021 to about 0.5 by 2032. In 20 years (2042), the public debt-to-GDP ratio is projected to reach 145 percent, which would imply fiscal multipliers declining to a range of 0.15 to 0.20 in 20 years’ time.
Figure 6 illustrates different hypothetical scenarios that are based on the size of the output gap and the size of the public debt-to-GDP ratio to estimate the level of stimulus spending policymakers would have to implement. Many factors can affect the actual size of the multipliers, which is why one should focus less on the actual numbers than on the variations between each scenario. Although these hypothetical scenarios offer a useful experiment in observing implied additional stimulus needed to fill the output gap, one should be cognizant that actual fiscal dynamics might not present such a clear-cut linear relationship.
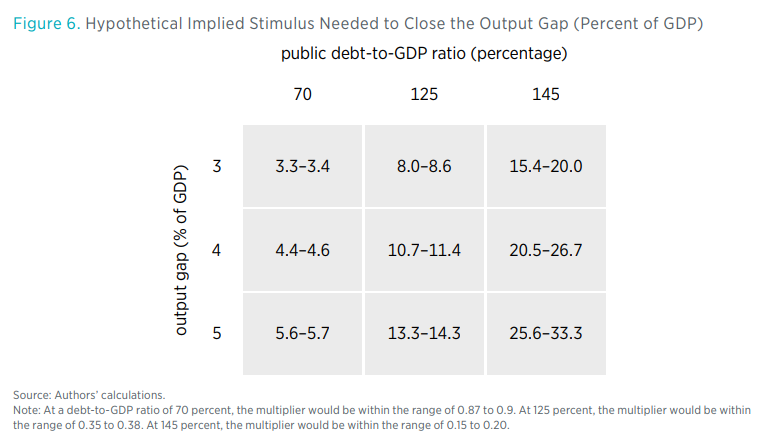
As the figure shows, assuming lower multipliers owing to higher levels of debt as the literature suggests, one sees that it will take larger stimulus packages to lift aggregate demand enough to fill the output gap. This will have consequences on the size of the deficit and interest payments. However, in trying to assess the impact that larger stimulus legislation will have on inflation, one must remember that, as noted earlier, debt-to-GDP ratios provide an incomplete measure of fiscal sustainability and, hence, are a poor indicator of fiscal limits. For instance, at the time of the Great Inflation and fiscal crisis of the 1970s, the debt-to-GDP ratio was 25 percent. Also, before Federal Reserve Chair Paul Volker increased interest rates to tame inflation, rates were relatively low. Yet inflation broke out and wrought havoc on the economy. Meanwhile, the country has had elevated levels of debt relative to GDP since the Great Recession of 2008, but not inflation until recently. In fact, as long as expectations of the amount of debt that will be repaid with future surplus are in line with the present value of the debt, then inflation won’t break out.
This allows one to imagine three scenarios:
Scenario 1. Large deficit spending in a low-interest-rate environment with fair expectations of repayment won’t produce inflation. Arguably, America was in this situation until 2020.
Scenario 2. Large increases in borrowing at low interest rates with low expectations of repayment will increase inflation risk. This is the situation American finds itself in today.
Scenario 3. Large deficit spending in a higher-interest-rate environment with low expectations of repayment will increase the risk of inflation. This, we fear, is where America may be heading.
Conclusion
In light of the ongoing debate surrounding (1) the importance of America’s debt trajectory and (2) what drives high and persistent inflation, economists and policymakers should explore the role of public debt in suppressing fiscal multipliers. A notable pattern emerges from existing research published since the GFC pointing toward a well‐documented conclusion that high levels of public debt have a negative impact on the size of spending multipliers. As the level of public debt continues to grow, the use of fiscal tools to alleviate future economic crises will prove less effective owing to lower fiscal multipliers. This will require larger amounts of spending to fill the output gap. Unless the spending is matched with an equivalently large promise of debt repayment, the government’s future fiscal responses will contribute to higher and more persistent inflation. This reality is an additional reason to focus on the country’s debt level.

