- | Healthcare Healthcare
- | Data Visualizations Data Visualizations
- |
Health Care Spending in the United States Before the Affordable Care Act
Mercatus Center senior research fellow Veronique de Rugy revisits data from the Centers for Medicare and Medicaid Services (CMS) to shed light on how health care expenditures have changed over time. This data accounts for the years preceding the enactment of the ACA to paint a clear picture of where U.S. health care spending stood before the ACA’s massive expansion of public health insurance programs.
Health care is once again taking center stage. Friday marked the Affordable Care Act’s (ACA) two-year anniversary. This week the Supreme Court will hear arguments on the health care bill and discuss the future of the ACA.
Mercatus Center senior research fellow Veronique de Rugy revisits data from the Centers for Medicare and Medicaid Services (CMS) to shed light on how health care expenditures have changed over time. This data accounts for the years preceding the enactment of the ACA to paint a clear picture of where U.S. health care spending stood before the ACA’s massive expansion of public health insurance programs.
1. Breakdown of National Health Care Expenditures (updated version of previous chart from 2010)
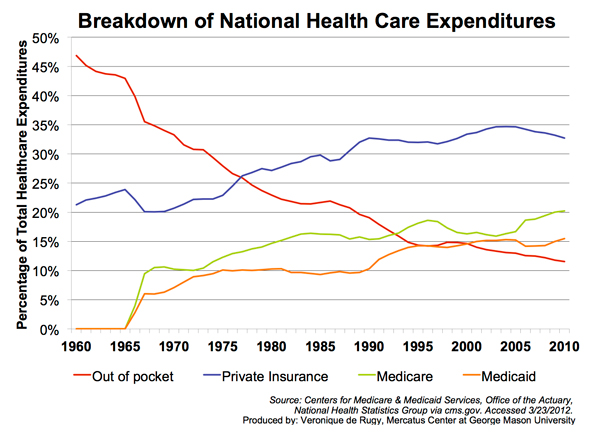
This chart shows out-of-pocket payments by consumers and spending by Medicaid, Medicare, and private insurers on health care from 1965 to 2008. Consumers’ out-of pocket spending on health care has decreased steadily as a percentage of the United States’ overall health care spending since the passage of Medicare in 1965 from its peak of 43 percent in 1961.
The most recent data show that there is a widening gap between Medicare and Medicaid shares in national health care expenditures. When Medicaid took a slight dip in 2005, Medicare persisted and continued to grow at a faster rate than Medicaid. In the meantime, private insurers’ spending has increased by an average 10.8 percent annually since 1965.
2. Personal Health Care Expenditures by Source of Funds, 1970–2010
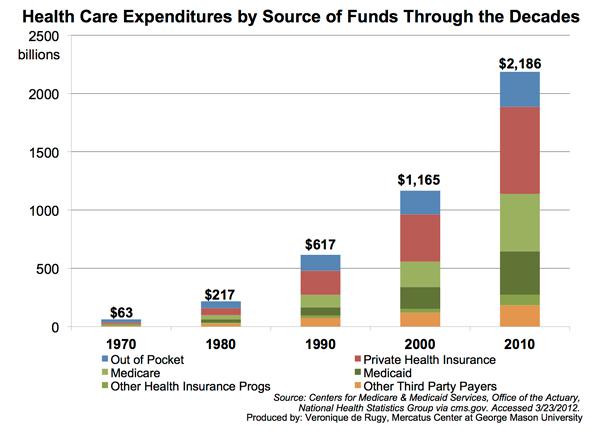
This chart shows the components of personal health care expenditures through each decade from 1970 to 2010, using the most recent data from the CMS. Total health care expenditures in 2010 were 34 times the total amount in 1970. After every decade, total health care expenditures increased at least two-fold. During the initial decades of 1970 through 1990 these amounts increased three-fold.
3. Private vs. Government Share of Health Care Expenditures, 1987–2010
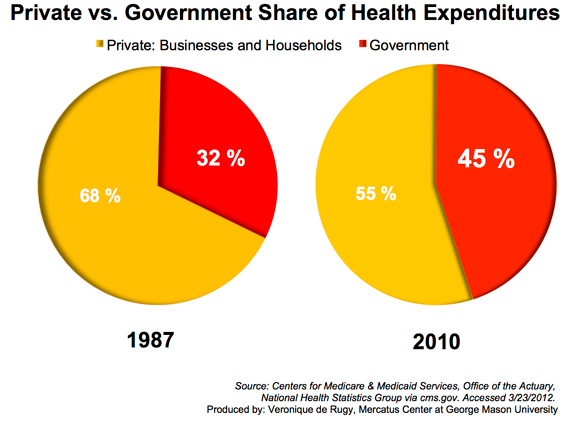
This chart shows the relative shares of private- versus government-funded health care expenditures since 1987 using CMS data. In 1987, the government supported roughly 32 percent of health care expenditures. Today this number has increased to 45 percent, or nearly half of all health expenditures in 2010. Private businesses' and households' share of health expenditures shrank by 13 percent between 1987 and 2010.
Related Content
- | The Fiscal Consequences of the Affordable Care Act The Fiscal Consequences of the Affordable Care Act
- | Research Papers Research Papers
Summary: The Fiscal Consequences of the Affordable Care Act
- | Government Spending Government Spending
- | Expert Commentary Expert Commentary
Rushed Rules of Health Care Law Don't Add Up

- | Healthcare Healthcare
- | Expert Commentary Expert Commentary
SCOTUS Tackles Health Care Law: Five Possible Outcomes

- | Government Spending Government Spending
- | Data Visualizations Data Visualizations

