- | Regulation Regulation
- | Data Visualizations Data Visualizations
- |
The Accumulation of Regulatory Restrictions Across Presidential Administrations
Presidents and their administrations wield extraordinary authority over federal regulation. While executive agencies can only write rules within the bounds set by Congress, their mandates are often expansive. Presidents set priorities, appoint and direct agency leadership, and determine how and when to review proposed or existing rules for cost-efficiency and consistency. These decisions materially affect the pace of regulatory accumulation during a president’s time in office, which in turn affects the cost and complexity of doing business in the United States.
Presidents and their administrations wield extraordinary authority over federal regulation. While executive agencies can only write rules within the bounds set by Congress, their mandates are often expansive. Presidents set priorities, appoint and direct agency leadership, and determine how and when to review proposed or existing rules for cost-efficiency and consistency. These decisions materially affect the pace of regulatory accumulation during a president’s time in office, which in turn affects the cost and complexity of doing business in the United States.
This accumulation can be measured by counting individual restrictions in the Code of Federal Regulations (CFR). RegData identifies individual restrictions using specific words and phrases—shall, must, may not, prohibited, and required—that typically mark a specific action either required or forbidden by the regulation. The CFR contains all regulations currently in force, so its annual publication allows us to collect a running tally of individual restrictions.
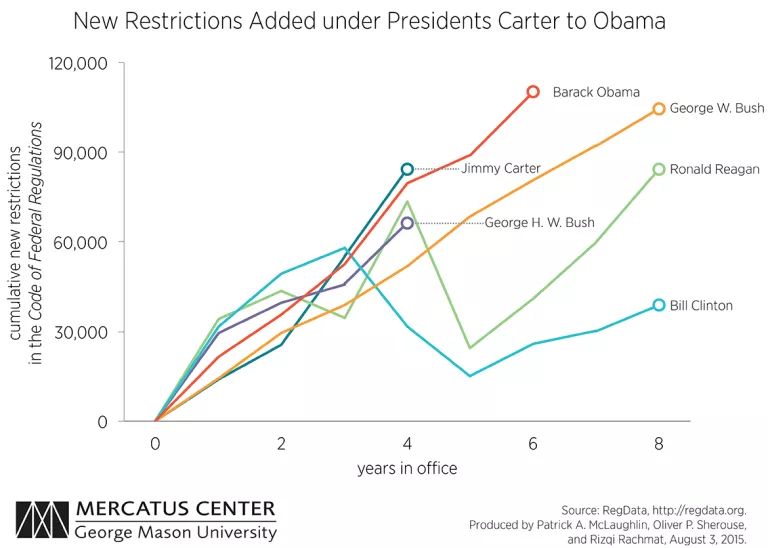
These charts show the accumulation of regulation during all administrations since President Carter’s through 2014. The first shows the trend of total restrictions across each president’s time in office.
Every term shows a visible increase in the total number of regulatory restrictions, except for Reagan’s second term, which shows a flat trend. Across no president’s term did the total number of regulatory restrictions actually decline. The cumulative effect of these increases by successive presidents is a near-doubling of total regulatory restrictions, from about 580,000 when President Carter took office to about 1,070,000 in 2014.
Which presidents contributed most to the accumulation of restrictions? The second chart shows the absolute increase of regulatory restrictions in each presidential term.
President Obama not only oversaw the greatest increase in regulatory restrictions in a single term, his first, but as of 2014 he has edged past President George W. Bush as the president with the greatest total increase in restrictions since 1976. Presidents Carter and George H. W. Bush both had increases of more than 70,000 in their first terms, but both lost their reelection bids. Interestingly, while Presidents George W. Bush and Clinton both added regulations at similar rates across their two terms—with Clinton adding significantly fewer restrictions overall compared to Bush—President Reagan oversaw a large increase in regulation during his first term, but a relatively small increase during his second term.
Related Content
- | Regulation Regulation
- | Data Visualizations Data Visualizations
The Food and Drug Administration and the Federal Food, Drug, and Cosmetic Act
- | Regulation Regulation
- | Data Visualizations Data Visualizations
The Code of Federal Regulations: The Ultimate Longread
- | Regulation Regulation
- | Data Visualizations Data Visualizations
Measuring the Content, Not Just the Number, of Executive Orders and Proclamations

- | Regulation Regulation
- | Data Visualizations Data Visualizations

