- | Regulation Regulation
- | Data Visualizations Data Visualizations
- |
Regulatory Data on Trump’s First Year
President Donald Trump, both as a candidate and throughout his first year in office, repeatedly and famously promised to reform the regulatory state. Then again, every president since Jimmy Carter also promised to reduce red tape by identifying and pruning those regulations that are, for example, obsolete, duplicative, or ineffective.
As the saying goes, talk is cheap. What do the numbers—the numerous metrics of the stock and flow of regulation—tell us about the Trump administration’s first year of regulatory reform? For one, the growth of regulation has clearly slowed. During President Trump’s first year, federal regulations grew by about 0.65 percent, less than the growth rate of any other president’s first year in office since our data begin in 1970. This rate of growth is also less than one-third of the long-term annual growth rate for federal regulations, which, from 1970 to 2016, was about 2.1 percent.
Regulations are still growing, though at a slower pace. The momentum of the regulatory state—a collection of hundreds of departments, agencies, and suboffices—continues in the direction of always making more rules. As one of my former students brilliantly put it, “regulators regulate—it’s what they do.” It is difficult to convince hundreds of thousands of people who view their job as “rule makers” to instead become “rule managers.”
An objective method of measuring regulations over time is a necessary initial step.
In 2017, Mercatus launched a major policy analytics initiative called QuantGov, which applies the analytics tools of data science to regulation, legislation, executive orders, and other policy-relevant documents. The idea behind QuantGov was to generalize the RegData approach that Mercatus pioneered beginning in 2012 and produce policy analytics data from other documents besides federal regulations found in the Code of Federal Regulations (CFR). The QuantGov project has thus launched one database based on executive orders and another based on documents found in the Federal Register.
Below, we use a variety of QuantGov-produced metrics to objectively test the extent to which President Trump’s first year in office has differed from years past and from other presidents, beginning with the original and best known of these metrics, RegData. We start by looking at a fairly common metric (and one that is not unique to QuantGov), the number of rulemaking actions that regulatory agencies have taken in each year from 1996 through 2017. More granular data produced through the QuantGov initiative, using RegData 3.0, show a growth of regulatory restrictions from 1970 through 2016. Then, with a supplementary dataset, we show how that growth rate decreased during President Trump’s first year in office. This also allows us to compare regulatory data for the first years in office for every president since 1970. Finally, we examine changes in the levels of regulation for cabinet-level departments and agencies in the first years of Presidents G. W. Bush, Obama, and Trump.
We start with “regulatory and deregulatory actions”—terms that have been recently used by the Trump administration in documents and speeches about regulatory reform in its first year. The regulatory process can be complicated, whether it is to create a new regulation or to modify or eliminate an existing one. Regulatory agencies must act in accordance with the Administrative Procedure Act and other policies like Executive Orders 12866 and 13771. Several “actions” may be required in order to accomplish a single end goal, such as the creation of a new regulation.
Agencies engage in rulemaking anytime that they modify the existing body of federal regulations in the CFR. A modification to the CFR could mean adding new text, changing existing text, or eliminating some existing text. That is one reason why an action can be “regulatory” or “deregulatory” in nature. A typical rulemaking will comprise at least two actions, although many will include more than two. Nonetheless, in the prototypical example, the issuing agency’s first action is to publish a notice of proposed rulemaking, which notifies the public of its intent to change the CFR in some way, explains why it is doing so, and documents how the revised regulations would subsequently work. Later, after a public comment period on the proposed rule, the issuing agency will usually publish a final rule, in which it explains any changes or other details that were not contained in the original proposal. These two actions are part of a single “rulemaking.”
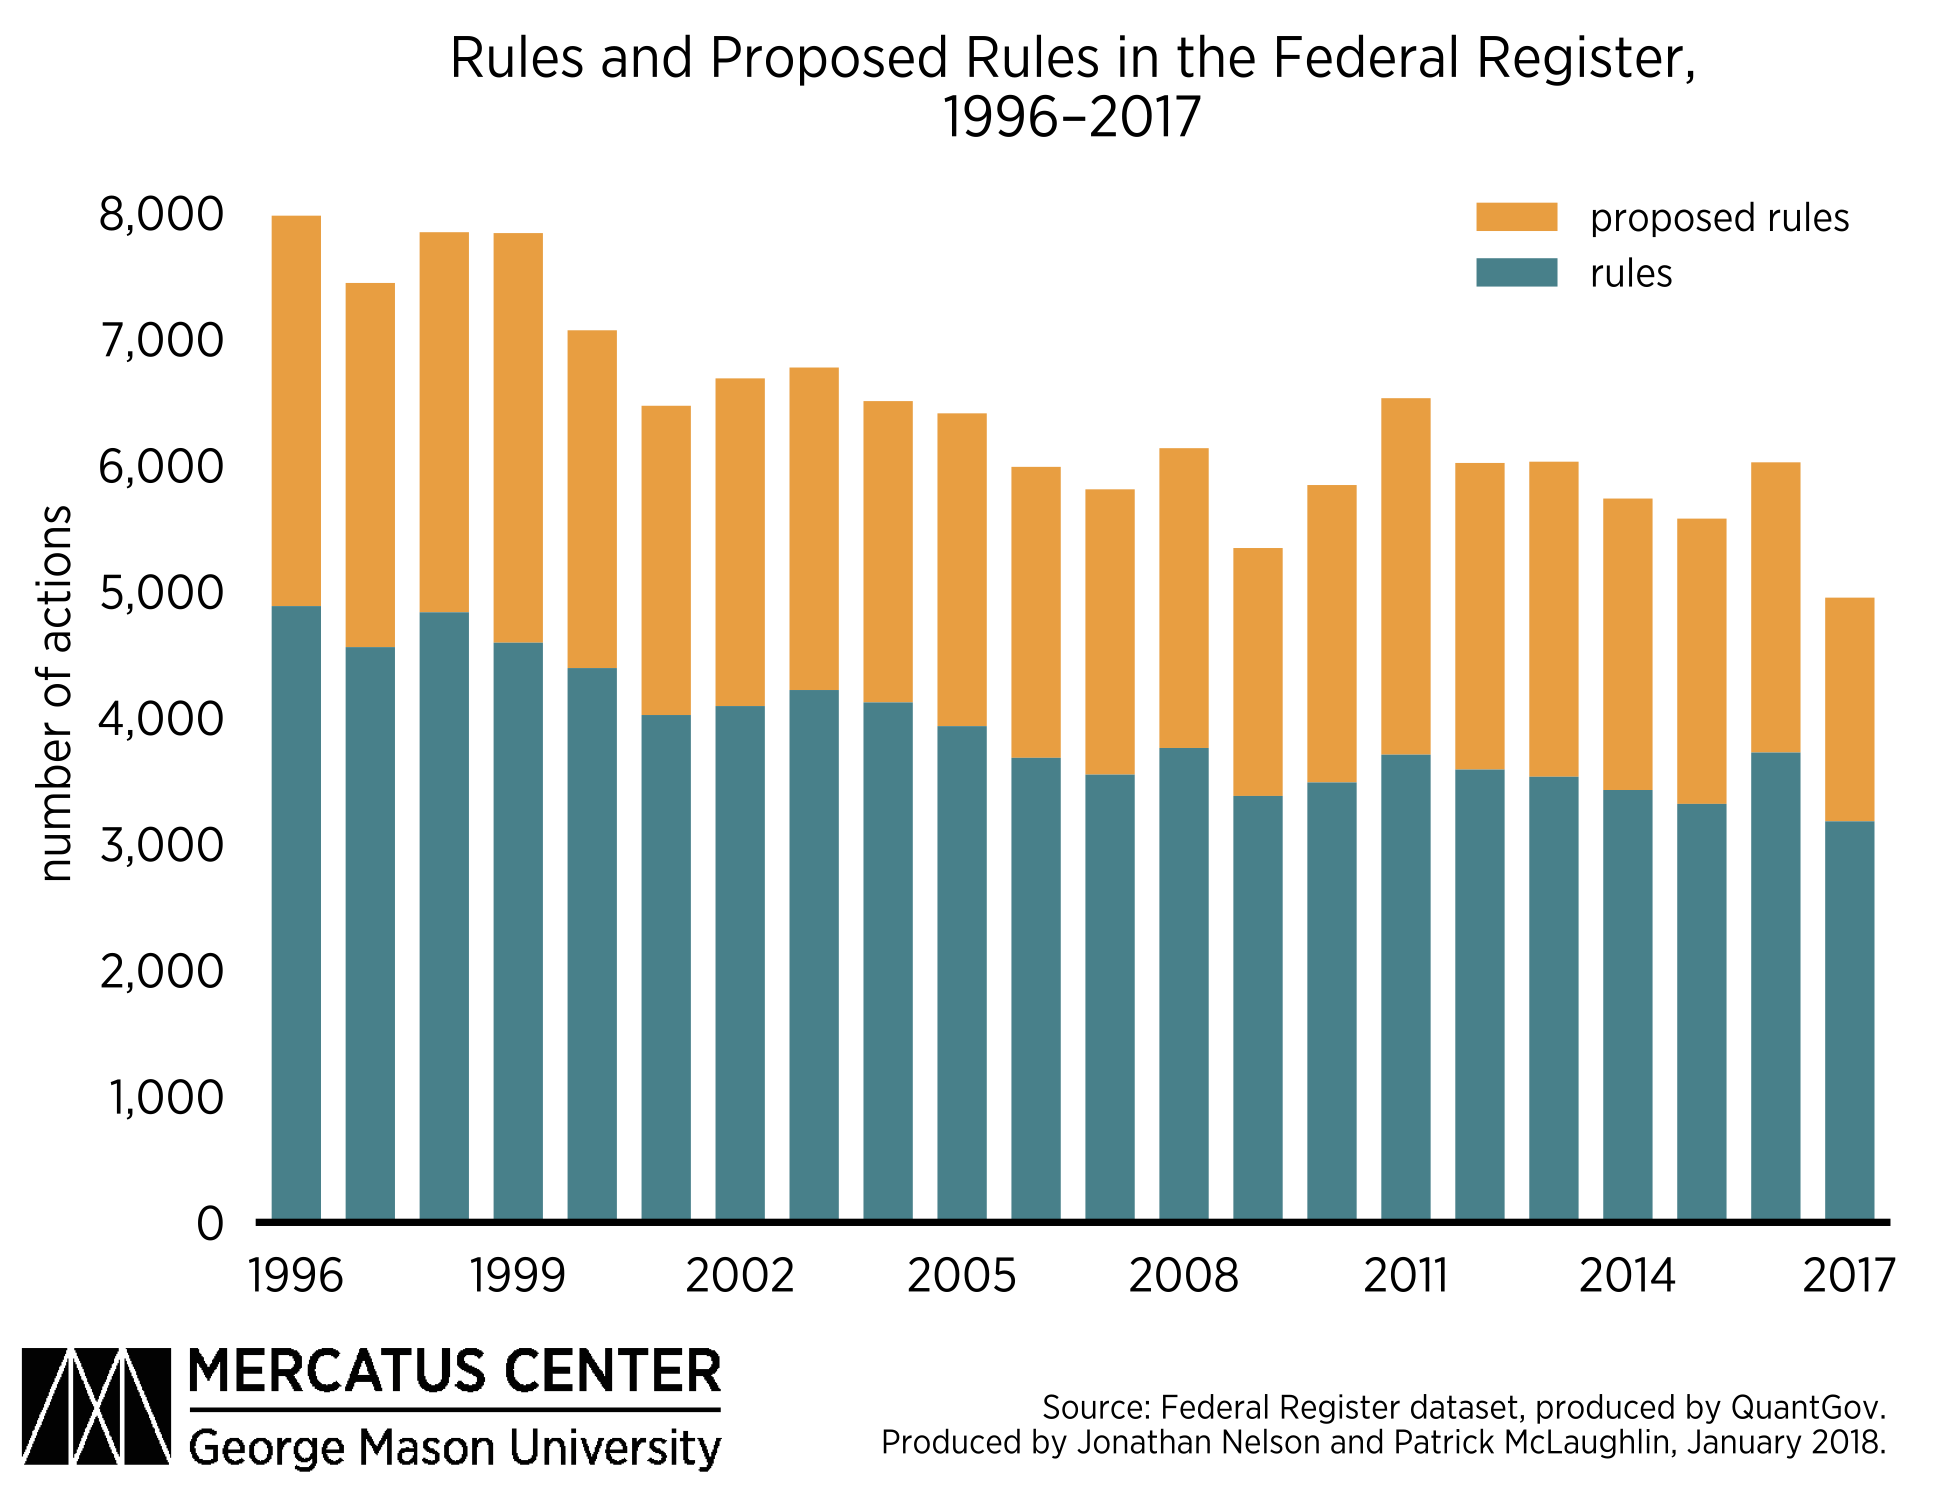
All of these actions—regulatory or deregulatory—are published in the Federal Register. The following figure quantifies the publication of proposed rules and of final rules—two subsets of rulemaking-related actions—in the Federal Register by year for the past 22 years, including 2017.

This figure is a good starting point for evaluating the Trump administration’s first year with respect to regulation. From 1996 to 2016, the average number of rulemaking actions was much higher than the number of actions taken in 2017—an average of 6,477 actions per year versus 4,949 in 2017. If nothing else, this shows a decrease in actions compared to previous years. However, these numbers tell us little about the nature of those actions.
While some regulatory actions may be purely regulatory or purely deregulatory, many actions are both. The net effect could mean an increase in the quantity of regulations on the books or in the burden each regulation imposes, or the effect could go the other direction. Similarly, an action that has a net regulatory or net deregulatory effect could have either a very small impact or an enormous impact, depending on the nature of the changes the action induces. One way to understand the direction and magnitude of each rulemaking’s net effect would be to perform comprehensive economic analysis for each rulemaking in order to prospectively estimate its benefits and costs. However, such comprehensive analyses are relatively rare. We turn instead to two other QuantGov-produced data series, RegData 3.0 and the Electronic Code of Federal Regulations (eCFR) dataset.
A rulemaking concludes with the publication of a final rule in the Federal Register. At that point, the modifications to regulations made by the rulemaking begin to be reflected in the eCFR—the online version of the CFR—and later in the hard copy version. That means that we can analyze the CFR and the eCFR to see what sorts of changes to regulation have occurred over time.
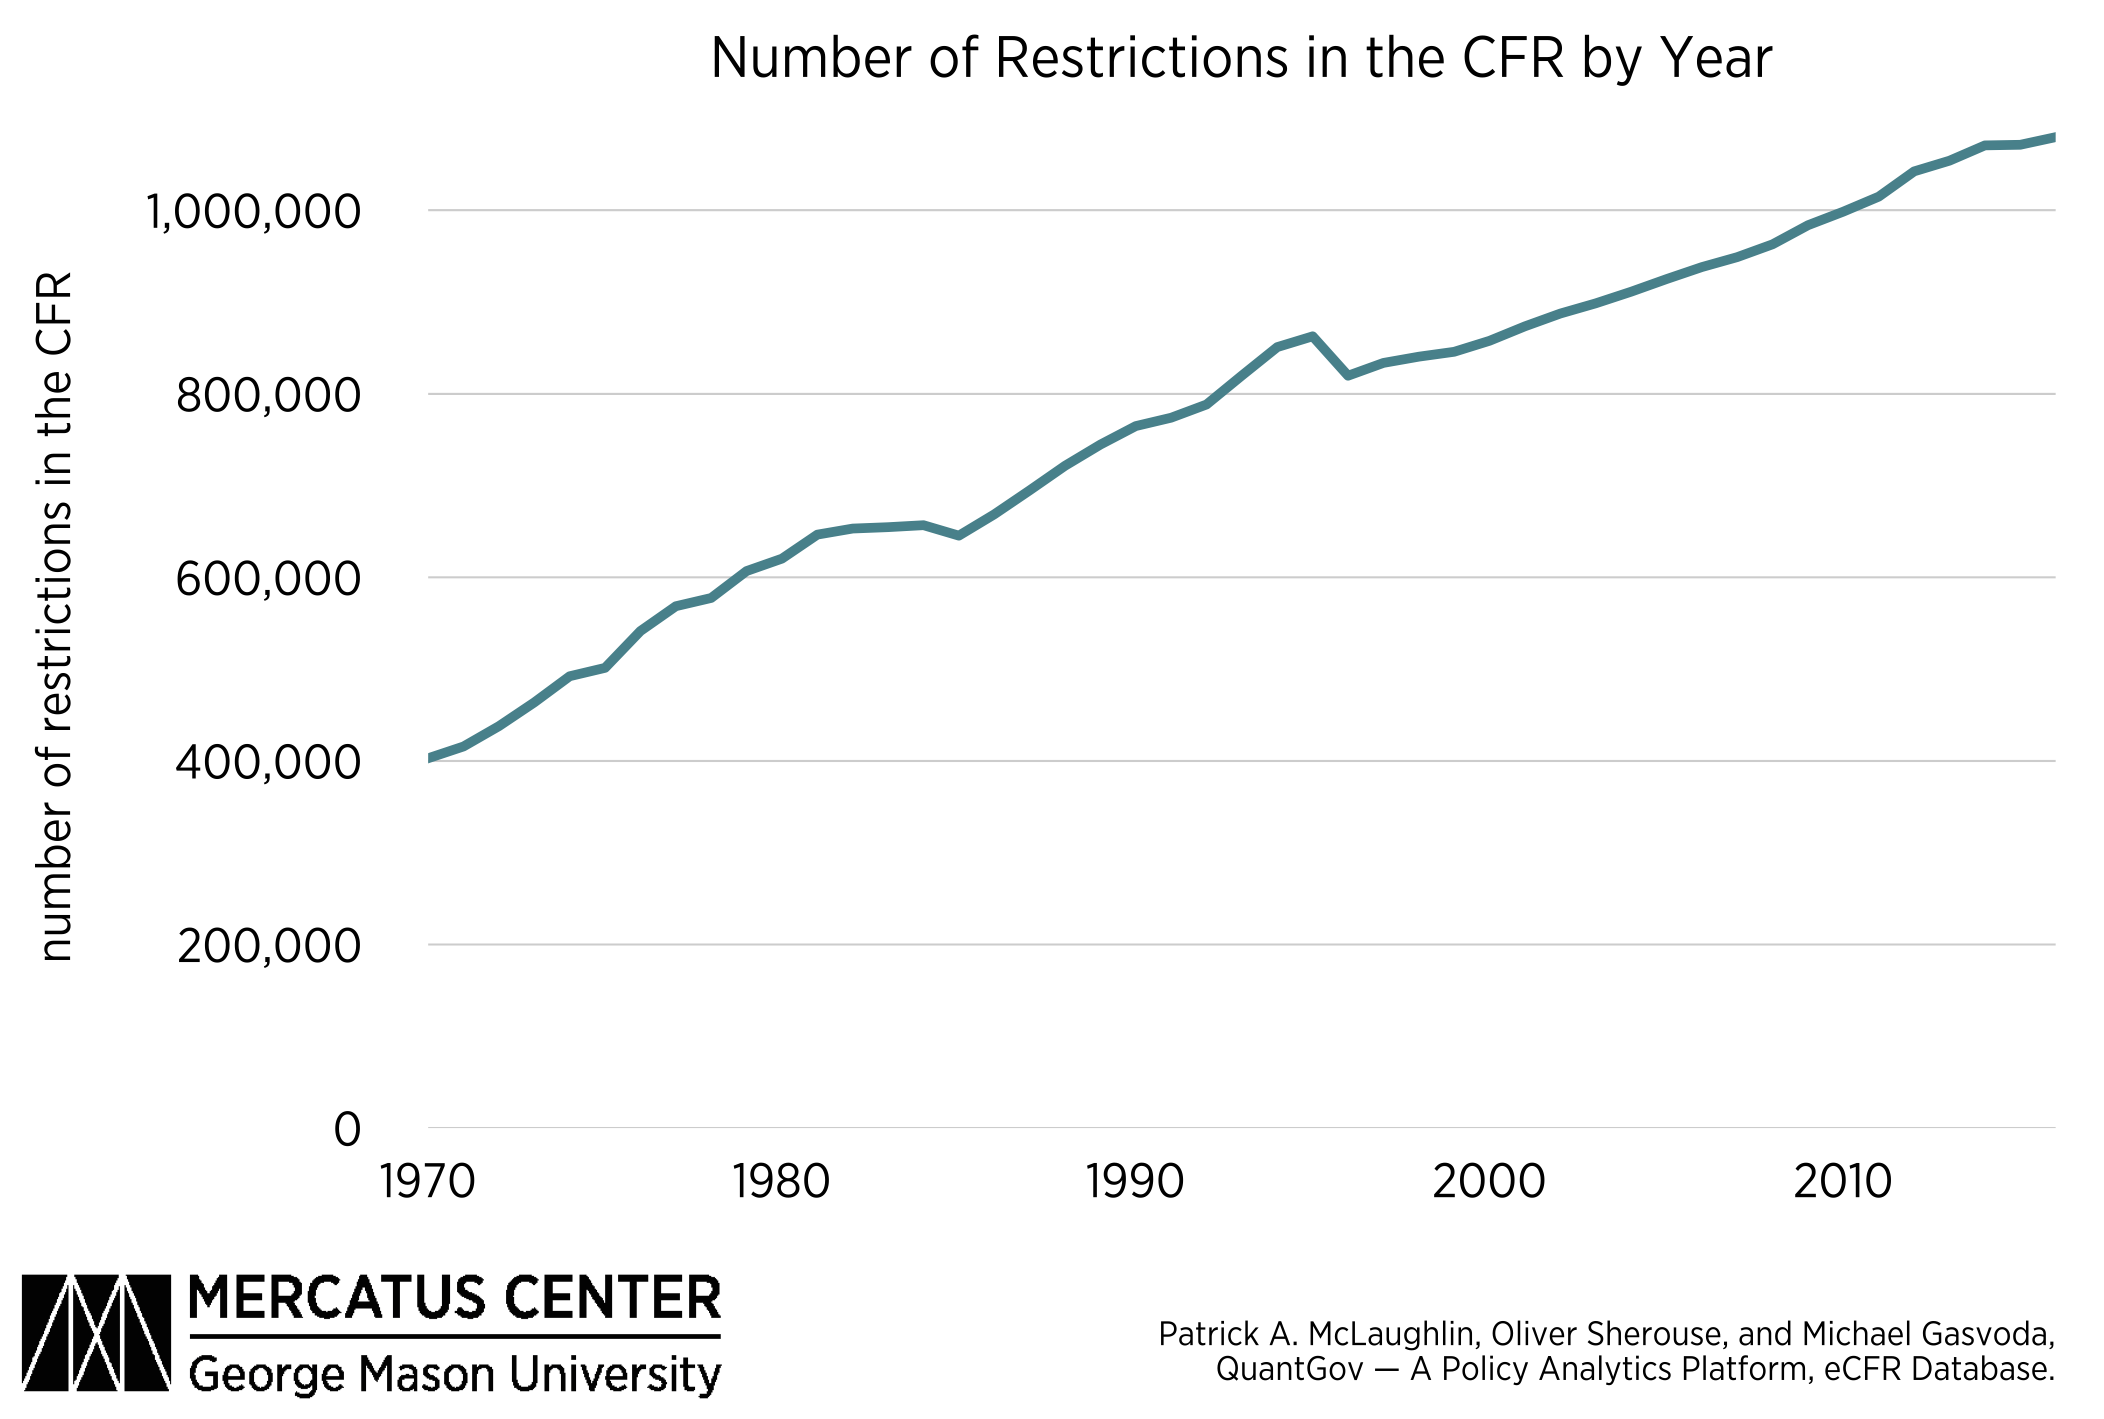
The figure below shows historical data from the RegData 3.0 dataset, which is based on the traditional set of books where regulatory code is published, the CFR. The metric depicted in this figure, regulatory restrictions, is produced by counting select words and phrases, such as shall or must, that are typically used in legal language to create binding obligations or prohibitions. The number of regulatory restrictions on the books at any given point time is an indicator of the total impact of federal regulations on the economy, as well as of the complexity of regulatory code.

In 1970—the first year available in RegData 3.0—there were just over 400,000 regulatory restrictions in the CFR. That number grew to be greater than 1,080,000 at the end of 2016. President Trump inherited from his predecessors both a large set of existing regulations and a strong tradition of consistent growth.
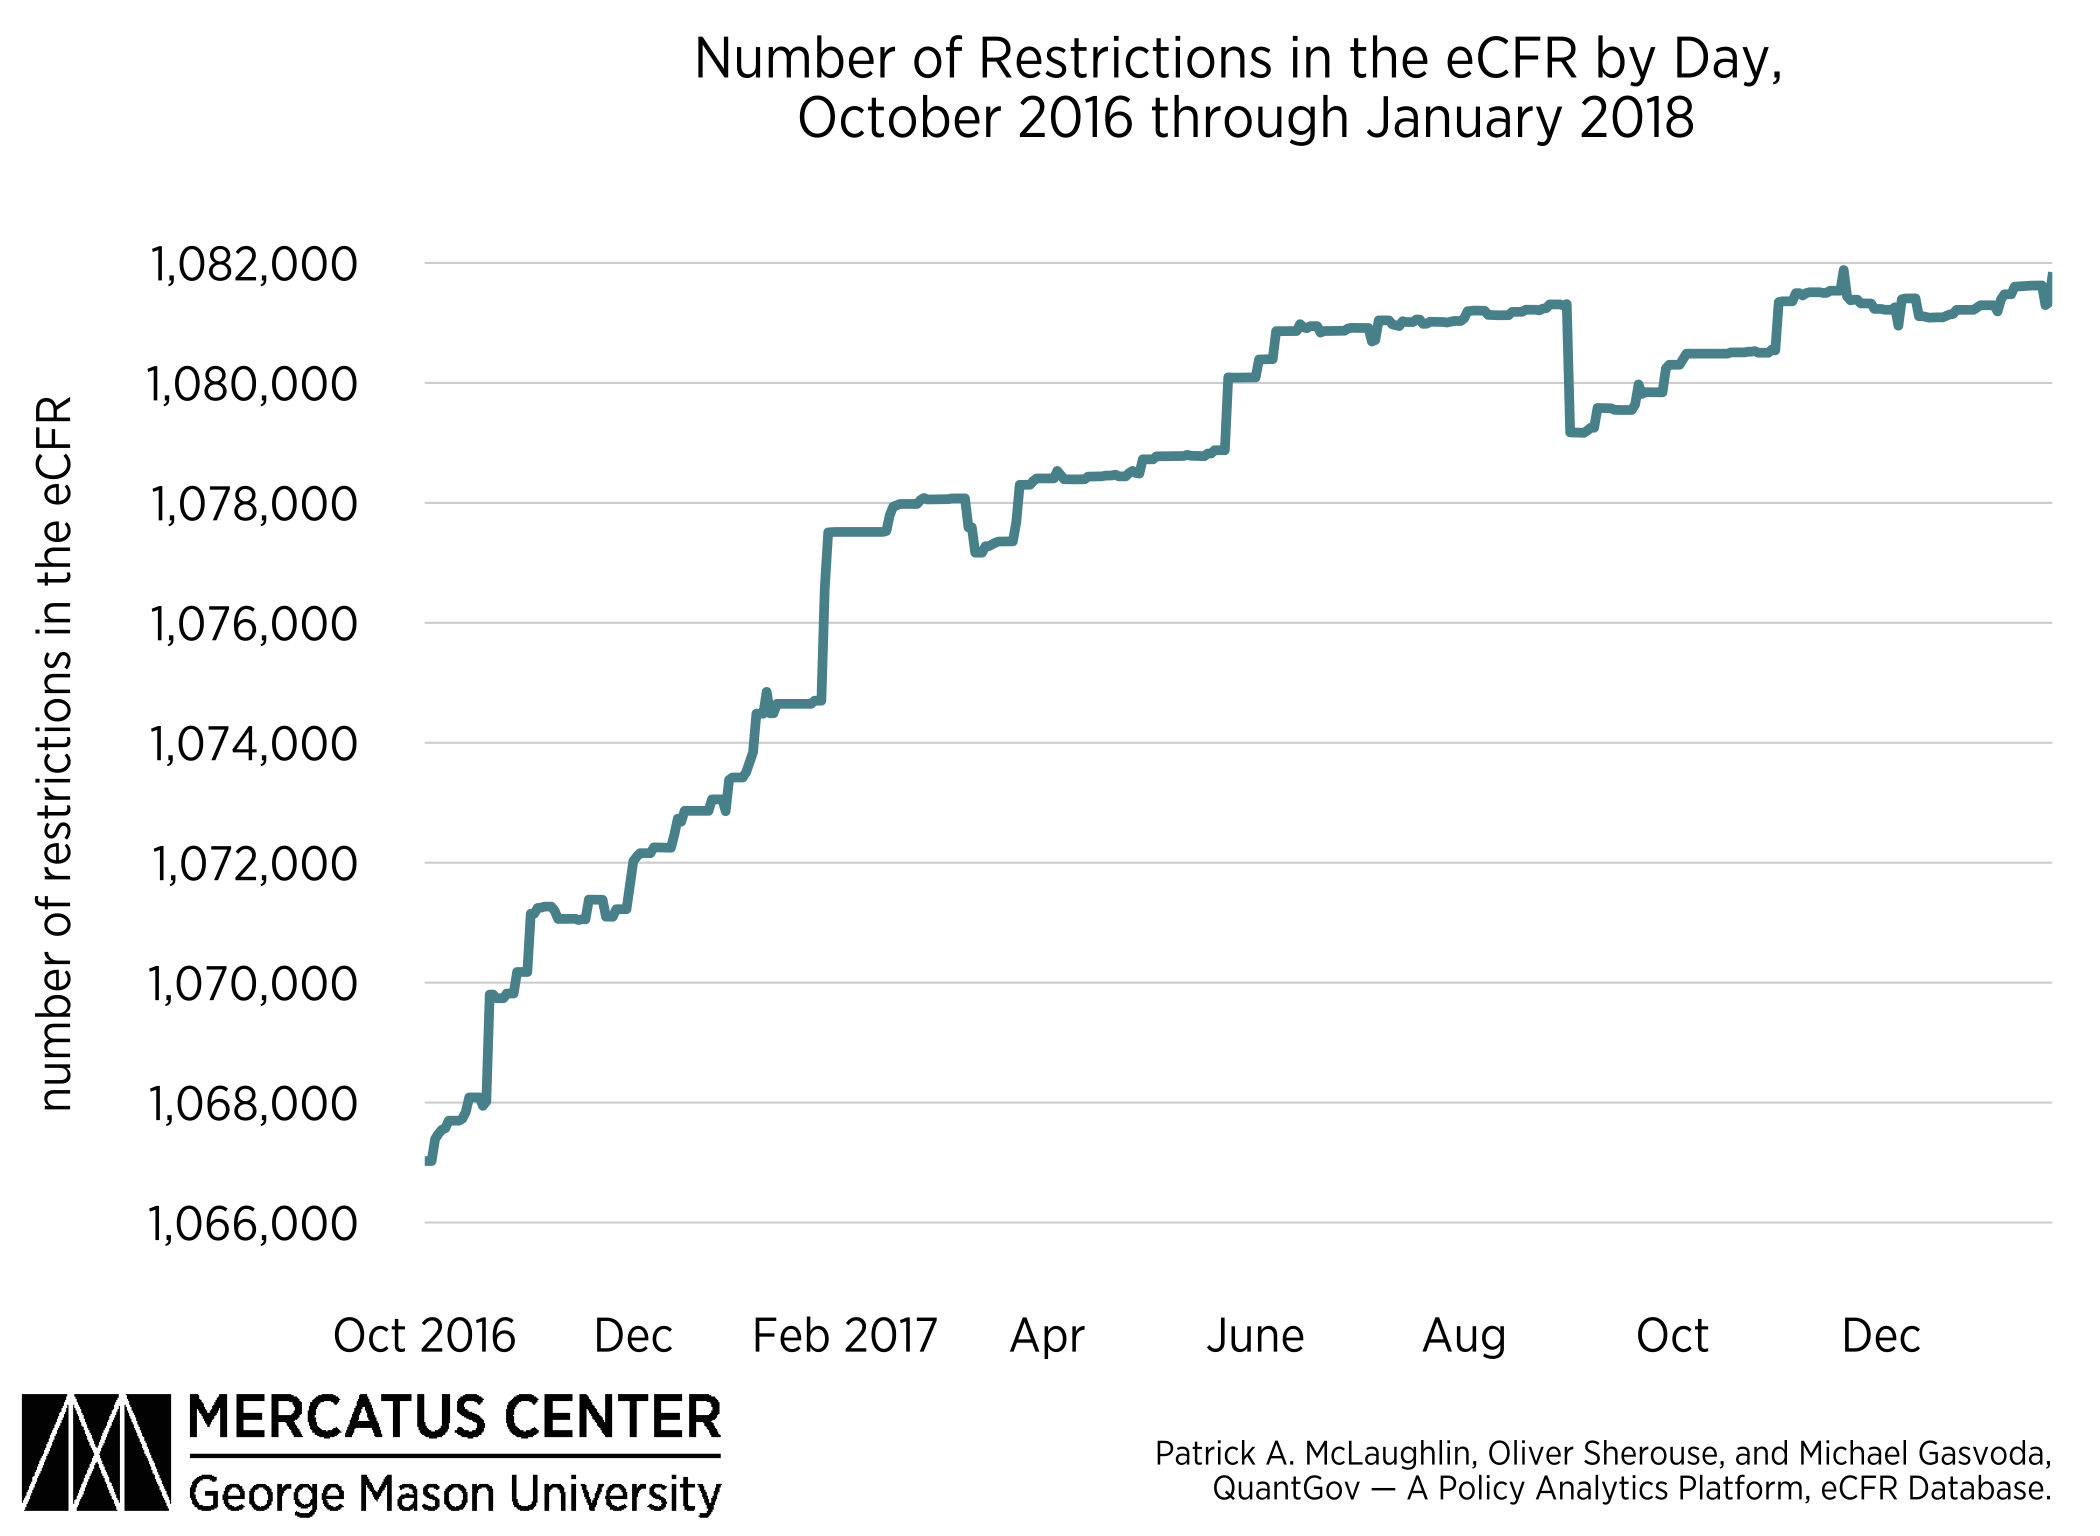
The next figure also shows regulatory restrictions, but from a different dataset—the eCFR dataset. Instead of using text from the annual CFR, the eCFR dataset and the figure below are based on text found in the eCFR. Unlike the CFR, which is only updated in its entirety annually, the eCFR is updated daily—so it reflects changes that happen in between publications of the CFR. The eCFR dataset allows us to see changes in the regulations on the books in much closer to real time, whereas RegData 3.0 and its predecessors have always been backward looking.
There are some disadvantages to the eCFR dataset, though. Because RegData 3.0 and the eCFR dataset are based on different sources and published at different frequencies, there are some small differences between the two datasets. These differences are on the order of less than one percentage point, so while comparing data from RegData 3.0 to the eCFR dataset is subject to some noise, that noise is fairly minimal. The bigger drawback of the eCFR dataset is that it does not span a long period like RegData 3.0. While RegData 3.0 offers annual data from 1970 to 2016, the eCFR dataset contains daily data from October 1, 2016, to January 19, 2018.

The eCFR data, as shown in the figure directly above, yield an answer to one of the central questions about President Trump’s first year: was there a big deregulatory push? The numbers don’t show a massive deregulation—in fact, they show that the quantity of regulatory restrictions actually grew. But it grew by less than we might have expected based on historical patterns. The number of new restrictions created in year one of the Trump administration was 6,973. The average year from 1970 to 2016 saw 14,732 regulatory restrictions added to the CFR.
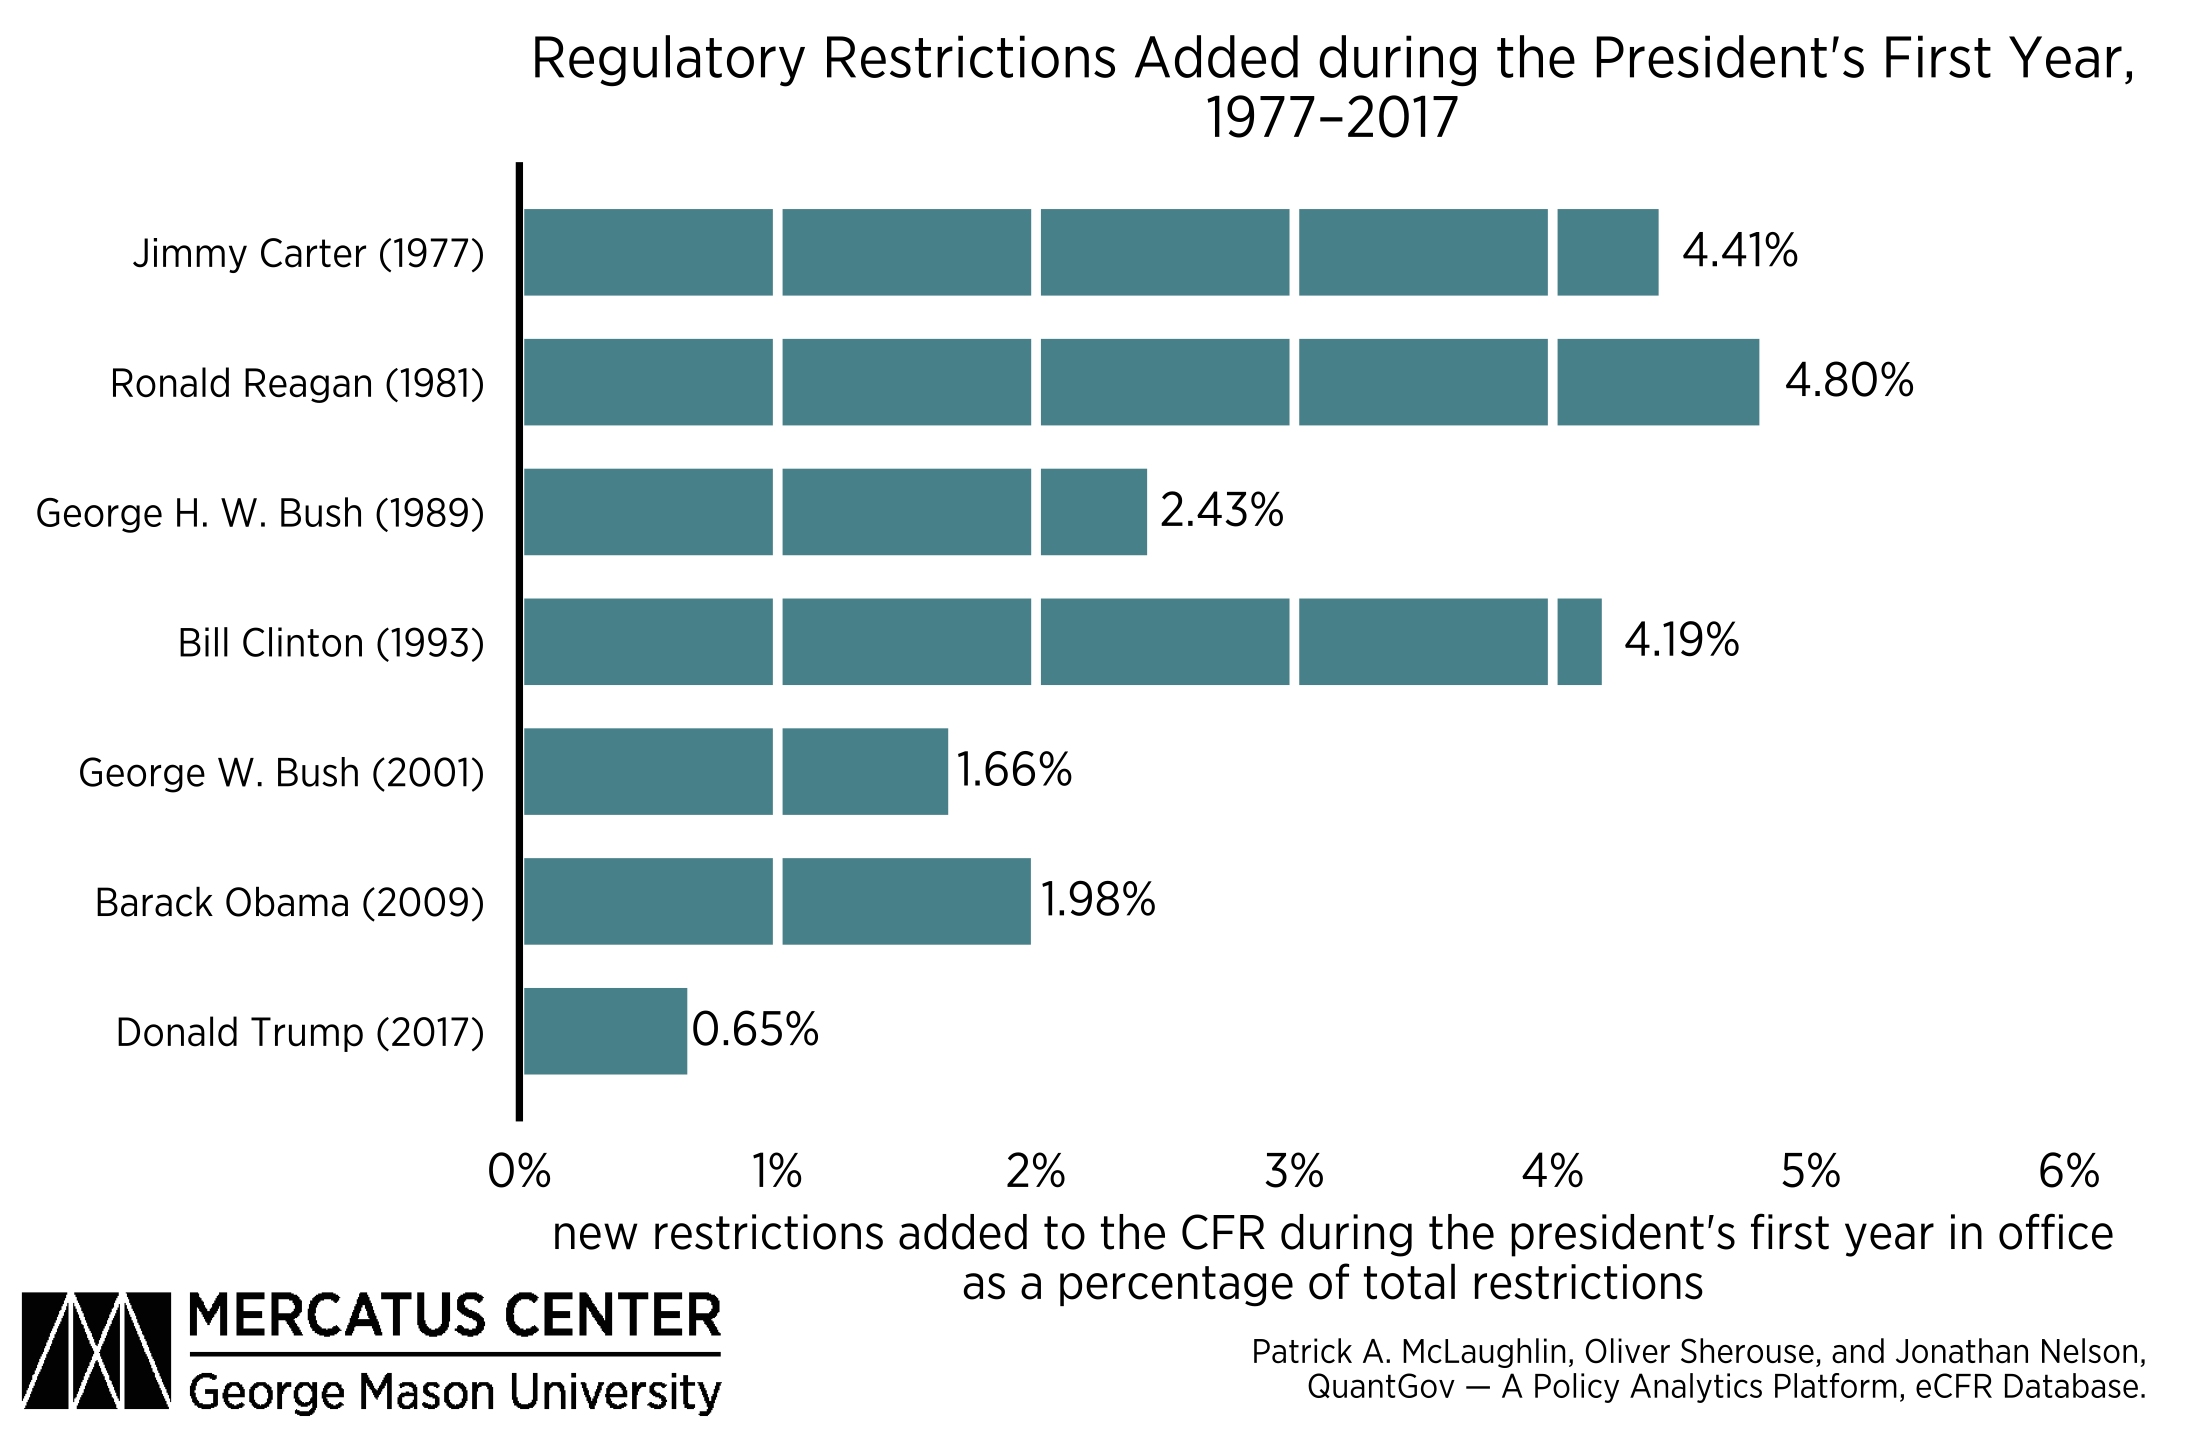
The combination of historical data from RegData 3.0 and recent data from the eCFR dataset also permits a fair comparison of the first year of the Trump administration to the first year of previous administrations. The next figure shows the percent change in total restrictions in the first years of presidents Carter, Reagan, Bush I, Clinton, Bush II, Obama, and Trump.

This figure shows that President Trump’s first year in office really was different from the first year of his predecessors—by a long shot.
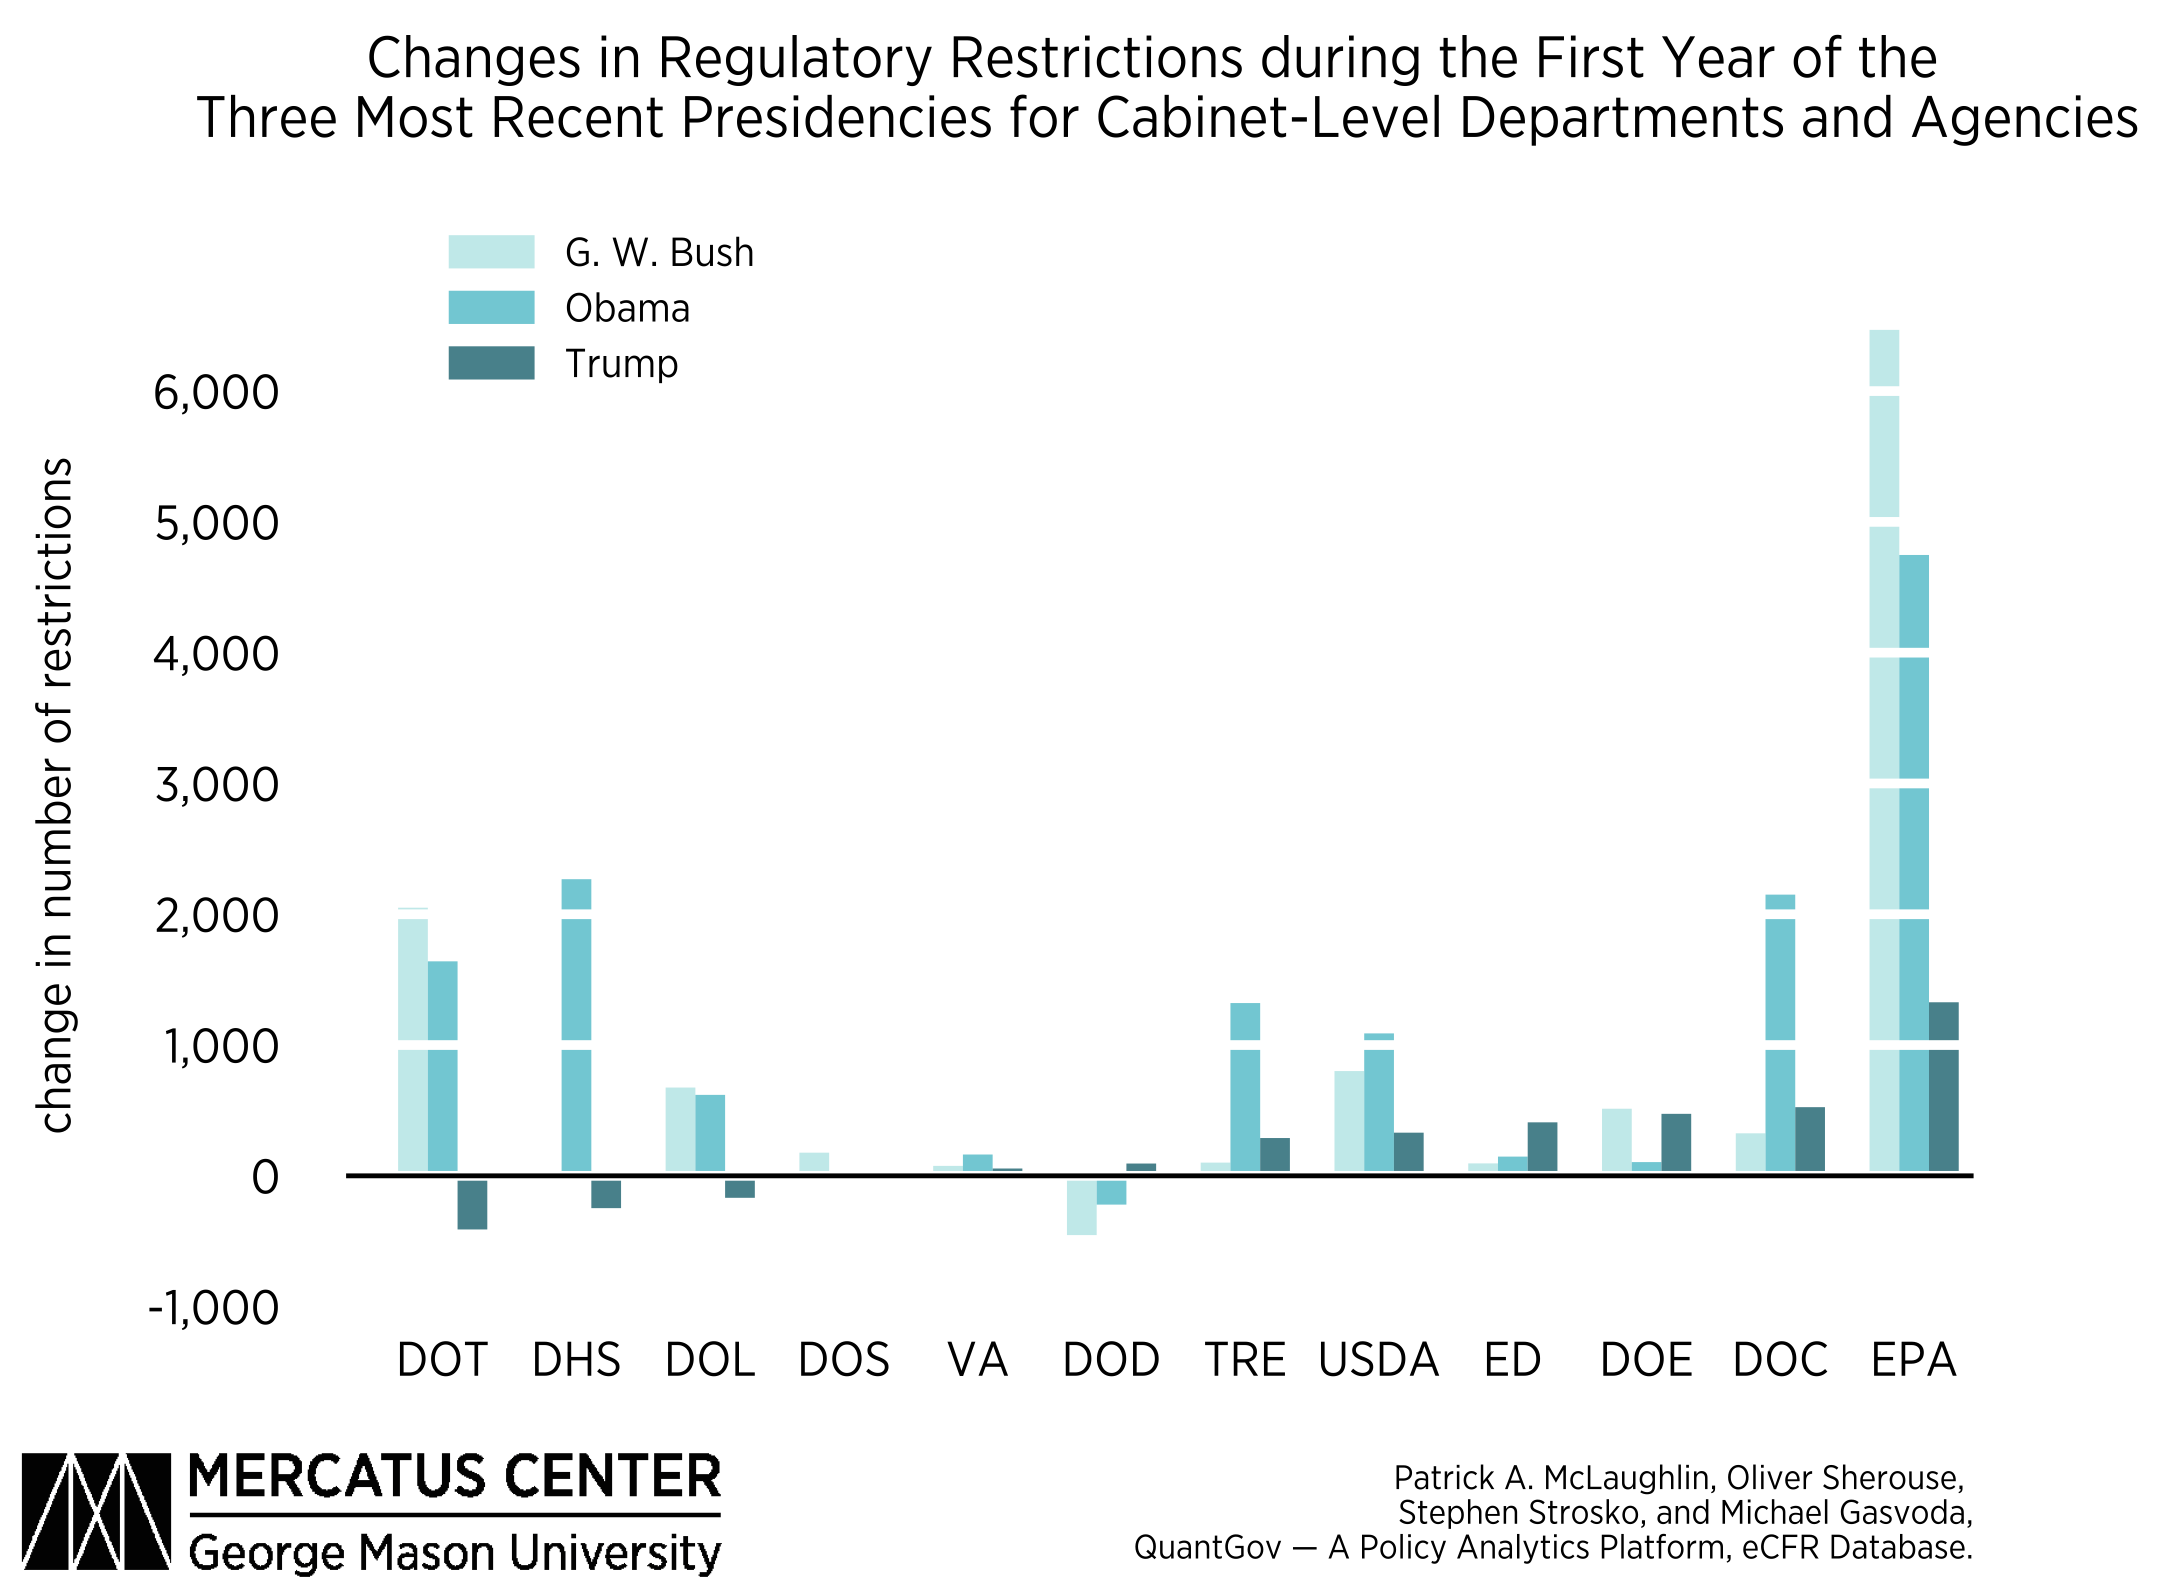
Of course, some presidents will have different priorities than others for their first years. To the degree that a president can control the regulatory process, differing priorities may show up in the data by focusing either on different regulatory agencies or on the different sectors and segments of the economy that are targeted by regulation. The final figure breaks data down by regulatory agency. For the purpose of this data visualization, this figure shows only cabinet-level departments and agencies.

Absent objective metrics, one claim about the quantity or nature of federal regulations stands as much chance as another. In this case, the numbers show that President Trump’s regulatory approach has changed the rate of growth of regulation. When we consider the number of people working in regulatory agencies who have traditionally viewed their jobs as “rule makers,” these numbers are actually pretty extraordinary. They may not represent a “dismantling of the regulatory state,” as some pundits would have you believe, but they definitely show a break from historical patterns. Only time will tell whether the trend will hold for subsequent years of the Trump administration.

