- | Housing Housing
- | Data Visualizations Data Visualizations
- |
A Snapshot of Ohio’s Budget Situation from 2006 to 2015
Considering both recent findings published by the Mercatus Center on Ohio public pensions and the analysis above, the state’s financial situation is likely to change in the future. Such change will necessitate spending cuts, tax increases, or both, and these difficult decisions will only become more difficult if action is delayed. Ohio voters, legislators, and the governor will have to decide which tradeoffs to make, and the sooner they act, the less painful the solution will be.
Ohio has a problem. Its public sector pensions are strained, and if retirees want their pensions to be paid in full the status quo cannot continue. In order for Ohio to adequately fund its pensions, some combination of spending cuts and tax increases is necessary, because Ohio’s economy is unlikely to grow its way out of the problem.
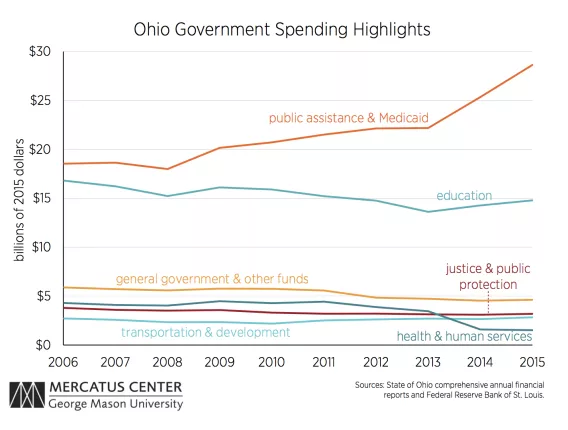
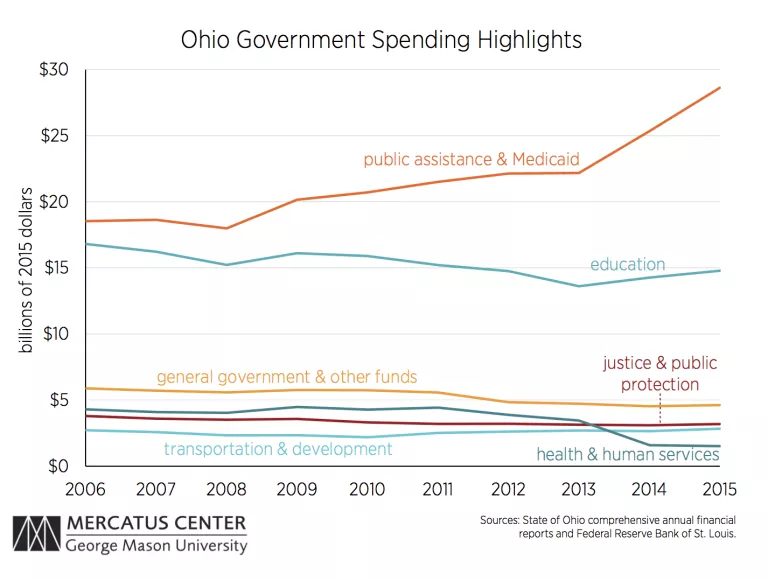
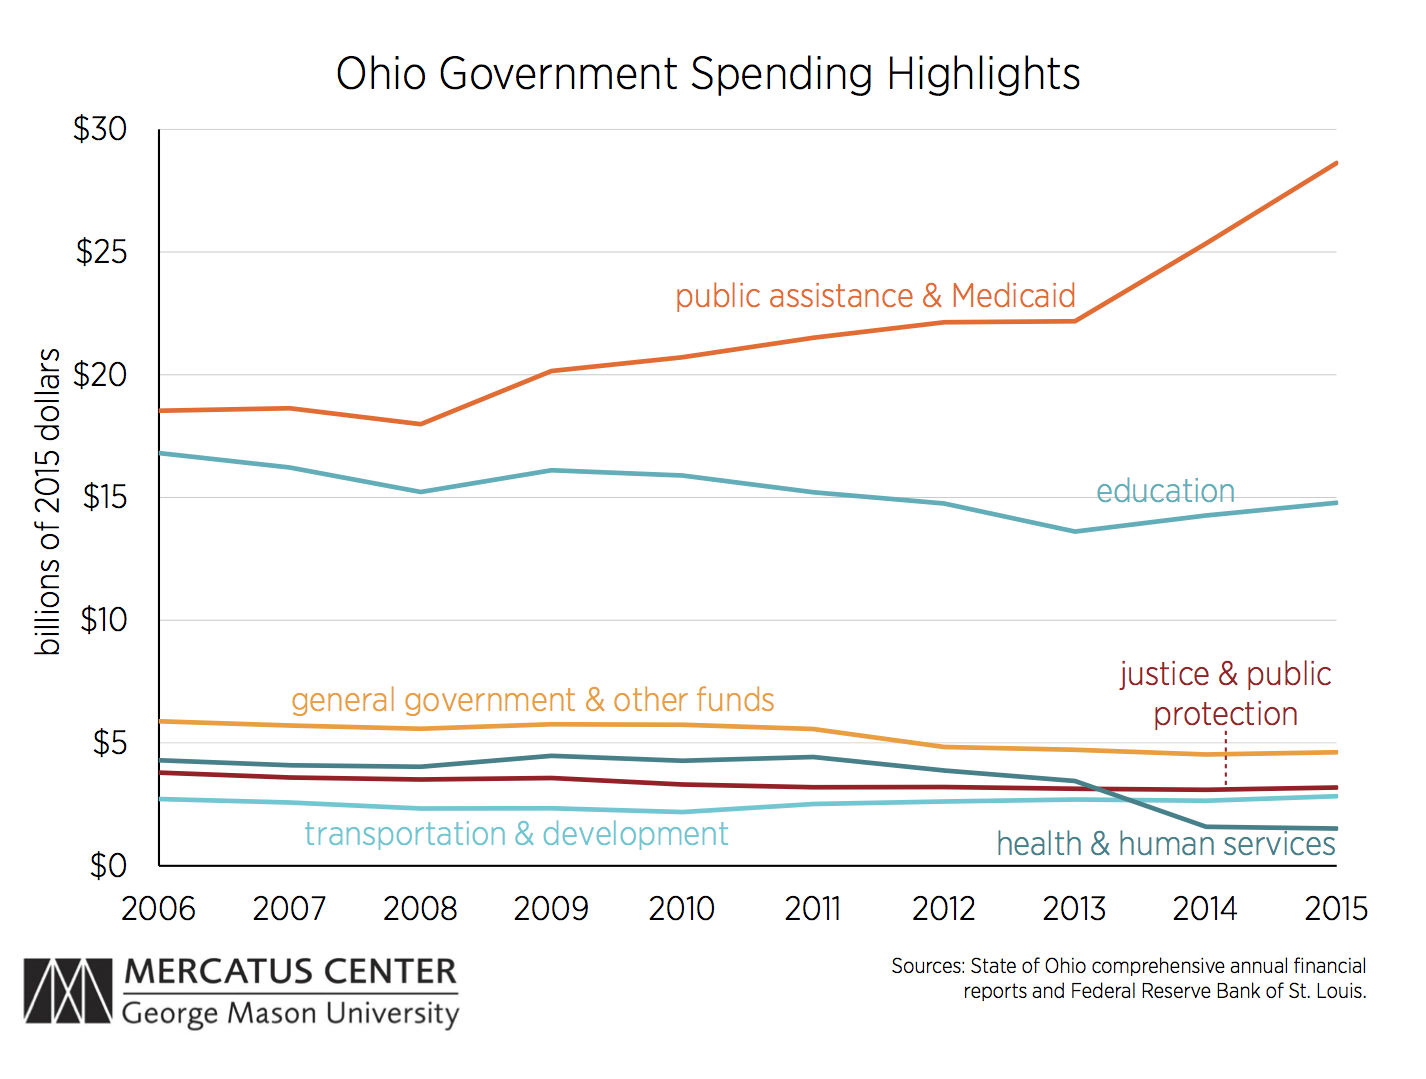
It is important to understand how Ohio spends its tax dollars before discussing any potential spending cuts. The first chart displays Ohio’s state spending by category.
Over the past 10 years, the category that has seen the greatest increase in spending has been “public assistance and Medicaid.” From 2006 to 2016, spending on public assistance and Medicaid steadily increased (except for a slight dip from 2007 to 2008 during the recession), rising from roughly $19 billion to $28 billion. The “education” category has had the second highest level of spending, but education spending started to decline in 2009 after public assistance and Medicaid spending resumed rising in 2008.

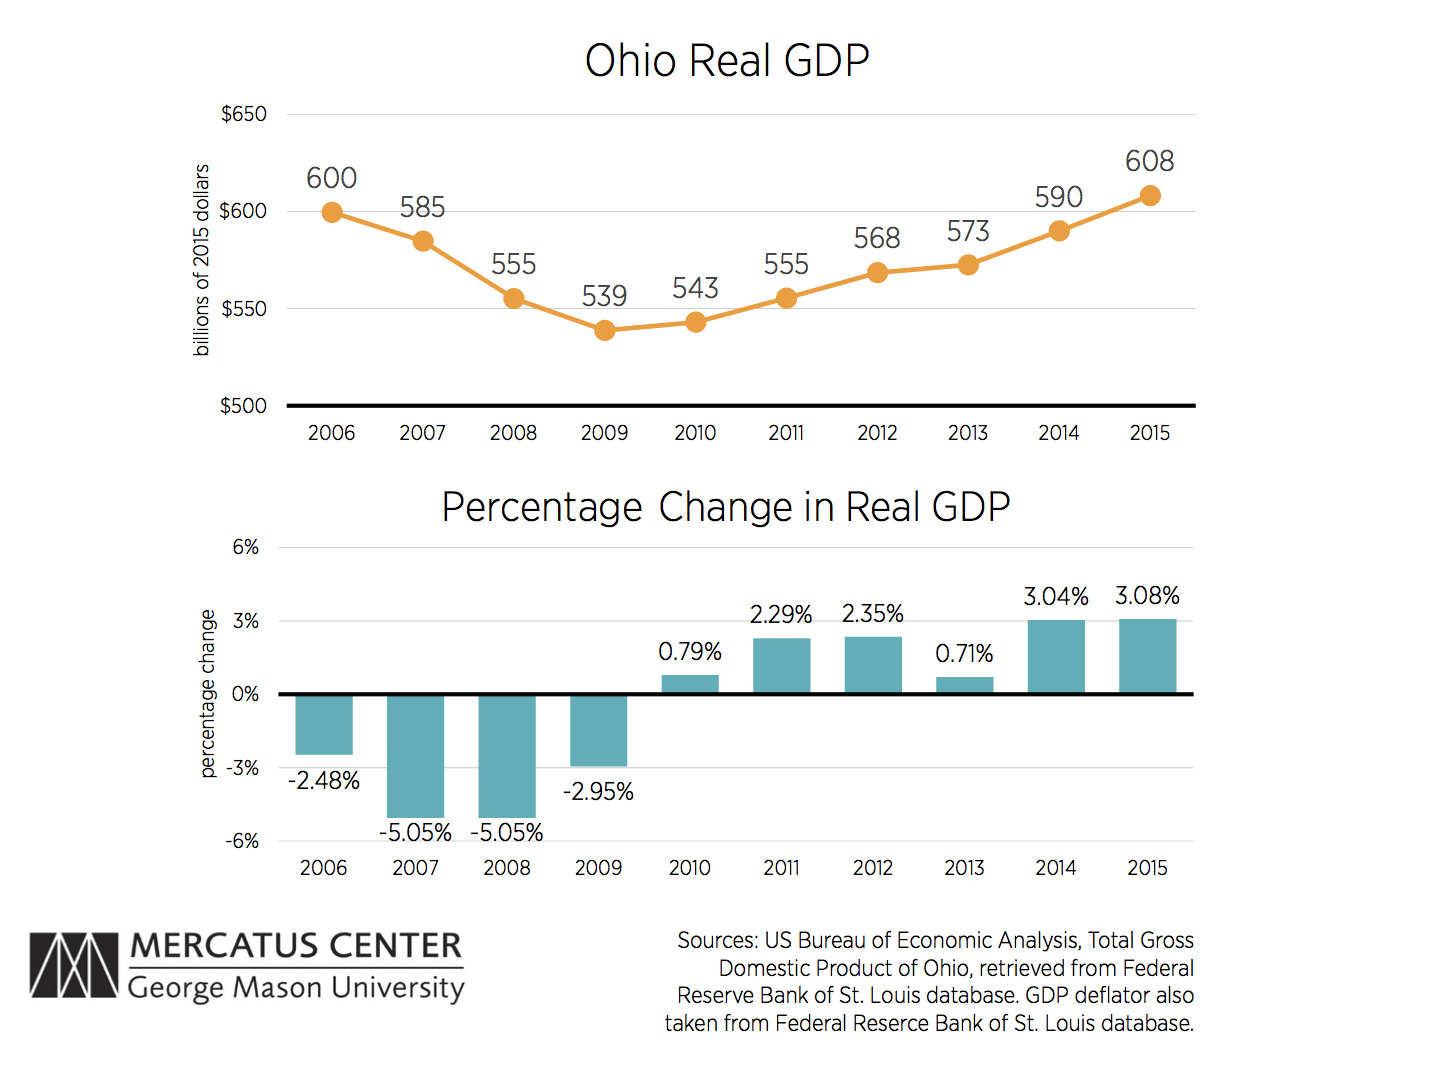
While we do not have a crystal ball, such growth appears unlikely. The third chart shows the change in real GDP and the percentage change in GDP from 2006 to 2015. The contraction from 2006 to 2009 due to the financial crisis and recession is evident, and then from 2009 onward the Ohio economy grew modestly.
The sharpest increases in economic growth usually occur in the years immediately following a crash, but these boom years never materialized after the latest recession. Recent growth has just barely returned Ohio to its 2006 GDP level (roughly $608 billion). The recent modest growth rates suggest that unless something changes it is unlikely that Ohio can grow its way out of its pension problem.
Considering both recent findings published by the Mercatus Center on Ohio public pensions and the analysis above, the state’s financial situation is likely to change in the future. Such change will necessitate spending cuts, tax increases, or both, and these difficult decisions will only become more difficult if action is delayed. Ohio voters, legislators, and the governor will have to decide which tradeoffs to make, and the sooner they act, the less painful the solution will be.
Note: The first chart uses the categories from Ohio’s comprehensive annual financial reports (CAFRs). The “education” category combines the primary and secondary education and higher and other education categories from the CAFRs. The “general government and other funds” category combines the general government, environmental protection and natural resources, and community and economic development categories from the CAFRs.

