- | Government Spending Government Spending
- | Data Visualizations Data Visualizations
- |
Social Security in Cash Flow Deficit
6 Years Ahead
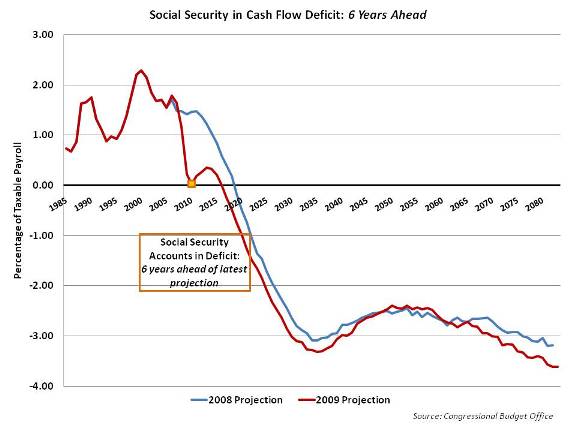
This chart compares the Congressional Budget Office’s (CBO’s) projections for the end of year balance of Social Security accounts from 2008 and 2009.
This chart compares the Congressional Budget Office’s (CBO’s) projections for the end of year balance of Social Security accounts from 2008 and 2009. These balances are presented as a percentage of taxable payroll, a weighted average of taxable wages and taxable self-employment income which provides an estimate of the earnings subject to payroll taxation each year. For perspective, in 2010 taxable payroll is projected to be $5.6 trillion in real terms. Concretely, when the balance of these accounts becomes negative, Social Security is paying out more in benefits than it collects in payroll taxes in a given year. In 2008, the CBO projected that outlays would exceed revenues for the first time 2019 and in 2009 CBO projected that this threshold would be crossed in 2016. In fact, this year Social Security will pay out more in benefits than it collects.
While part of the acceleration in the onset of Social Security deficits is due to the impact of the recession on taxation, by all projections, the unsustainable deficits in Social Security will continue into the future.