- | Government Spending Government Spending
- | Data Visualizations Data Visualizations
- |
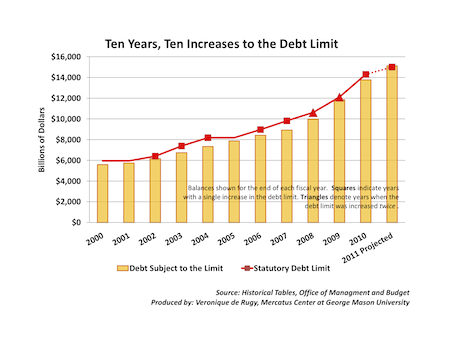
Ten Years, Ten Increases to the Debt Limit
This chart by Veronique de Rugy pairs the changes in the statutory debt limit since 2000 with the corresponding debt subject to this statutory limit.
This chart by Veronique de Rugy pairs the changes in the statutory debt limit since 2000 with the corresponding debt subject to this statutory limit. Years in which the limit was raised a single time are noted by squares; years in which the limit was raised twice are noted by triangles.
In the last decade, Congress raised the debt limit ten times. This data provides evidence that the debt limit, far from providing its intended fiscal discipline, has recently served as a symbolic cap which Congress will push higher and higher as spending increases dictate.