- | Government Spending Government Spending
- | Data Visualizations Data Visualizations
- |
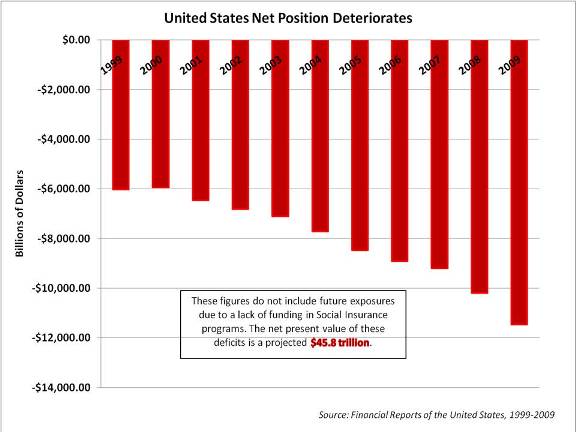
United States' Net Position Deteriorates
This chart compares the year-over-year change in the United States’ end-of-year net position.
This chart compares the year-over-year change in the United States’ end-of-year net position. Net position is calculated by netting the government’s assets against its liabilities, as recorded in the United States Government Balance Sheet. Just as in the financial statement of a company, this metric provides a general picture of the fiscal situation in the United States. In 2009, the net position of the United States was -$11.5 trillion, a 12% deterioration from 2008. Net position has been steadily declining since 2000; while the image depicted above is dramatic, the true situation is far worse - exposures for future Medicare and Social Security expenditures are not taken into account in the calculation of net position.
Veronique de Rugy has a forthcoming article on the fiscal position of the United States in The American.