- | Housing Housing
- | Federal Testimonies Federal Testimonies
- |
Housing Affordability: Trends, Shocks, and State Legislation
Good morning, Chairman Heinrich, Vice Chairman Schweikert, and members of the Joint Economic Committee. Thank you for the opportunity to address you today. My name is Salim Furth, and I am a senior research fellow at the Mercatus Center at George Mason University, where I am codirector of the Urbanity Project.
Today, I want to offer a snapshot of housing affordability trends and distinguish the short-term and long-term explanations for what we see. State legislatures are aggressively tackling the long-term causes of high prices, but much work remains to be done.
A Look at Recent Trends
The 21st century has been a difficult era for renters. While the 1980 to 2000 censuses showed that the median renter household paid 23 to 25 percent of its income in rent, that share rose briskly to a peak in 2011 and has remained high since, as shown in figure 1. In 2022, the median renter household spent 30 percent of its income on rent.
The good news is that we may see a bit of improvement in 2023 and 2024, because an ongoing surge in multifamily supply has caused asking rents to flatline or even fall. [1]

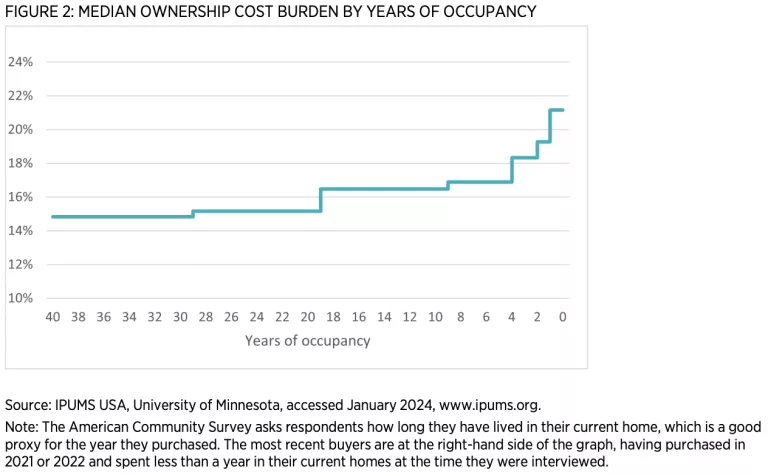
For homebuyers, the situation is more complicated. Typically, a mortgage becomes more affordable over time as one’s income grows. That pattern is clear in figure 2. Even for recent buyers, housing costs have usually been quite reasonable. The 2022 data show that median monthly housing costs—including mortgage, taxes, insurance, and utilities—are just 21 percent of income for the most recent buyers. However, those who bought in late 2022 and 2023 faced much higher interest rates and have not yet been included in published data. I expect the fresh data will show rising ownership costs for the newest cohort of buyers.
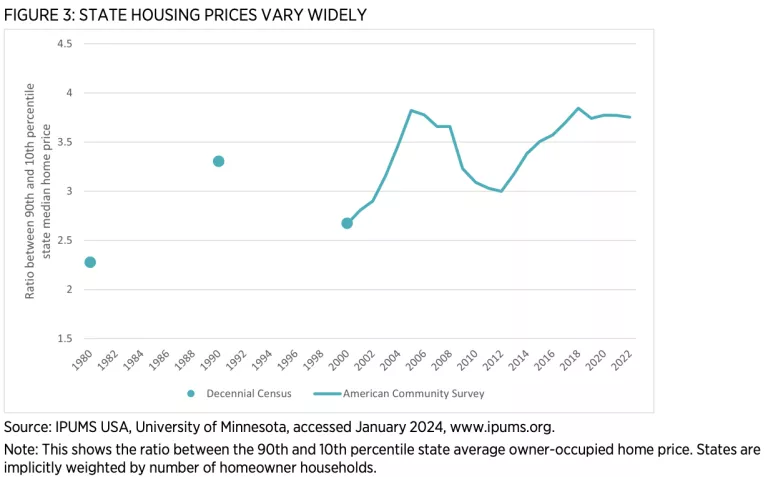
Of course, the national trends conceal large, growing differences across regions. Looking at state average home prices, the price difference between the most and least expensive states has varied quite a bit over time. Figure 3 shows one way to measure this difference. For the last several years, home prices in the most expensive states have been about 3.8 times higher than in the least expensive.
Recent Shocks: The Pandemic, Interest Rates, and Inflation
Pandemic-era preferences and policies contributed to a sharp increase in home prices and rents. The most important and durable preference among Americans is spending more time at home than before. [2] During the pandemic, roommates split up, families carved out home offices, and more parents opted to homeschool. Work, school, and leisure at home are considered attractive options by more people today than in 2019.
Unlike most short-term changes, the sudden increase in demand for residential space appears to be permanent. That creates a double challenge for housing affordability: higher demand increases the price per square foot, while, at the same time, it takes more square footage to meet some households’ rising standards for sufficient housing.
The second recent shock was the sequence of interest rate movements. Mortgage rates fell to all-time lows in 2020 and then zoomed to a multi-decade high in 2022. Low rates allowed home sellers to raise prices. And many homeowners, myself included, refinanced.
But when interest rates shot up, it did not have an equal and opposite effect on home prices. The low rates on pre-2022 mortgages served as golden handcuffs. [3] The number of Americans selling their home and buying a new one was already in decline; now even fewer are willing to sell. [4] The resulting lack of inventory for sale has short-circuited what we might otherwise expect: interest rate increases cutting into prices.
Finally, housing was not exempt from economy-wide inflation, which has amounted to about 16 percent since January 2020.
LONG-TERM TRENDS: REGULATION AND HOUSING SUPPLY
As valuable as it is to understand the recent fluctuations, long-term trends are even more important. To understand why, let’s compare the Los Angeles and Oklahoma City metro areas. Home prices in both cities are about 40 percent higher today than in January 2020. [5] That increase, however, was added to a base price of $683,000 in LA but just $162,000 in OKC. As a result, the four-year increase alone amounts to three median household incomes in Los Angeles but just one in Oklahoma City. [6]
So, what explains the four-fold difference between Los Angeles and Oklahoma City prices? Economists believe the biggest factor is that Oklahoma City has allowed enough housing to be built to meet demand while Los Angeles has not. [7] As a result, material consumption is higher in Oklahoma City than in Los Angeles, even though nominal income is substantially higher in the latter. [8]
Since 1970, if not earlier, the relative scarcity of housing in restrictive, high-wage cities, mostly along the coasts, has deepened every decade. [9] This has hurt not only those who already live there, but the many Americans who would have liked to move to those cities of opportunity. Through most of American history, large numbers of people have migrated from low- to high-wage places. No more.
Now, internal migration from the most-productive cities is negative. [10] Americans instead are moving to cities with attainable, modern housing. [11]
State Legislative Efforts: Zoning Reform
Now the good news: State legislatures have taken seriously the role of local regulation in constraining housing supply and have begun the long road of reform. California’s efforts have received the most press, but some other states have gone further.
In both Vermont and Montana, the governor and a handful of key legislators have made zoning reform a top priority. [12] Local newspapers, research, and advocacy organizations led an inclusive, public conversation about the reach of zoning. The legislative leaders convened stakeholder groups—formally in Montana, informally in Vermont—and hashed out consensus reforms intended to make it significantly easier to build housing in both states. For example, both states now allow duplexes everywhere in most towns, and both created new exemptions from state environmental review.
In both states, these ambitious, extensive limitations of local regulatory authority received supermajority support from legislators in both parties. And in both states, lawmakers are not done: they have promised to continue reforms in their upcoming sessions.
Important strides have been made in many other states, including Oregon, Rhode Island, Utah, Washington, and Wisconsin.
In several other states including Arizona and Colorado, reform efforts fell just short in 2023, primarily because legislators—again, in both parties—were hesitant to limit city power. Unlike many issues in American politics, this one cuts across ideological lines: legislators from both sides recognize the need for more housing, and legislators from both sides would prefer not to preempt local governments.
For the past 50 years, the pendulum has swung too far toward local authority to restrict housing construction across much of the country, and we have seen the results of these policies. State legislators are now moving back toward balance, restoring the individual freedom to build, and—we hope—durably increasing the supply of housing.
Notes
- Lily Katz, “The Tide Turns for Renters As Asking Rents Post Biggest Decline in Over Three Years,” Redfin, December 13, 2023, https://www.redfin.com/news/redfin-rental-report-november-2023/.
- William Gamber, James Graham, and Anirudh Yadavd, “Stuck at Home: Housing Demand during the COVID-19 Pandemic,” Journal of Housing Economics 59 (March 2023): 101908.
- Julia Fonseca and Lu Liu, “Mortgage Lock-In, Mobility, and Labor Reallocation,” Jacobs Levy Equity Management Center for Quantitative Financial Research Paper (Nov 2023).
- Census data are only available through 2022; some private data indicate that moving fell further in 2023. United States Census Bureau, “CPS Historical Geographic Mobility/Migration Graphs” (dataset), August 10, 2023, https://www.census.gov/library/visualizations/time-series/demo/historic… and North American Moving Services, “Where did Americans Move in 2023?” (dataset), accessed January 10, 2024, https://www.northamerican.com/migration-map.
- Zillow, ZHVI Single-Family Homes Time Series, January 2020–November 2023. (database), accessed January 10, 2024, https://www.zillow.com/research/data/.
- The 2022 median household incomes were $87,743 in Los Angeles and $66,301 in Oklahoma City. Data are from the American Community Survey on the US Census Bureau’s Census Reporter database, https://censusreporter.org/profiles/31000US36420-oklahoma-city-ok-metro…;
- Salim Furth, “Housing Supply in the 2010s” (Mercatus Working Paper, Mercatus Center at George Mason University, Arlington, VA, February 2019); Raven Molloy, “The Effect of Housing Supply Regulation on Housing Affordability: A Review,” Regional Science and Urban Economics 80, issue C (2020); Greg Morrow, “The Homeowner Revolution: Democracy, Land Use and the Los Angeles Slow-Growth Movement, 1965–1992,” (PhD diss., University of California, Los Angeles, 2013).
- Rebecca Diamond and Enrico Moretti, “Where Is Standard of Living the Highest? Local Prices and the Geography of Consumption” (NBER Working Paper No. 29533, National Bureau of Economic Research, Cambridge, MA, December 2021).
- Bernard J. Frieden, The Environmental Protection Hustle (Cambridge, MA: MIT Press: 1981).
- Wendell Cox, “Metro Costs of Living and Domestic Migration: 2010-2020,” New Geography (Feb 2022).
- Peter Ganong and Daniel Shoag, “Why Has Regional Income Convergence in the U.S. Declined?” Journal of Urban Economics 102, (November 2017): 76–90; Sam Khater and Kristine Yao, “In Pursuit of Affordable Housing: The Migration of Homebuyers within the U.S.—Before and After the Pandemic” (Freddie Mac Research Note, June 22, 2022).
- This section follows Eli Kahn and Salim Furth, “Breaking Ground: An Examination of Effective State Housing Reforms in 2023” (Mercatus Policy Brief, Mercatus Center at George Mason University, Arlington, VA, August 2023).

