- | Government Spending Government Spending
- | Federal Testimonies Federal Testimonies
- |
Improving CBO Projections
The Congressional Budget Office (CBO) plays a key role in helping make fiscal policy decisions better. Its analyses are particularly strong in microeconomics and demographics. This comment focuses exclusively on the CBO’s longer-term projections.
Whether by choice or by remit, CBO projections maintain the assumption that current law remains in effect over the projection horizon. This assumption is problematic for two reasons. First, it relegates projections to being accounting exercises rather than economic outcomes. Second, it provides decision makers with no information about how alternative policy choices would affect the likely trajectories of macroeconomic and fiscal variables.
Accounting vs. Economics
I call the projections “accounting exercises” to be descriptive, not to be derogatory. CBO first arrives at paths for a wide range of economic variables over the projection horizon. Each of these variables is an input to projected paths for federal outlays, receipts, and debt. Given projected outlays and receipts, an adding-up constraint—the federal government’s budget identity—yields the new value of debt-GDP required by current fiscal deficits, the stock of inherited debt, and interest payments on that debt. By construction, there is no feedback from fiscal outcomes to economic variables.
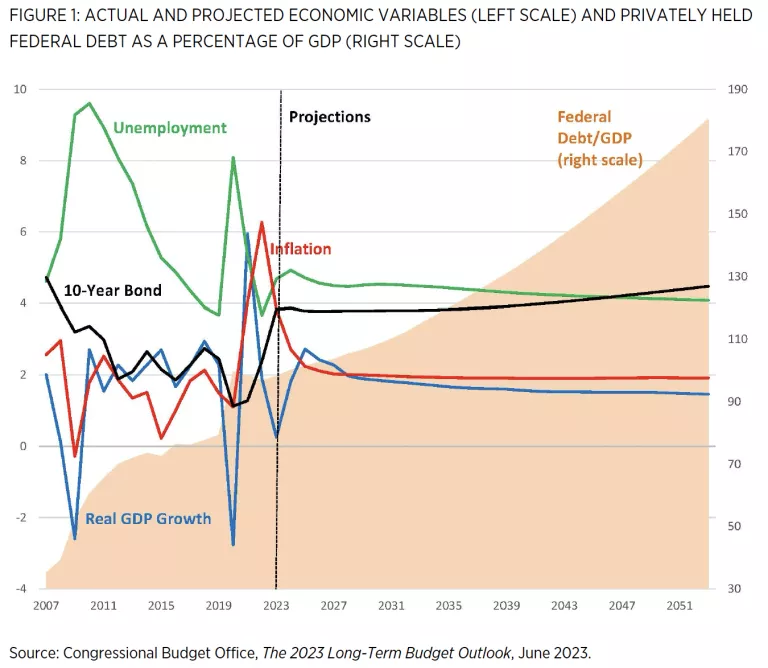
One result from this exercise appears in figure 1. From 2007 to 2023, the figure plots actual data for real GDP growth (blue line), inflation (red line), the unemployment rate (green line), the 10-year government bond yield (black line), and, on the right scale, privately held federal debt as a share of GDP (orange shaded area). From 2023 to 2053—to the right of the vertical dashed line—are projections of those variables. Notice that over the projection period, government debt climbs to 180 percent of GDP, a level never experienced in US history, while macroeconomic variables settle in at comfortable levels: output grows at 1.5 percent, unemployment is 4.1 percent, inflation is below 2 percent, and the 10-year bond rate is 4.5 percent.
What do we make of these projections? Two interpretations come to mind, with sharply different policy messages. The first interpretation, which may be the message the CBO intends to send, is that even if over the next 30 years the economy functions smoothly with no crises that raise fiscal needs, government debt as a share of the economy grows ever higher. [1] The message to policymakers is an emphatic: “Do something!”
A second interpretation, far more sanguine, is that even though debt is growing exponentially to unprecedented levels, nothing bad happens to the economy. The things people care about—income growth, employment, inflation, and interest rates—signal a healthy economy. Now the message is benign: “You don’t need to do anything. The path of government debt is irrelevant to the economic outcomes on which social well-being depends.”
That the CBO’s projections can lead to two polar-opposite messages to policy makers is a serious problem. The source of the problem lies in CBO’s methodology. Accounting exercises answer the question, “If we make this set of assumptions and government debt has to satisfy an adding-up constraint, what do those assumptions imply about the path of government debt?” The trouble with relying entirely on accounting is that there’s no check on whether the outcomes that the accounting exercise delivers could actually occur in the economy. That check comes from addressing an economic question instead of a purely accounting question. The economic question would be, “What set of policies for outlays and receipts would yield a stable debt-GDP ratio?” An alternative question might be, “What fiscal policies stabilize debt and maximize social welfare?”
Economic analysis imposes discipline on the accounting exercise by making explicit the private sector’swillingness to hold government debt and the terms on which it’s willing to hold that debt. Those terms have important implications for interest rates, inflation, and real economic activity. Clearly, social welfare depends on economic behavior.
Informing Policy Choice
A second shortcoming of pure accounting exercises is that they cannot inform policy choices. To inform choices, decision makers need to understand the feedback from their choices of outlays and receipts, along with the implied levels of debt, to private-sector behavior. The interaction of private and government behavior determines the impacts of policy choices on the economic outcomes policymakers hope to achieve.
A simple example fixes ideas. Suppose Congress seeks to stabilize debt at 50 percent of GDP. CBO could produce a menu of spending and revenue combinations that take debt to 50 percent over a range of time horizons. For each spending-tax-time horizon mix, an economic analysis would generate the paths of macroeconomic variables that a model generates. The menu of policy options and projected outcomes can serve as a basis for policy debates by making clear the tradeoffs that each option entails. [2]
Debt-GDP is simply an example of a criterion that grounds the policy mixes. Congress could give CBO other criteria that correspond more closely to fiscal objectives. The point is that an economic analysis requires some criteria that underlie the selection of options in the menu.
CBO’s maintained assumption that current law remains unchanged over the 30-year projection horizon forces the projections to embed policy behavior that may be—and frequently is—inconsistent with economic equilibrium. This is the source of the nonsensical economics. At the end of the projected horizon in the June 2023 report, net interest is almost 7 percent of GDP. This is twice the level of interest payments in the late 1980s/early 1990s, when Congress last undertook substantial fiscal consolidation. Historically, when the cost of financing debt gets high enough, Congress realizes it can no longer provide the policies that constituents most value, and Congress reforms policy. CBO projections enforce policy behavior at odds with historical policy behavior to render the projections of limited value to decision makers.
Notes
CBO used to extend projections to 75 years but now truncates them at 30 years. Their 2013 projections of debt-GDP reached 245 percent in 2088, but the 2013 projection had debt-GDP in 2053 at 140 percent rather than the 180 percent in figure 1. If we were to extrapolate current projections to the year 2098 the debt-GDP would be substantially higher than 245 percent.
Central banks around the world routinely perform this kind of exercise for monetary policy. The best analyses account for uncertainty about projections by generating probability bands around projected variables.

