- | Government Spending Government Spending
- | Federal Testimonies Federal Testimonies
- |
Spending Growth, Not Tax Policy, Is the Main Driver of Federal Debt
US Senate Committee on the Budget | The Rich Get Richer, Deficits Get Bigger: How Tax Cuts for the Wealthy and Corporations Drive the National Debt
Chairman Whitehouse, Ranking Member Grassley, and members of the US Senate Committee on the Budget, I thank you for the opportunity to enter this information into the record for the hearing held on May 17, 2023 exploring the relationship between spending, tax policy, and federal debt.
My statement is based on research I first performed in 2013, and updated later in 2021, on the leading causes of federal deficits and debt. Before I detail the findings, please allow me to make two important technical points. One is that the latest version of my study was published in November 2021, and there have been multiple updates to federal budget projections since then, reflecting factors including subsequent legislation, executive actions, policy expirations, and updated economic data. While my study’s findings should remain qualitatively applicable with respect to the long-term outlook, short-term projections can and do change. In particular, the leading contributors to the annual deficit in 2023 are substantially different from those in 2021 when my study was published, which was a year when pandemic-related spending was still at its height.
The second point of clarification is that in this arena, the precise answer depends on the specific question asked. My research focused on answering two questions: First, what are the largest contributors to the long-term fiscal gap, and second, what were the largest contributors to the annual deficit in the year of the study? The second question helps to shed light on the first in that the biggest contributors to the annual deficit in a particular year might be (and often are) very different from the biggest contributors to the long term imbalance. Specifically, the biggest contributors to the deficit in a particular year are more likely to include legislation enacted closer in time to that year, whereas the biggest contributors to the long-term problem more frequently include legislation enacted many years or even decades before. It’s important to note that neither of the questions addressed by my study were the same as a question asking which policies contributed most to the debt accrued between a particular past date and a more recent date. My study was more forward-looking in that it asked what the biggest contributors to the fiscal imbalance were during the year the study was conducted as well as over the long term.
CAUSES OF THE LONG-TERM FISCAL GAP
For the past decade and a half, federal debt has accumulated at accelerating rates, an untenable situation that is projected to continue and worsen into the indefinite future. However, public understanding of the root causes of growing debt is insufficient, in large part because ongoing political competition gives advocates incentives to cast the finger of blame at political opponents or disfavored policy choices rather than to illuminate the largest contributors to the problem. This is the information gap my study sought to fill. The purpose was diagnostic rather than prescriptive; namely, to quantify the relative contributions of various legislative actions to the growth of federal deficits and debt without regard to the popularity or desirability of those policies.
It is straightforward to observe that any time federal spending is increased, or any time federal tax collections are lowered, then all other things being equal, federal borrowing must increase. There have been countless instances of both types of actions. However, the myriad contributions to deficits and debt have widely divergent magnitudes.
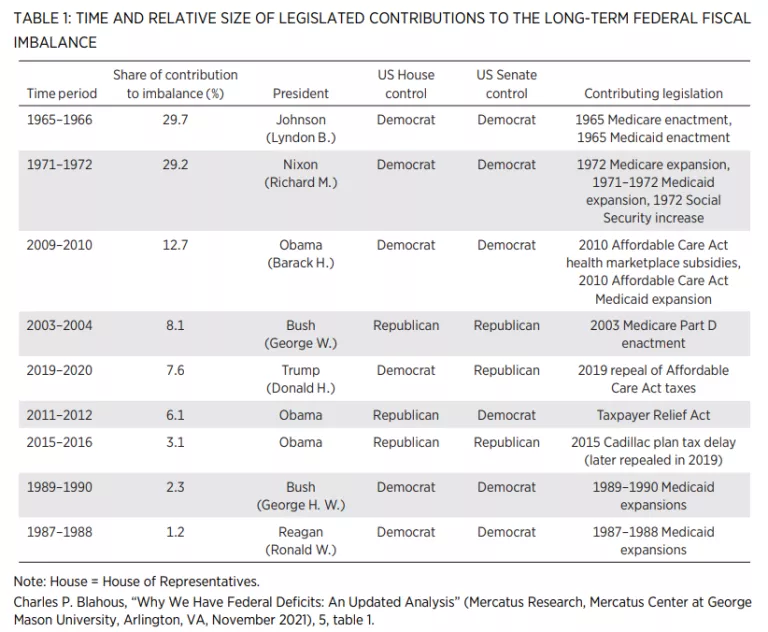
Nearly three-fifths of the federal government’s long-term fiscal imbalance (as projected in November 2021, when the study was most recently updated), or 59 percent, was enacted during a particularly eventful period of federal legislation during the brief time span of 1965 to 1972. During this period, both Medicare and Medicaid were enacted (in 1965) and later expanded (Medicare in 1972, Medicaid in 1971 and 1972). Social Security was also dramatically expanded in 1972 and subjected to new automatic growth mechanisms. These programs’ mandatory spending growth, which occurs automatically under law without an intervening vote by lawmakers, significantly exceeds the rate of growth of US economic output and is the primary driver of the federal fiscal imbalance.4 Federal lawmakers have yet to determine how to moderate these programs’ cost growth rates to sustainable levels. One result is that Social Security and Medicare Hospital Insurance are currently projected to become insolvent while Medicaid, as well as the portions of Medicare that cannot under law become insolvent, are also growing faster than is sustainable, even if the future growth of federal revenue collections matches or somewhat exceeds the growth of US economic output.5 Legislation enacted from 1965 through 1972 actually did more to create the current federal fiscal imbalance than all subsequent legislative actions combined. See table 1.
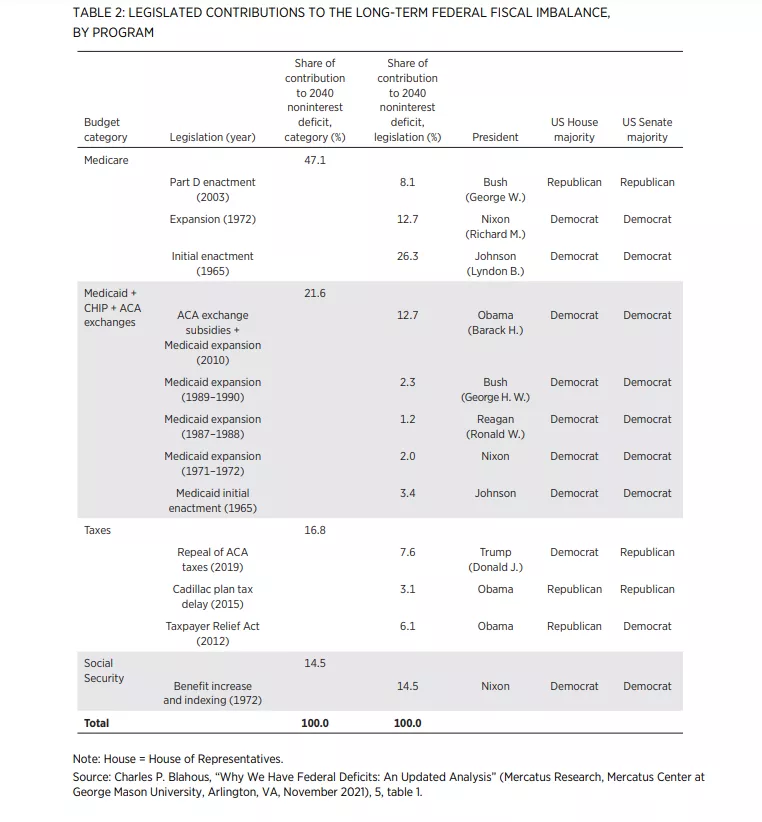
It may be of interest that each of the programs contributing the most to the long-term fiscal balance took a different route to assuming its outsized role. Social Security has contributed to federal deficits since 2010 when the program began running annual operating cash deficits projected to continue to grow into the future. However, Social Security’s excess growth is not a result of its original design under President Franklin D. Roosevelt. If Social Security still had the same basic benefit design as it had in its first several decades, it would be in financial balance today. Social Security’s excess growth arises instead from automatic indexing mechanisms enacted in the 1970s. Medicare, by contrast, contributes to the fiscal shortfall primarily because of its design as enacted in 1965. Although there have been some expansions of Medicare since its initial enactment, most notably in 1972 and 2003, lawmakers have more frequently acted to contain Medicare’s growing costs than they have acted to expand it. Medicaid has taken yet another path. A smaller share of Medicaid’s contribution to the shortfall arises from its original 1965 design; a greater share arises from repeated program expansions in 1971, 1972, 1987, 1988, 1989, 1990, and most recently in the 2010 Affordable Care Act (ACA). See table 2.
CAUSES OF ANNUAL DEFICITS
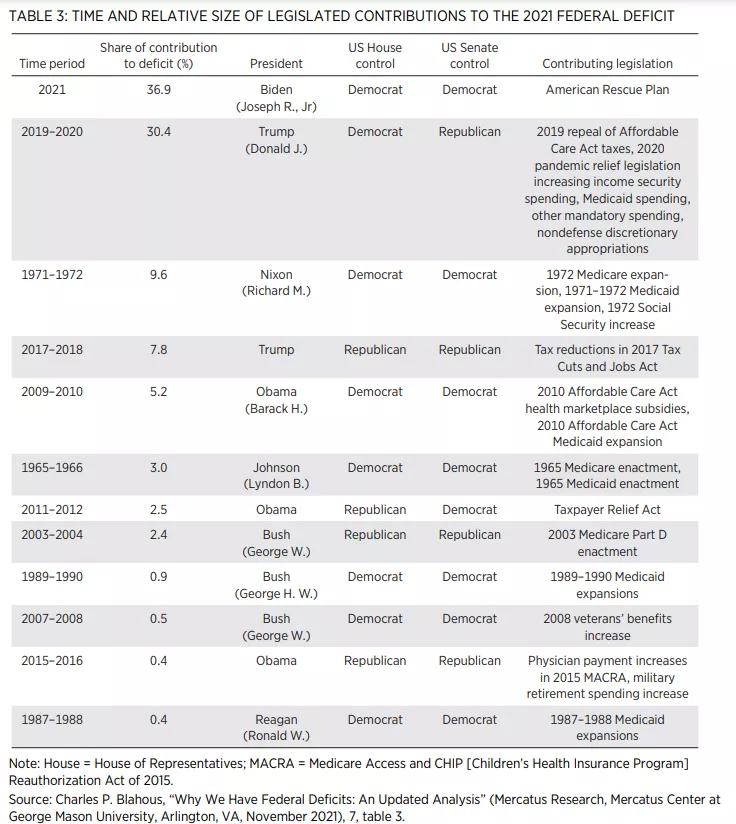
Whereas the federal government’s long-term shortfall arises primarily from legislation enacted several decades ago, contributors to the annual deficit in a specific year can (and do) vary dramatically with the short-term effects of legislation. A case in point is provided by the deficit in 2021, when the study was most recently updated. The exceptionally large deficit in 2021 was precipitated mostly by spending enacted during the COVID-19 pandemic, divided nearly equally between actions taken during the Trump and Biden administrations (see table 3). Most of the pandemic-related income security spending and other pandemic-related spending depicted in table 3 has since concluded. In addition, federal tax revenues are being collected in 2023 at a higher percentage of GDP than had been projected in 2021, at the time of the study. Accordingly, a repeat of this analysis for the 2023 annual deficit would produce very different results, more closely resembling the contributors to the long-term fiscal imbalance shown in tables 1 and 2.
BACKGROUND DATA
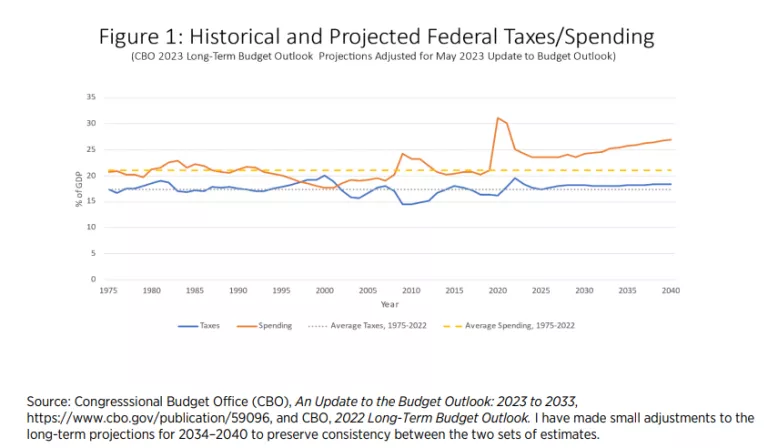
From 1975 through 2022, federal spending averaged 21.1 percent of GDP, while revenue collections averaged 17.4 percent. The average deficit has been 3.7 percent of GDP, but deficits have grown especially in the most recent decade and a half. Sometimes there have been sudden spikes upward in deficit spending, such as in 2009 in response to the financial markets crisis, and in 2020–2021 in response to the COVID-19 pandemic. Federal spending rocketed from 21.0 percent of GDP in 2019 to 31.1 percent in 2020, the first year of the pandemic, and has not returned to historical or sustainable levels. The current spending level of 24.2 percent of GDP in 2023 is substantially elevated relative to historical norms and is projected to increase further in the years ahead, reaching nearly 27 percent of GDP by 2040. As a result, budget deficits remain historically high even though current and projected federal revenue collections exceed historical averages as a percentage of GDP. Tax revenues in 2023 are currently estimated at 18.4 percent of GDP, higher than the historical average. These trends can be seen in figure 1.
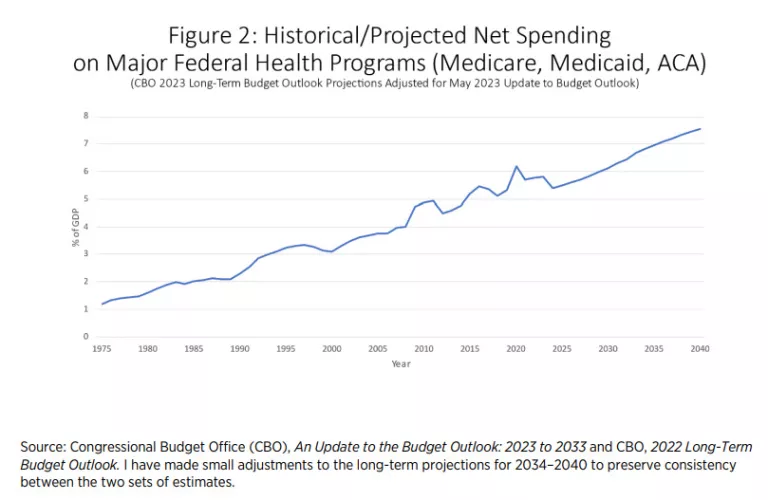
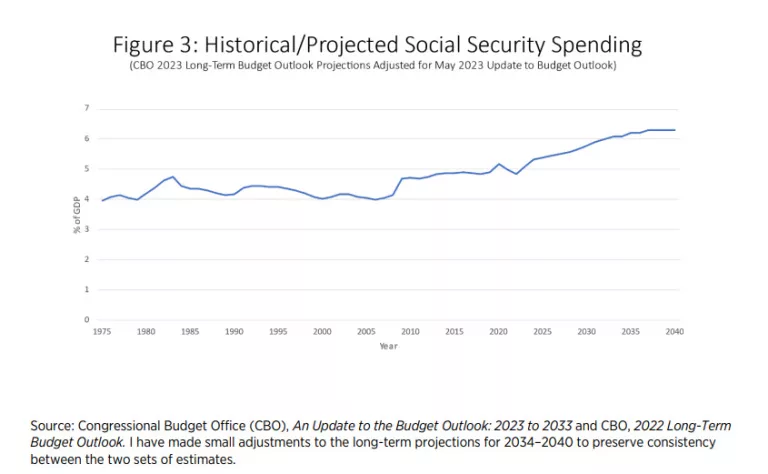
The growth of federal spending relative to GDP is not spread evenly throughout the budget. The growth has occurred despite persistent decreased spending in several budget categories relative to GDP. Among these spending categories is annually appropriated discretionary spending. The entirety of the overall federal spending increase relative to GDP over the long term can be accounted for by the growth in the major federal health programs (Medicare, Medicaid, and the ACA) and Social Security. See figures 2 and 3.
THE ROLE OF TAX POLICIES
As these data show, relatively little of the federal government’s fiscal imbalance is rooted in tax legislation. The vast majority of it is attributable to spending policies, most especially the dramatic increases of federal mandatory spending obligations enacted from 1965 through 1972. This is readily apparent not only from the data shown in figures 1, 2, and 3 but also in recurring CBO reports that present the same information. Although a study like mine may be useful for quantifying the breakdown and identifying the specific legislation that created the situation, it is not necessary to consult such a study to understand that the preponderance of the federal government’s fiscal imbalance is attributable to rising spending. This raises the question as to why so much of our national dialogue is devoted to discussing other policy choices, such as changes to tax law, that matter far less.
The dynamics of the national conversation are to a certain extent understandable. It is natural for political parties as well as their respective advocates to emphasize their areas of policy disagreement, and tax policy has certainly been among the areas where America’s two major parties are frequently in conflict. It is also natural to want to downplay policy challenges that neither party sees political advantage in addressing; namely, the rising expenditures of popular mandatory spending programs. Nevertheless, it may be worthwhile to understand some of the specific reasons why many authors assert that tax policy plays a larger role in the fiscal imbalance than it actually does.
One particularly important factor driving different conclusions is whether one examines the entirety of the budget or only a subset of policy decisions. To examine only policy changes made after a particular date can mean excluding from analysis the majority of policy actions that fostered the fiscal imbalance. Such a selective examination distorts findings by amplifying the effects of any policies enacted after that date, while omitting the effects of policies enacted earlier, even if those earlier policies are far larger in their effects. For example, roughly 62 percent of the long-term fiscal shortfall is attributable to legislation enacted before 2000. If one only examines policies enacted after 2000, the share of the problem attributable to tax cuts rises from its actual 17 percent to an apparent 45 percent. In the real world, lawmakers must deal with all drivers of mounting debt, not just those on one side of the budget, or those enacted only within a particular time window. Corrections can only be lastingly effective if they address sources of the fiscal imbalance regardless of when they were enacted.
Another mistake common in this area of analysis is to confuse simultaneity with cause and effect. In January 2001, the CBO projected budget surpluses throughout its projection window; there were subsequent tax cuts, and those surpluses did not materialize. This combination of events causes many to misbelieve that we would have surpluses today were it not for those tax cuts. This belief is incorrect. Federal spending has risen greatly in the years since then, not primarily because of subsequent legislation but because policies enacted earlier, such as the expansion of Social Security in 1972 as well as the enactment of Medicare in 1965 and its expansion in 1972, only began to have their costs fully realized when the large baby boom generation became beneficiaries. In 2012, the CBO published a post-mortem report on the disappearance of the surpluses that had been projected in January 2001. That analysis shows that 49 percent of the subsequent fiscal deterioration was a result of subsequently enacted spending increases, 27 percent was a result of previous projection error, and only 24 percent was the result of tax relief.
A third point of confusion lies in the fact that federal tax law is frequently revised. This typically prevents any tax change enacted in a particular year from having large effects in the distant future. For example, large tax cuts were enacted during the presidencies of Harry Truman, Lyndon Johnson, and Ronald Reagan, but these provisions have either expired or been overwritten so many times subsequently that none of them have a significant effect on America’s current fiscal imbalance.7 The extent to which projected federal tax collections currently fall short of levels required to maintain balanced budgets (assuming historical spending norms) is attributable entirely to tax laws enacted during the Trump and Obama presidencies.8 Put another way, regardless of the size of tax cuts previously enacted during presidencies ranging from Truman to Bush 43, federal revenues would still be more than sufficient today to finance normalized spending, were it not for more recent changes to tax law in 2013, 2015, 2017, and 2019. Earlier tax changes have little to do with the current predicament.
There are also sources of confusion specific to particular tax laws, often rooted in how the laws are debated at the time of their enactment. For example, during the Trump presidency, the tax cut that had the biggest adverse effect on the long-term fiscal imbalance was not the oft-discussed 2017 Tax Cuts and Jobs Act (TCJA) but the 2019 repeal of the so-called Cadillac plan tax and other taxes initially enacted to fund new spending under the 2010 ACA. Despite CBO scoring to this effect, one is more likely to encounter concerns expressed about the 2017 TCJA’s effect on deficits than about the 2019 law. The 2017 TCJA did contribute to the 2021 deficit, as table 3 shows, but the CBO found that over the long term it would “reduce the primary deficit,” in large part because of its provisions to “change . . . the inflation indexing of tax parameters.” Similarly, the 21st century tax law that the CBO found to have the largest adverse impact on the long-term budget outlook, the 2013 Taxpayer Relief Act, is rarely described as such in political debates, perhaps in part because its bipartisan pedigree renders it an unattractive political target.
Another important source of confusion may reside in the fact that both the federal spending and revenue baselines rise as a percentage of GDP over time under current law, with spending rising faster. On the one hand this means that the fiscal problem is driven by spending growth, but on the other hand it amplifies the apparent damage done by tax cuts. If spending automatically rises from 21 percent to 27 percent of GDP over time, while a tax cut causes federal revenues to rise only from 18 percent to 19 percent of GDP rather than to a previously scheduled 20 percent, congressional scoring practices can make it appear as though the tax cut did greater damage when the far larger problem is actually the spending increase baked into the baseline. This phenomenon is very important for policy makers to understand because it means that under current law, raising taxes can only buy time at best rather than restore fiscal stability. Ultimately, spending growth must be moderated so as not to exceed the rates of growth of the underlying economy and of the tax base.
CONCLUSION
While tax cuts can and do increase federal deficits and debt, the federal fiscal imbalance is mostly a consequence of mandatory spending growth rates exceeding the growth of US economic output, which in turn occurs primarily because of legislation enacted from 1965 through 1972. While a vigorous debate over how to optimize federal tax policy can be appropriate and useful, it has little to do with why federal finances are so badly out of balance.
There is both good news and bad news in this finding. The good news is that the current imbalance isn’t primarily the product of anything done by currently serving lawmakers, and thus no sitting lawmaker need reverse themselves on previous legislation they voted to enact. The bad news, however, is that the fiscal problem cannot be solved without lifting one’s sights from current policy debates to more difficult issues that current lawmakers have thus far chosen to largely steer clear of.
I hope that this information is of use to lawmakers in meeting these responsibilities, and thank you again for the opportunity to submit it.
Citations and endnotes are not included in the web version of this product. For complete citations and endnotes, please refer to the downloadable PDF at the top of the webpage.

