- | Government Spending Government Spending
- | Federal Testimonies Federal Testimonies
- |
Stimulus Facts
Testimony Before the House Committee on Transportation and Infrastructure
In a testimony before the House Committee on Transportation and Infrastructure Mercatus Center's Senior Research Fellow, Veronique de Rugy presented a report on the disbursement of funds authorized
Good morning Chairman Oberstar, Ranking Member Mica and distinguished Members of the Committee. I am pleased to be here today to report on my analysis of the disbursement of funds authorized through the American Recovery and Reinvestment Act of 2009. Using recipient report data from Recovery.gov and economic and political data from the Bureau of Labor Statistics, the Census Bureau, GovTrack.us, and others, we have compiled a series of facts about stimulus spending. Our interest is simply to make use of the tens of thousands of stimulus recipient reports recently published on Recovery.gov, and to put the aggregate information contained in those reports in a larger context. We hope that this report will become part of a regular series as new recipient reports are released each quarter.
The information presented here encompass the data from calendar year 2009 Q4 (FY 2010 Q1) reports of Recovery Act contracts and grants only. More information about our methodology is provided at the end of this document. Additionally, the complete dataset used for this report is available for download at www.Mercatus.org.
Basic Facts
A total of 65,084 contracts and grants totaling $170 billion were awarded in this second quarter for which Recovery.gov reports are available. That’s only an additional $13.6 billion reported received this quarter over the previous one, roughly $1 billion awarded each week.
The number of jobs claimed as created or saved during this period is 597,153 for the entire $170 billion expenditure—an average of $285,814.61 per job. The total number of jobs claimed shrunk from 693,000. It is important to understand this point. The total number of jobs claimed to have been created by the entire stimulus fell overall, not just in the last quarter. This apparent job destruction may have to do with the changes the White House made on how to count jobs.
The total amount awarded to public entities (such as municipalities and state agencies) is $93 billion. However, it is still the case that some of this money may have ultimately found its way to private subgrantees or subcontractors. The total amount awarded to private contractors and grantees is $78 billion. While public entities received 42% of the number of all awards, these awards constituted over half of the dollars awarded (55%). In other words, public entities are receiving fewer contracts than private (27,230 vs. 37,854), but there is a higher average dollar value on the public awards ($3,417,412 vs. $2,050,484).
Party Affiliation
For our analysis, we looked at the 435 congressional districts in the United States plus the District of Columbia, but excluded Puerto Rico and foreign stimulus recipients such as Canada and the US Virgin Islands. The average number of awards per district is 148, and the average dollar amount awarded per district is $385,932,979.
In the United States there are 177 districts represented by a Republican and 259 represented by a Democrat. On average, Democratic districts received 1.53 times the amount of awards that Republicans were granted. The average number of awards per Republican district is 112, while the average number of awards per Democratic district is 171.
Democratic districts also received 2.65 times the amount of stimulus dollars that Republican districts received $122 billion vs. $46 billion). Republican districts also received smaller awards on average. The average dollars awarded per Republican district is $26 million, while the average dollars awarded per Democratic district is about $472 million. In total, Democratic districts received 73% of the total stimulus funds awarded and Republican districts received 27% of the total amount awarded.
Other Political Variables
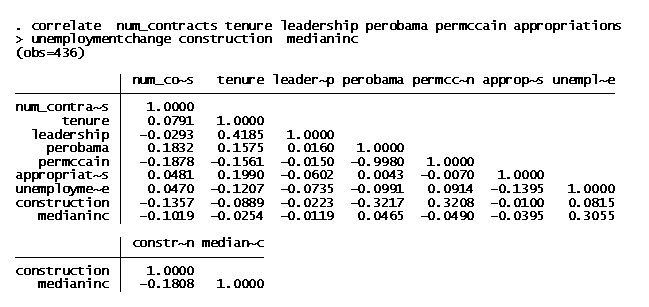
We checked for correlation (see tables 1, 2) and computed the predictive power of political and economic indicators on stimulus fund allocation (see table 4).
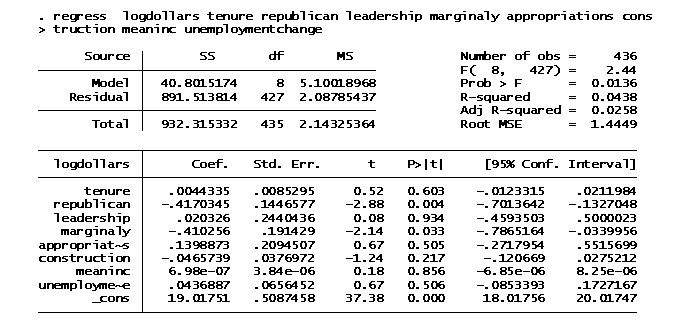
A regression analysis (ordinary least squares) was used to determine whether either political factors (Republican or Democrat) or economic indicators (e.g. unemployment in a district) could predict the amount of stimulus funds distribute to a district. To estimate the influence of those two variable, we included the district representative’s political party, tenure in office, leadership position, membership on the appropriations committee, as well as for the change in district’s unemployment from 2007 to 2008 (the last year with available unemployment data per district), mean income (i.e., the average income of a given wage earner in the district), and the percentage of employed persons working in the construction sector in 2008, finds that a district’s representation by a Republican decreases the stimulus funds awarded to it by 41.7%. This result underscores the findings from the previous Stimulus Facts report.
This effect is statistically significant at the p < .004 level. (See regression table at end of document.) The regression analysis does not seek to explain (nor does it explain) precisely how funds were allocated (our R-squared = .05). That would require a more complete dataset than has been used for these results. That is, we wanted to know how much political and economic factors could explain the distribution of funds. That is different from saying we want to know all of the factors that control distribution of the funds. We do not have that data nor is it particularly interesting for our purposes. We have confidence we know how much influence these two variables have, although we do not know how other factors influence the decisions. In our political calculation,
We find that there is a slight effect on the amount of stimulus funds allocated based on whether a district voted for John McCain or Barack Obama in the 2008 presidential election.
Concretely, while $109 billion has been allocated to congressional districts that voted for President Obama (or 65% of the total amount allocated), $59 billion (or 35%) have been allocated to congressional districts that voted for McCain. It should be noted, however, that there were many more congressional districts that voted for Obama than voted for McCain. President Obama won 55.6% of congressional districts and McCain won 44.4% of these districts.
The districts that voted for President Obama received 40,037 awards (or 69% of the total number of awards allocated), much more than the districts that voted for candidate McCain; they received 24,483 awards (or 31% of the total number of awards).
The average awarded to marginal districts—districts with votes that did not vote overwhelmingly for one candidate or another (five percent or less difference—is $22 million. That’s significantly less than the average awarded to non-marginal districts of $419 million.
Our regression analysis finds that the stimulus funds awarded to marginal district are decreased by 41%. This effect is statistically significant at the p < .033 level. (See regression table at end of document.) However, as with Republican representation, the regression analysis does not seek to explain (nor does it explain) precisely how funds were allocated (our R-squared = .05).
House Leadership
As noted earlier, the average congressional district received $386 million. In contrast, the average leadership district (defined as a district where the representative is part of the majority or minority House political leadership or is a chairman or ranking member of a committee) received $381 million.
The average amount awarded to a leadership district is fairly different depending on whether the leader is a member of the majority or the minority. The amount awarded to average majority leadership district is $351 million while the amount awarded to average minority leadership district is $412 million.
Notice that counter-intuitively, only the amounts awarded to the majority leader are less than the amount awarded to the average district and the average non-leadership district, which is $387 million. This is also true of the dollar amount of stimulus money given to the average member of the House Appropriations Committee ($390 million) and given to the district of the Chairman on the House Appropriations Committee Dave Obey ($52 million).
Finally, on average, 148 contracts or grants were awarded to each congressional district. The number of awards to the average leadership district is 135, the number of awards to average majority leadership district is 169, and the number of awards to average minority leadership district is 101. The average non-leadership district received 150 awards, which is more than the number of awards to the average leadership district.
To sum up our results on political variables, we find that there is a slight positive correlation between the percentage of the district that voted for President Obama and the amount of stimulus funding that a district received. This weak correlation (correlation = .172) may however be coincidental (see table 3, Figure F).
Also, our results find no statistically significant effect of legislator’s tenure, membership on House Appropriations Committee or leadership position on stimulus funds allocated while seem to be a small negative effect of Republican representation on stimulus fund allocation, this underscores the findings from the previous Stimulus Facts report.
Economic Indicators
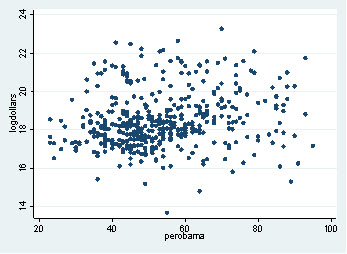
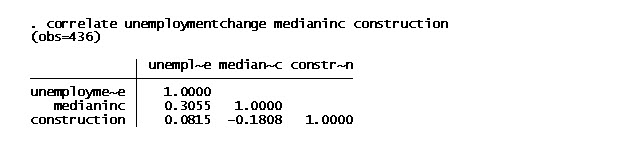
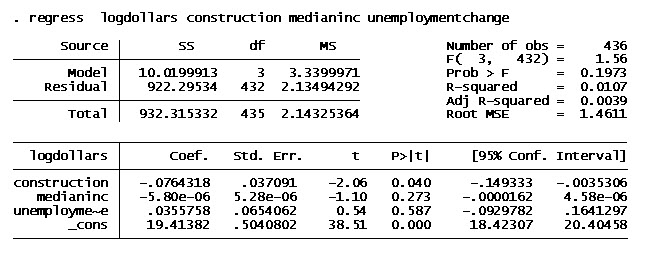
We checked the correlation (see tables 1, 2 at the end of the document) and computed the predictive power of economic indicators on stimulus fund allocation (see table 3). The scatter plots below reveal that overall there is no correlation between economic indicators and stimulus funding (see figures A-D). To confirm the lack of correlation we ran a statistical correlation test (Table 2) to check for correlation between economic indicators and the stimulus fund allocation. It confirmed the scattered plot results.
Unemployment
Controlling for the percentage each district that was employed in the construction sector, and the median income of the congressional district, we find that the variation in the unemployment rate has no statistical correlation with the allocation of stimulus funding.
I used the variation in unemployment in the construction industry as a proxy for the concentration of recession-vulnerable employment in a district.
Figure A: Scatter plot of the logarithm of stimulus funding, Unemployment change from 2007 to 2008
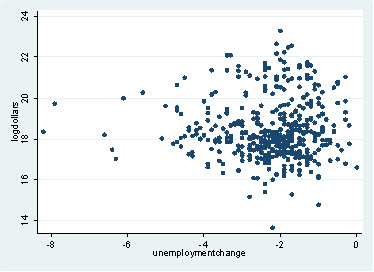
Figure B: Scatter plot of the logarithm of stimulus funding, construction employment as a percentage of total employment as of December 2008
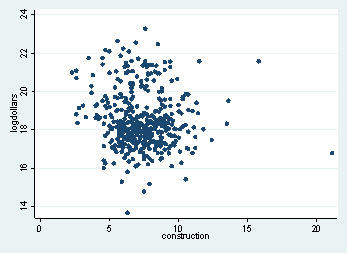
Figure C: Scatter plot of the logarithm of stimulus funding, congressional district mean income
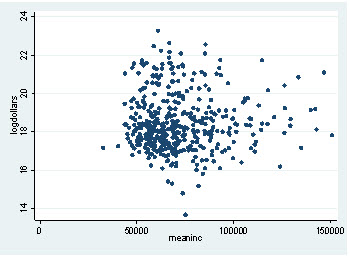
Figure D: Scatter plot of the logarithm of stimulus funding, congressional district median income
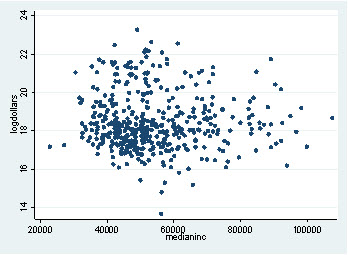
Figure E: Scatter plot of the logarithm of stimulus funding, tenure of the representative of the congressional district
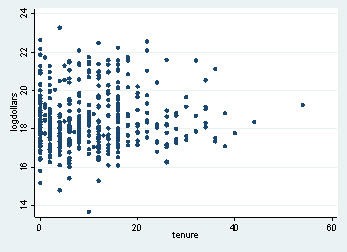
Figure F: Scatter plot of the logarithm of stimulus funding, percentage of district that voted for candidate Obama in 2008 presidential election
Income
Awards were also coded for Metropolitan Statistical Area’s (MSA) based on their ZIP code. MSAs are large geographical units with an urban center for which the Census Bureau and other agencies compile data. Chicago-Naperville-Joliet, IL-IN-WI, for example, is an MSA.
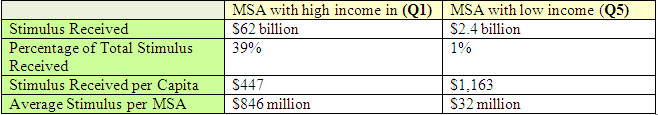
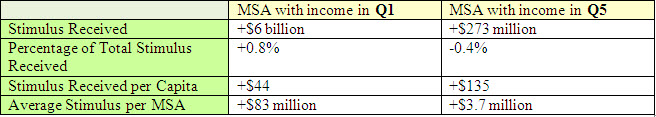
Using per capita income data from the Bureau of Economic Analysis, we divided each MSA into quintiles. Each quintile represents 20%, or one fifth, of all incomes in that MSA. As a result, the top quintile (Q1) represents the highest income MSA, and the bottom quintile (Q5) represents the MSA with the lowest income.
![]()
Click Image to Enlarge.
Based on the data, we looked at whether the allocations were affected by how high- or how low-income the MSA was. Based on the total MSA, 39% of the stimulus funds were allocated to the highest income MSAs and only 1% to the lowest quintile. However, using per capita expenditures in MSAs, the highest quintile received fewer dollars ($447 per person) than the lowest quintile received ($1,163 per person.) Thus, while high income MSAs received more money than low income MSAs, they also had more people and the result was more money going to low-income people per capita. See the tables below.
Click Image to Enlarge.
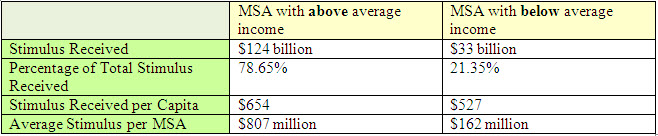
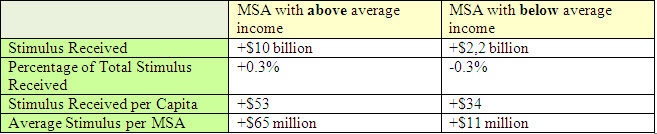
We also checked whether the stimulus allocation was affected based by another measure of income (average income, below average income.)
Click Image to Enlarge.
As we can see in the above table, MSAs with income above average received 79 percent of the stimulus funds. MSAs with income below average received only 21 percent of stimulus. However, when we looked for the amount of dollars per capita received the difference was significantly reduced. That’s because MSAs with income above average are more populated than MSAs with income below average.
**Report 1 to Report 2 Comparison Statistics**
We also wanted to see how or if the stimulus funds allocation changed between our first report and our second.
Change from R1 to R2
Difference in stimulus allocation by income broken down between above and below average.
Click Image to Enlarge.
Change from R1 to R2
Differences in stimulus allocation (by top quintile income, lowest quintile income)
![]()
Click Image to Enlarge.
Click Image to Enlarge.
Methodology
Our methodology is the same as the one we use for our last report, with a few exceptions.
First, we would like to note that the Recovery Accountability and Transparency Board has changed the way it defines a year. Previously, the data was broken down in fiscal year quarters, with the year ending on September 30th 2009 and the last quarter going from July 1st to September 30th. Now the data is broken down in calendar year quarters. With this methodology, the data that goes from October 1st to December 31st 2009 is also the last quarter of 2009. This is the reason why both our reports mention being an analysis of the 4th quarter of 2009 data.
As for our previous report, we downloaded all 2009 Q4 recipient reports for contracts and grants from the official Recovery.gov website [2]. These are self-reports submitted by the recipients of stimulus contracts and grants. We did not include loans because we are only interested in transfer payments. We removed all sub-awards from our combined dataset because they simply add up to the primary awards. Our resulting dataset is a list of every primary contract and grant reported with their corresponding attributes. Attributes include recipient names and addresses, amounts received, jobs claimed, congressional district, etc.
Each award in the source data has two addresses associated with it: the award recipient's address and the place of performance address. These are the same most of the time, but in some cases, they are not. For example, a pipe manufacturer in Florida might have received a contract for a pipe to be used in New York. We chose to only use the award recipient address for our analysis because we are interested in the political economy of the awards, i.e. who receives the payment.
Every award has a recipient state and congressional district associated with it. Almost every state also has awards that are associated with a district “ZZ.” Recovery.gov explains, “The code 'ZZ' appears in the congressional district field as a placeholder if a recipient reported an incorrect or invalid congressional district. The recipient will correct the congressional district during the next reporting period, beginning January 1, 2010.” We corrected every erroneous district in our dataset by looking up the correct district number based on the recipient's ZIP+4 code [3].
Every award has a North American Industrial Classification System code associated with it [4]. These codes represent the recipient's industry relevant to the contract. For example, the code 237110 represents “Water and Sewer Line and Related Structures Construction.” All codes above 920000 represent “Public Administration,” i.e. some government entity. We coded all awards with a code of 920000 and above as “public” and all awards with a code below 920000 as “private.”
We coded every award as Republican or Democratic based on the current representation of its associated district [5]. Awards are also coded as leadership or not. We assign the leadership code if the member from an award recipient district is part of the majority or minority House political leadership, or a chairman or ranking member of a committee. We also coded each award with whether the member from the district sits on the appropriations committee.
We coded each award as being in an Obama or McCain district based on which candidate received the most votes in the last presidential election in its recipient district [6]. We also coded each award as being in a marginal district or not. We defined marginal districts as those where the percentage difference between McCain and Obama was five percent or less.
We also coded each award with its corresponding MSA based on the recipient’s ZIP+4 code using a lookup table [7]. This allowed us to use MSA population data from the Census Bureau [8], and MSA per capita income data from the Bureau of Economic Analysis [9].
Our dataset includes awards made to recipients in U.S. territories and foreign countries [10]. Awards to these locales total $2.4 billion or just 1.41% of the total represented by all awards. Because we are interested in the political economy of the awards, we exclude these from most of our questions and use only the data for the 50 states plus the District of Columbia.
With that data, we ran a series of regression analyses using Stata, a widely used statistical software package. Regression analysis is a statistical tool that helps understand the relationships between variables. Regression analysis is what helps to identify the causal effect of one variable, and one variable alone, upon another—for example, the effect of the unemployment level in a district upon the allocation of stimulus fund in that district, for example, or the effect of party affiliation upon the that same allocation of resources.
To explore such issues, we assembled data on the underlying variables of interest (in this case, party leadership, affiliation, variation in unemployment level, or income level and distribution). In order to avoid omitted variable bias, we pulled the economic indicators from the 2008 U.S. Census Bureau American Community Survey 1-Year Estimates [11]. Then, we checked for correlation and computed the predictive power of economic indicators on stimulus fund allocation.
It is important to note that in this report we have changed the way we account for unemployment. Instead of using the unemployment rate by district, we have used as a proxy for the impact of the recession in a district the change in the unemployment rate in each district between 2007 and 2008. 2008 is the last year of the unemployment rate per district available at this point. Using change in unemployment rate allows us to check whether the relative deterioration in unemployment in a district can account of the allocation of stimulus funds as the rationale behind the bill would suggest.
Also, in this report we have used the natural logarithm dollars in our regression rather than untreated dollars. It offers a more accurate measure of the effects we were looking for.
We found no correlation between economic indicators and stimulus funding. Preliminary results find no effect of unemployment, median income, or mean income on stimulus funds allocation.
Then, we checked for the correlation between political indicators and stimulus funding. With the exception of the district’s party affiliation (whether the district’s representation was Republican or Democratic,) we found no effect of political variables on stimulus funds allocation.
Next, we used regression analysis to estimate the quantitative effect of the causal variables upon the variable that they influence. For example, when we found that the party affiliation had a causal effect of the allocation of stimulus funds, we looked for how much party affiliation mattered. The quantitative effects that we estimated are based on our model specification such that with a more completely specified model, these effects would likely change. Thus, more confidence should be placed on the relationship between the two variables (i.e., a causal factor exists) then on the quantification of that relationship.
Also, we assessed the “statistical significance” of the estimated relationships. That is, the degree of confidence that the true relationship is close to the estimated relationship. In other words, we assessed how likely we were to be correct. In all cases, we established that we had 10 out of 10 chances of being right.
Table 1
Click Image to Enlarge.
Table 2
Click Image to Enlarge.
Table 3
Click Image to Enlarge.
Table 4
Click Image to Enlarge.
Regression Variable Definitions
“state” | String variable; state where congressional district is located |
“district” | District number within the state |
“dollars” | Stimulus dollars awarded to the congressional district |
“jobs” | Jobs reported as saved or created |
“num_contracts” | Number of contracts awarded to that congressional district |
“member” | Representative of the district |
“since” | Year in which the “member” began to represent that district |
“tenure” | Difference between 2009 and “since” |
“republican” | Dummy variable; republican=1 if “member” is a Republican, republican=0 if not |
“leadership” | Dummy variable; leadership=1 if “member” is part of the majority or minority House political leadership or is a chairman or ranking member of a committee, leadership=0 if not |
“perobama” | Percentage of votes won by candidate Obama within the congressional district in the 2008 presidential election |
“permccain” | Percentage of votes won by candidate McCain within the congressional district in the 2008 presidential election |
“difference” | The difference between “perobama” and “permccain”; the margin of victory within the congressional district in the 2008 presidential elections |
“marginaly” | Dummy variable; marginaly=1 if the congressional district was decided by a margin of less than or equal to 5% of votes, marginaly=0 if not |
“obamawin” | Dummy variable; obamawin=1 if Obama won the district in the 2008 presidential elections, obamawin=0 if not |
“demlead” | Dummy variable; demlead=1 if the congressional district’s representative is a member of Democratic Party leadership, demlead=0 if not |
“goplead” | Dummy variable; goplead=1 if the congressional district’s representative is a member of Republican Party leadership, goplead=0 if not |
“appropriations” | Dummy variable; appropriations=1 if the congressional district’s representative is a member of the House Appropriations Committee |
“unemployment” | Percentage of the civilian labor force over the age of 16 that was unemployed as of December 2008 |
“unemploymentchange” | Percentage of the civilian labor force over the age of 16 that was unemployed as of December 2007 less the percentage of the civilian labor force over the age of 16 that was unemployed as of December 2008 |
“construction” | Percentage of the civilian labor force over the age of 16 employed in the construction industry |
“manufacturing” | Percentage of the civilian labor force over the age of 16 employed in the manufacturing industry |
“medianinc” | Median household income (dollars) as estimated by the U.S. Census Bureau |
“meaninc” | Mean household income (dollars) as estimated by the U.S. Census Bureau |
Thank you again for the opportunity to testify before this Committee. I look forward to answering your questions.
1. The author would like to thank Dan Rothschild and Jakina Debnam for their invaluable help compiling and analyzing the data.
2. http://www.recovery.gov/FAQ/Pages/DownLoadCenter.aspx, http://download.recovery.gov/recipient/2009_Q4/All_ContractsFY09Q4.xls…, http://download.recovery.gov/recipient/2009_Q4/All_GrantsFY09Q4.xls.zip
3. We used GovTrack.us's district finding tool at http://www.govtrack.us/congress/findyourreps.xpd
5. We used GovTrack.us to find the representative of each district, their party affiliation, and their committee membership.
6. We used 2008 presidential election results by district compiled by SwingStateProject.com. It in turn used official local government sources for its data. http://www.swingstateproject.com/showDiary.do;jsessionid=88ADE21A3CEBD0…
10. Alberta, Canada; Puerto Rico; Guam; The Marshall Islands; Northern Mariana Islands; Palau; The Virgin Islands; American Samoa; Ontario, Canada; and four awards to "OTH," which we take to mean "other."
Related Content
- | Government Spending Government Spending
- | Research Papers Research Papers
Stimulus Facts Data for Q1 FY 2011
- | Government Spending Government Spending
- | Research Papers Research Papers
Stimulus Facts Data for Q4 FY 2010
- | Government Spending Government Spending
- | Working Papers Working Papers
Stimulus Facts for Q4 FY 2009


