- | Housing Housing
- | Policy Briefs Policy Briefs
- |
America’s Infrastructure Isn’t Crumbling
Some Facts on Highway, Road, and Bridge Conditions in the United States
Rather than moving forward a large increase in federal spending on highway, road, and bridge construction, more targeted state-level maintenance spending makes sense.
Much has been said in the media and by politicians about the poor state of highways, roads, and bridges in the United States. President Trump has expressed the need for a possible $1 trillion expansion in transportation and other infrastructure spending over the next 10 years. The federal government is faced with many competing spending needs, such as defense, public pensions, and healthcare—and limited tax revenues require it to better prioritize spending.
A significant increase in federal highway, road, and bridge maintenance spending above current levels is only warranted if it is true that there is major deterioration in transportation infrastructure. Otherwise, only targeted maintenance spending in those parts of the country where problems exist makes sense. This kind of maintenance spending would be better carried out by state and local governments that are able to identify and prioritize the most important projects.
This paper uses US Department of Transportation state-level data from 2005 and 2014 to calculate the change in poor-quality highways and roads. It makes a similar calculation of changes in the number of deficient bridges. Consistent with earlier work on highway quality by economists Jeffrey Campbell and Thomas Hubbard of the Federal Reserve Bank of Chicago, I find there has not been a dramatic change in percentage of poor-quality highways and roads in the United States over the most recent 10-year period. The percentage of deficient bridges has actually experienced a decline over the period.
I conclude that US highways, roads, and bridges are not crumbling. However, there is significant variation across states. Targeted maintenance spending in some states is called for, rather than a significant increase in federal spending, which is often poorly targeted and politically expedient.
Highway and Road Conditions
The US Department of Transportation (USDOT) provides detailed annual information on highway and road pavement conditions in the United States. The USDOT reports state-generated measures of highway and road pavement quality using the International Roughness Index (IRI).
The raw highway roughness data is collected using a spring-mounted laser on a single wheel pulled by a vehicle. The machine measures the vertical movement of the laser as the vehicle travels over the highway or road. The accumulated vertical movement of the laser is collected and is expressed on an inches per mile (or centimeters per kilometer) scale. The higher the number, the rougher the ride, and the lower-quality rating the highway or road is assigned. The IRI provides an objective measure of pavement roughness for highways and roads.
Guidelines have been established to interpret these measurements. IRI values between 25 and 100 represent a surface smoothness level good enough for airport runways and superhighways, which allow speeds higher than those permitted in the United States. IRI values between 100 and 200 are suitable for the typical speeds on United States interstate highways. IRI values above 200 indicate an unacceptable level of highway roughness. Higher values can be acceptable on roads where the typical speeds are less than the average interstate highway speed.
The USDOT does not report IRI data directly. Instead, it reports the number of miles of highway or roads that have an IRI in a particular value range for each state. The total number of highway and road miles is reported as well. I classify a highway or road as being in poor condition when the IRI value exceeds 170. This cutoff for the IRI falls in the middle of the acceptable highway quality range used to evaluate highway pavement conditions. I then report the percentage of reported highway miles in each state with an IRI that exceeds 170.
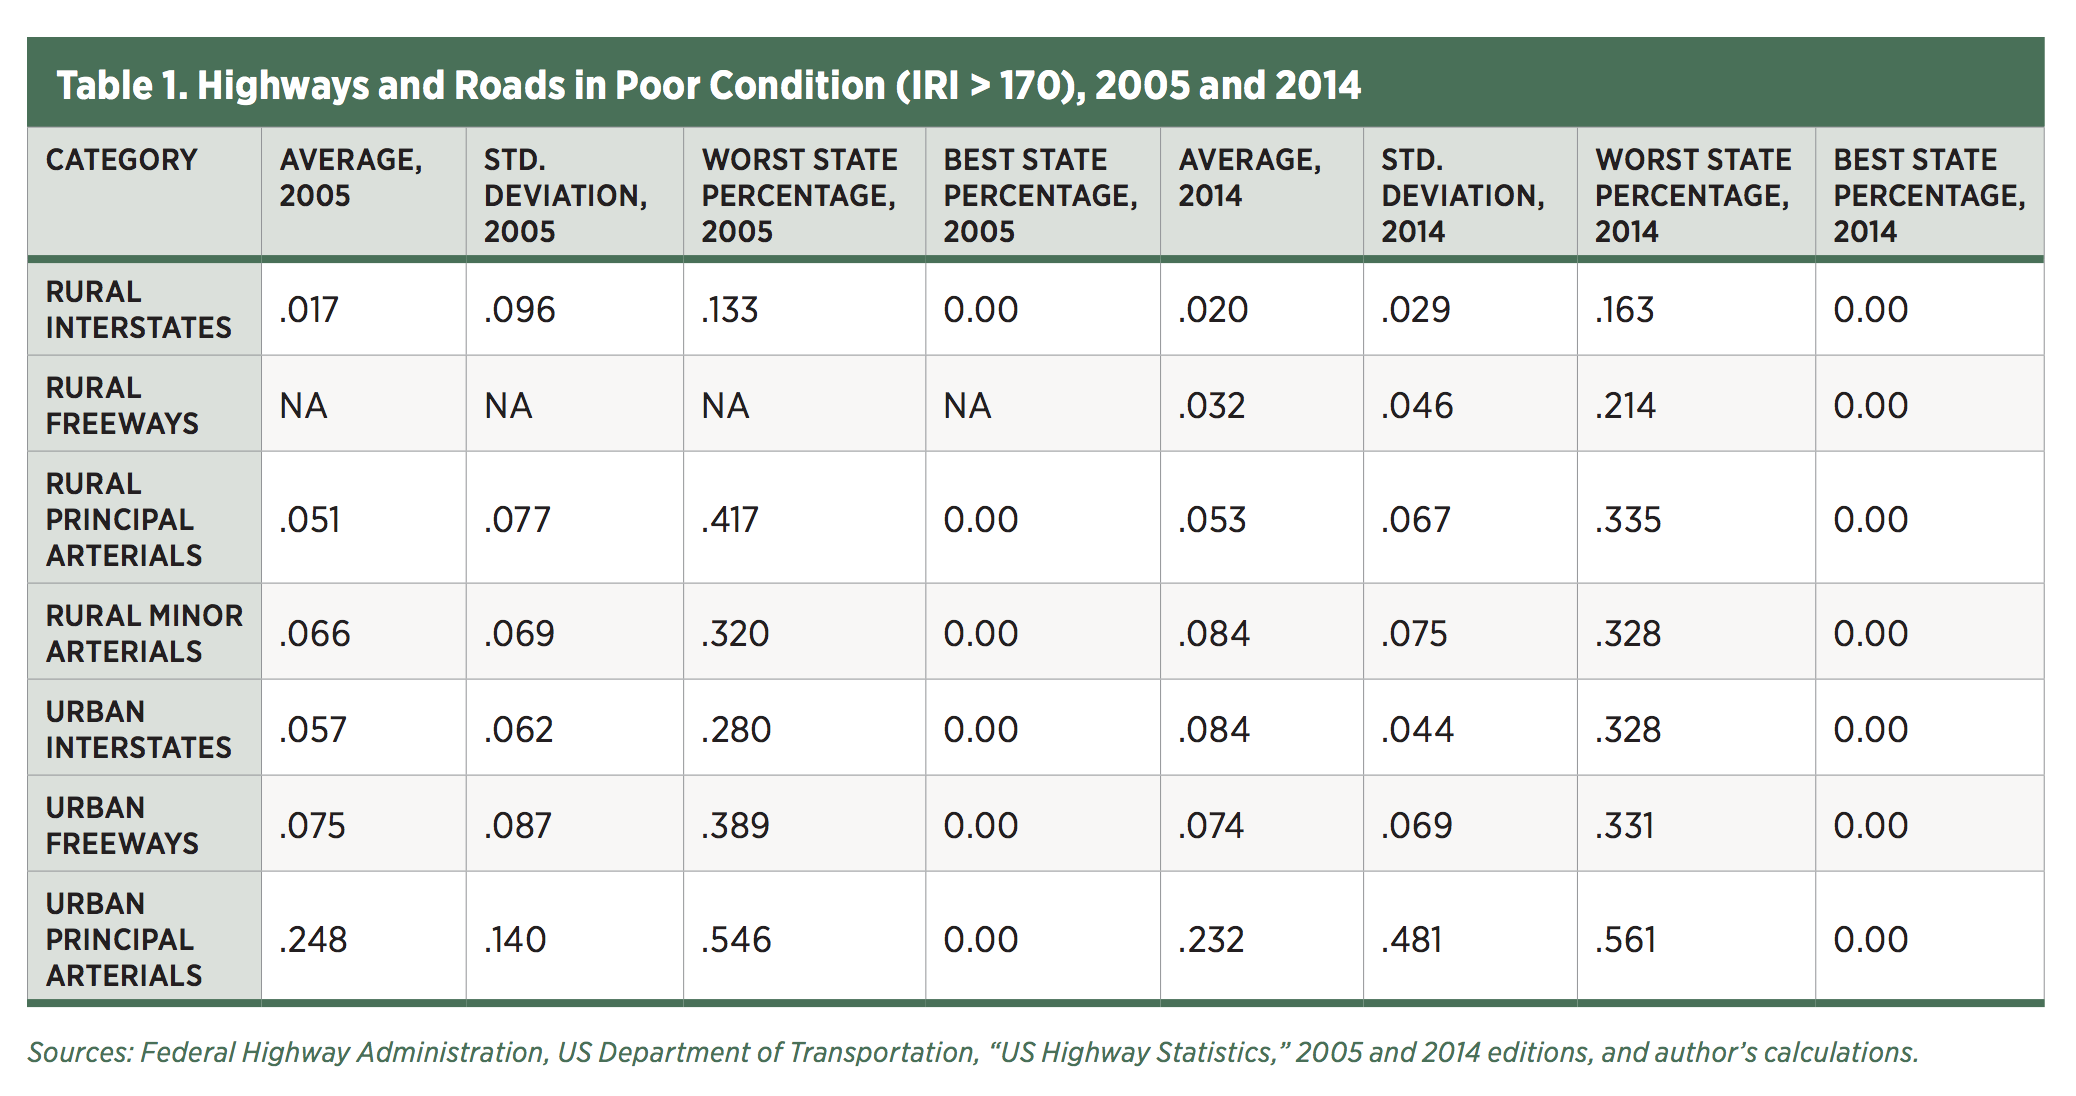
For each state, the USDOT reports miles by measured pavement roughness for (1) rural and urban interstate highways, (2) freeways and expressways, (3) other principal arterial roads, and (4) minor arterial roads. In this paper, I examine highway and road pavement conditions by comparing calculations for 2005 with the most recent data available, from 2014. Table 1 shows, for all states in each category, the average of the percentage of highways and roads in poor condition (IRI value greater than 170) in 2005 compared to 2014. The table also provides the standard deviation of each category, along with highest and lowest state values, in order to capture the variation in pavement quality across states.
The average values reported in table 1 represent the percentage of a particular group of highways or roads that are in poor condition. For example, the value of .017 for rural interstates in 2005 means that 1.7 percent of this group of state interstate highways were classified as being in poor condition. What is striking about the figures reported in table 1 is that there are only modest changes in the averages observed over the 10-year period. The second observation is that urban highways and roads are in worse condition than rural highways and roads. This is not surprising given the higher traffic volume on these highways and roads. However, urban highways and roads showed modest improvement over the 10-year period. Rural highways and roads worsened slightly over the period.
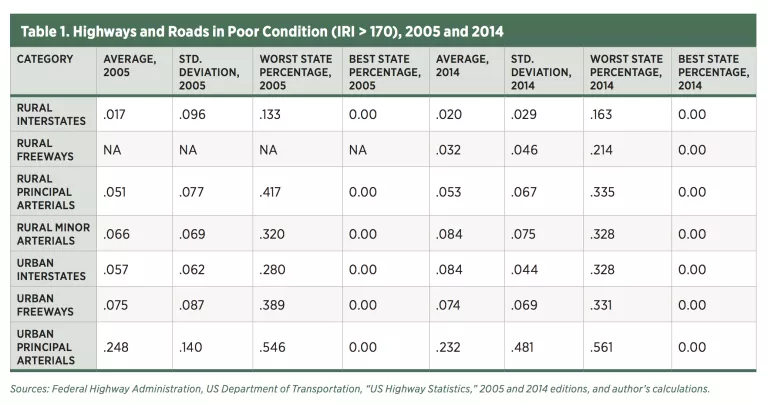
Comparing the highest and lowest values of road quality shows considerable variation across states. However, the standard deviation of the data in each category, except for rural minor arterials and urban principal arterials, declined between 2005 and 2014, providing some evidence of a decrease in cross-state pavement quality variation over the 10-year period.
Figures 1 through 6 show the percentage of highway and road mileage with an IRI value greater than 170 (poor condition) for each state and highway road category in 2005 and 2014. The charts provide an individual state-level perspective on how pavement conditions evolved over the period. For example, figure 1 shows that 13 states reduced the percentage of rural interstate highways in poor condition between 2005 and 2014. Twenty-five states reduced the percentage of urban interstate highways in poor condition between 2005 and 2014 (figure 2).
In order to provide some perspective on highway conditions in the United States, I compare the quality of roads in the United States with that of roads of other G7 countries. “The Global Competitiveness Report,” published by the World Economic Forum, provides cross-country comparisons that can serve as a rough benchmark on how the United States compares to other industrial countries. The report surveyed 14,000 business leaders and had them rate the quality of roads in their country on a 1 to 7 basis (a higher number indicates better roads).
In 2006/07, the average G7 score for road quality was 6. The US score was 6.10. In 2015/16, the average G7 score for road quality declined to 5.47. The US score fell to 5.7. Only France (6.08) and Germany (5.72) had higher scores in 2015/16. While a survey of road quality is an imprecise measure, the results suggest there has been a modest decline in road quality over this period in most industrial countries. This survey also indicates that US road quality compares favorably with that of other industrial countries.
Another indicator of highway quality is a measure of whether congestion is growing over time. Time delays serve as a measure of highway congestion. Time delays have increased from a little over 6.1 billion hours in 2004 to almost 6.9 billion hours in 2014 in the United States. This increase can be viewed as deterioration in highway performance, leading to calls for additional construction spending. Unfortunately, research has shown it is costly and difficult for a country to build its way out of congestion. While adding highway lanes can increase the total flow of traffic, congestion inevitably returns. Moving to variable highway tolling offers the best potential for reducing congestion problems on urban highways.
Bridge Conditions
Bridges are inspected every two years for structural and functional problems. A bridge is classified as structurally deficient if inspectors find it has deteriorated in such a way as to reduce its load-carrying capacity. This does not necessarily imply the bridge is unsafe but, rather, that the bridge requires maintenance. Bridges that are classified as functionally deficient do not meet current design standards. This could mean lanes are now too narrow or the bridge is not large enough for current traffic volumes, causing congestion near the bridge.
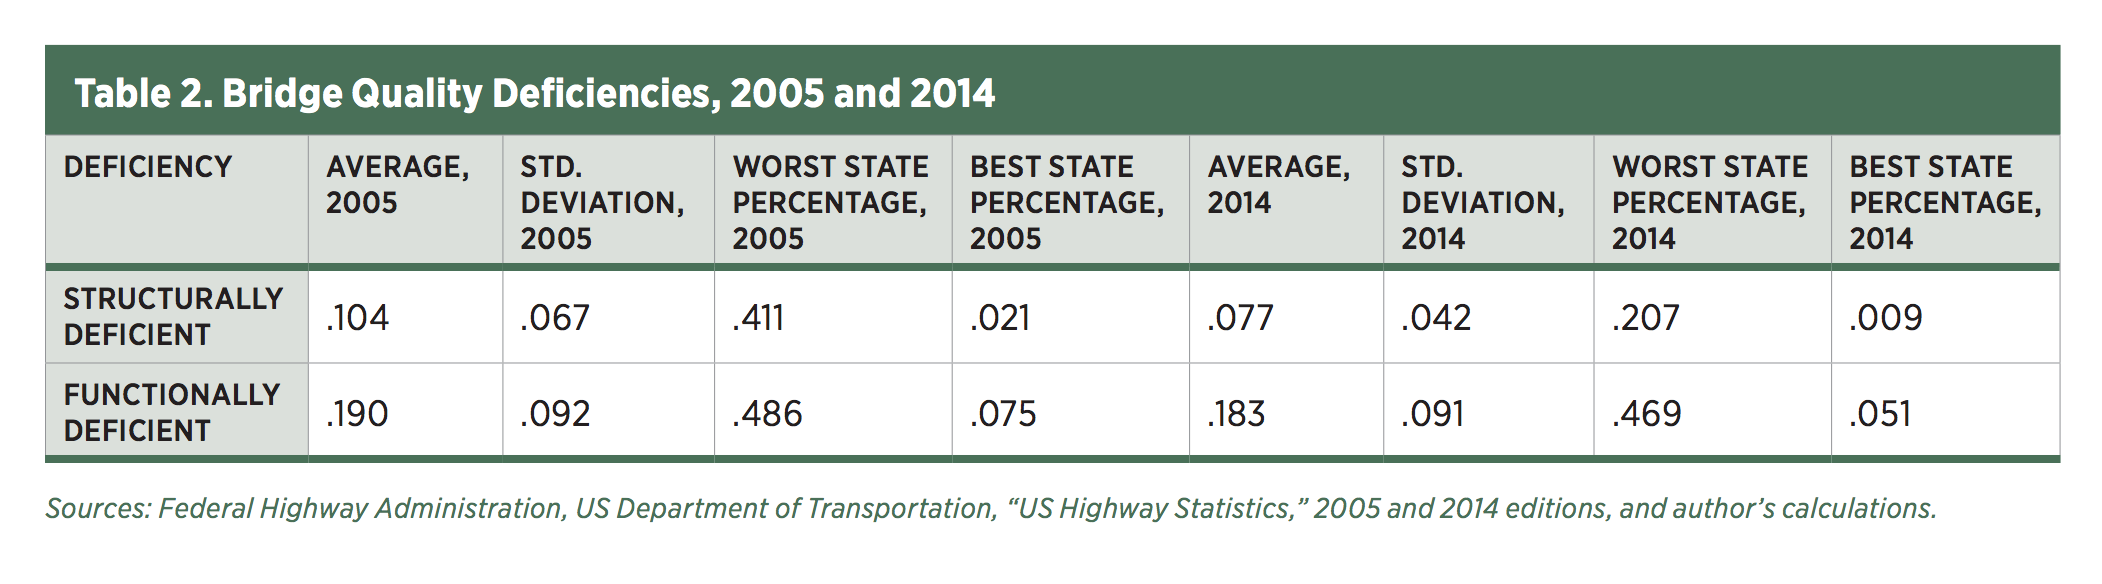
Once again, the USDOT provides state-level data on bridge quality. I calculate bridge span (in square meters) that is structurally and functionally deficient as a percentage of total bridge span in a state. Table 2 presents these calculations for the years 2005 and 2014.
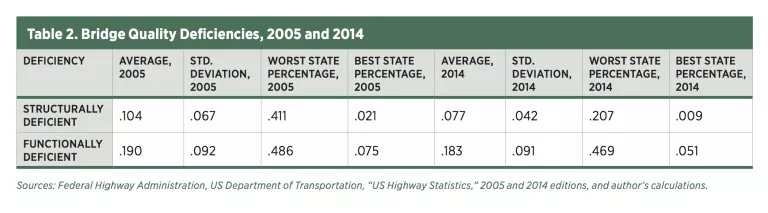
The average values reported in table 2 show the percentage of bridges that are either structurally or functionally deficient. For example, the .104 value for structurally deficient bridges in 2005 means that 10.4 percent of bridges in all states, by bridge span area, have structural issues. On average, there are fewer structurally deficient bridges than functionally deficient bridges in the United States. Bridge quality improved in each category between 2005 and 2014. Much as with highways and roads, there is considerable variation between states. However, the standard deviation of the data in both categories (very modestly for functional deficiency) declined between 2005 and 2014, suggesting that differences in bridge quality among states have narrowed over the period examined.
Figures 7 and 8 show the bridge quality in each state in 2005 and 2014. Figure 7 shows that 41 states reduced their percentage of structurally deficient bridges between 2005 and 2014. Thirty-one states reduced their percentage of functionally deficient bridges over this 10-year period, as shown in figure 8. As a whole, states have instituted maintenance efforts that have reduced the percentage of deficient bridges in the United States.
Conclusion
Much has been reported in the media about the poor condition of highways, roads, and bridges in the United States. Politicians often talk about the country’s crumbling roads and bridges. While the US transportation infrastructure, defined in terms of highways, roads, and bridges, is far from perfect, the data show that the infrastructure is not crumbling. Highway and road conditions have remained fairly stable over the last 10 years. The United States has experienced a modest improvement in bridge quality.
There is no objective standard that can determine the minimally acceptable percentage of roads and bridges that can be in poor condition without causing significant costs to society. Maintaining zero percent poor-quality roads and bridges would be costly and impractical given that infrastructure wears out through use and that natural events, like earthquakes, can cause unexpected damage.
Rather than moving forward a large increase in federal spending on highway, road, and bridge construction, more targeted state-level maintenance spending makes sense. Given the variation in highway, road, and bridge conditions across states and the current federal funding formula, additional spending from Washington is unlikely to put much of a dent in this problem. This is because such spending is poorly targeted, politically expedient, and tends to focus on new construction over maintenance. Instead, as some states have already demonstrated, concerted state and local effort to increase maintenance remains the key to improving the nation’s transportation system.

