- | Financial Markets Financial Markets
- | Policy Briefs Policy Briefs
- |
Basel III and Excess Reserves: Another Case Study of the Unintended Consequences of Risk-Based Capital Requirements
In section 201 of the Financial Services Regulatory Relief Act of 2006, Congress authorized the Federal Reserve to pay banks interest on balances held at regional Federal Reserve banks starting on October 1, 2011. However, during the 2007–2009 financial crisis, Congress fast-tracked that change to take effect October 1, 2008, in section 128 of the Emergency Economic Stabilization Act of 2008. With the payment of interest on reserves in effect, the largest banks began holding substantial amounts of excess reserves.
Reserves increased further after the Basel Committee on Banking Supervision at the Bank of International Settlements revised global bank regulation guidelines through the Basel III consultative process. Typical explanations for the increase in US bank holdings of excess reserves include the payment of interest of reserves and new US Basel III liquidity regulations. However, in this policy brief I summarize research findings that show that the rise in holdings of excess reserves coincides with the US Basel III capital final rulemaking, which predated the US Basel III liquidity final rulemaking by one year. Holdings of excess reserves reached a peak by the time the US Basel III liquidity rulemaking was finalized and began falling after that.
How Basel III Capital Regulations Favor Holdings of Reserves
The US implementation of Basel III first changed the regulatory framework concerning bank capital (essentially, forms of funding that are not prone to bank runs) in response to the 2007–2009 financial crisis. For regulatory purposes, capital gets measured using accounting concepts rather than market valuations. The rulemaking increased the key, risk-based Tier 1 capital ratio, the ratio of Tier 1 capital to risk-weighted assets, from 4.0 percent to 4.5 percent by January 1, 2013, 5.5 percent by January 1, 2014, and 6.0 percent by January 1, 2015. After that, regulators introduced the capital conservation buffer between 2016 and 2019, which added 2.5 percent to the Tier 1 capital ratio. Regulators also introduced the Global Systemically Important Bank surcharge for so-called advanced approaches BHCs, which tend to have at least $250 billion in total assets or significant foreign assets, further adding 1.0 percent and 4.5 percent to the minimum Tier 1 capital ratio. If a bank had less capital than the minimum range of the Tier 1 capital ratio of 9.5 to 13.0 percent, the bank would be limited in its ability to make distributions to investors or to pay bonuses to executives. US Basel III introduced, in addition to the non-risk-based Tier 1 capital to total assets ratio, or leverage ratio, a supplementary leverage ratio (SLR) and an enhanced SLR between 2016 and 2018.
But I will discuss and then show that the increase in excess reserves for the largest bank holding companies (BHCs) occurred as the initial changes to risk-based capital requirements took place between 2013 and 2015. The rise in excess reserves for the largest BHCs happened while the rate of interest on reserves was high compared to short-term US Treasury yields, but once short-term US Treasury yields began to rise, advanced approaches BHCs began decreasing excess reserves.
A tool for understanding the role of risk-based capital requirements, the complex process of risk weighting involves adjusting an accounting-based measure of assets by imposing higher weights on assets officially designated riskier and lower or zero weights on assets officially designated safer. The risk weighting of assets creates an incentive for banks to, ceteris paribus, shift from higher-risk-weight assets to lower-risk-weight assets.
I can illustrate why this incentive exists with a relatively simple hypothetical example summarized in table 1. To start, assume that a bank has $25 billion in reserves, $25 billion in Treasuries, $50 billion in mortgage-backed securities (MBSs), $100 billion in mortgages, and $300 billion in commercial and industrial (C&I) loans for a total of $500 billion in assets. To calculate risk-weighted assets, multiply (a) reserves and Treasuries by a risk weight of 0.0 to get $0, (b) MBSs by a risk weight of 0.2 to get $10 billion, (c) mortgages by a risk weight of 0.5 to get $50 billion, and (d) C&I loans by a risk weight of 1.0 to get $300 billion. Total risk-weighted assets in this example equal $360 billion.
Table 1. Illustrating the Gaming of Risk-Based Capital Requirements
| Tier 1 Capital (billions of dollars) | Reserves (billions of dollars) | Treasury Bills & Bonds (billions of dollars) | MBS (billions of dollars) | Mortgage Lending (billions of dollars) | C&I Lending (billions of dollars) | Total Assets (billions of dollars) | Risk-Weighted Assets (billions of dollars) | Ratio of Tier 1 Capital to Total Assets | Ratio of Tier 1 Capital to Risk-Weighted Assets |
Initial allocation | 20 | 25 | 25 | 50 | 100 | 300 | 500 | 360 | 0.040 | 0.056 |
Increasing capital | 22 | 25 | 25 | 50 | 100 | 300 | 500 | 360 | 0.044 | 0.060 |
Gaming risk-based capital | 20 | 50 | 50 | 50 | 100 | 250 | 500 | 310 | 0.040 | 0.06 |
Note: The ratio of Tier 1 capital to risk-weighted assets for increasing capital is 0.061 but is rounded down to 0.060 for simplicity.
Banks tend to operate with more than the regulatory minimum required amount of capital, but in this example I assume that the bank may operate at the regulatory minimum. Under US Basel I, the regulatory minimum ratio of Tier 1 capital to total assets typically was 4 percent. If one were to apply that requirement to my example of a bank with $500 billion in total assets, then the bank would need at least $20 billion in Tier 1 capital to comply with the minimum leverage ratio. And under Basel I, the regulatory minimum ratio of Tier 1 capital to risk-weighted assets was also 4 percent, which means that the bank would need only $14.4 billion to comply, but with $20 billion in Tier 1 capital, its ratio of Tier 1 capital to risk-weighted assets is 5.6 percent. In this example, the leverage ratio serves as the initial binding constraint, because the bank needs more capital to satisfy the leverage ratio than the risk-based ratio.
Under US Basel III, the minimum Tier 1 capital ratio increased to 6 percent by 2015. Under the new capital guidelines, the bank might still comply with the minimum leverage ratio of 4 percent, but with $20 billion in Tier 1 capital, the bank no longer meets the minimum Tier 1 capital ratio. Ideally, the bank would simply increase capital to at least $21.6 billion, which would increase the Tier 1 leverage ratio to 4.4 percent and help the bank meet the minimum Tier 1 capital ratio of 6 percent. Now the risk-based capital ratio binds, as the bank operates above the leverage ratio. But that is not the only option.
A bank could game the capital ratios by keeping Tier 1 capital as is, because doing so still complies with the leverage ratio, and instead shift from holding more higher-risk-weight assets to more lower-risk-weight assets to comply with the minimum Tier 1 capital ratio. For instance, if the bank were to reduce C&I loans by $50 billion and increase holdings of reserves and Treasuries by $25 billion each, doing so would increase the Tier 1 capital ratio to 6.5 percent. Combinations of shifting from higher-risk-weight assets to lower-risk-weight assets and increasing capital also exist. This simplistic example illustrates the value to a bank of having access to lower-risk-weight assets for compliance with minimum risk-based capital ratios. Next, I briefly summarize the US Basel III liquidity coverage ratio, which some have identified as a driver of holdings of excess reserves.
How the Liquidity Coverage Ratio Favors Reserves Too
After finalizing the US Basel III capital rulemaking, regulators proposed and finalized the US Basel III rulemaking on the liquidity coverage ratio. The rulemaking called for BHCs with at least $50 billion in total assets to maintain a minimum ratio of high-quality liquid assets to net cash outflows over an ensuing 30-day period. The highest-quality liquid assets include reserves, US Treasuries, and other securities guaranteed by the US government, which do not face haircuts. Because of this preferential regulatory treatment, BHCs gain an incentive to hold reserves as well as Treasuries. BHCs face limits on the amount of less liquid assets they can hold relative to net cash outflows and do face haircuts.
I now turn to some empirical results to show how, after the implementation of US Basel III, advanced approaches BHCs, which had greater increases in regulatory capital requirements under US Basel III, increased holdings of reserves through 2015, while another group of smaller BHCs, with at least $10 billion in total assets, hardly did.
Holdings of Excess Reserves Rise Mostly during the Implementation of Basel III Capital Regulation
Figure 1 depicts the average ratio of excess reserves relative to total assets for so-called advanced approaches BHCs, as well as other large BHCs that had at least $10 billion in total assets. The figure shows a sharp rise in the average share of excess reserves to assets for advanced approaches BHCs from 6.1 percent in Q1 2013, when increases in the minimum US Basel III Tier 1 capital ratio first began, to 9.8 percent in Q4 2013, when the US Basel III liquidity rulemaking was proposed. The series peaks at 10.9 percent by Q3 2014, when the US Basel III liquidity rulemaking was finalized. The figure reveals that most of the increase occurred before the liquidity regulation was proposed and finalized, which suggests that BHCs primarily responded to the capital rulemaking rather than the liquidity rulemaking. At the same time, the average share of excess reserves to total assets for other large banks, which were not the focus of US Basel III capital regulation, did not vary much through the sample.
Figure 1. Average Ratio of Excess Reserves to Total Assets for US BHCs, Q2 2012–Q4 2018
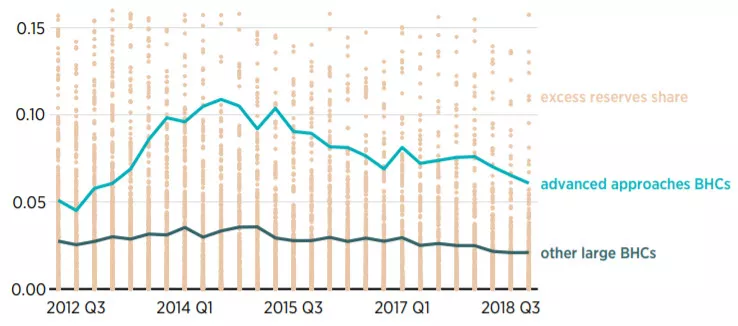
Note: The figure depicts the ratio of excess reserves to total assets for all BHCs with at least $10 billion in total assets.
Source: To measure excess reserves, I use balances held at Federal Reserve banks from the bulk bank call report data. “Download All SDI Data,” Quarterly Financial Data - SDI, Federal Deposit Insurance Corporation, accessed June 1, 2021, https://www5.fdic.gov/sdi/download_large_list _outside.asp. After aggregating and sorting these balances by BHC, I divide the amount by BHC total assets reported from schedule HC, bhck2170.
After Q2 2015, the average share begins to fall through the end of the sample for advanced approaches BHCs to 6.1 percent. One reason for the subsequent decline seems to be the increase in Treasury yields relative to the rate of interest on reserves. As a result, the advanced approaches BHCs appear to substitute from reserves to Treasuries.
This phenomenon is visible in figure 2, which depicts the sum of excess reserves and Treasuries relative to total assets for all BHCs that had at least $10 billion in total assets. For advanced approaches BHCs, after rising from 8.9 percent to 12.6 percent between Q1 2013 and Q4 2013, the ratio reaches a peak of 14.9 percent by Q3 2014, and although it declines after that, the ratio never falls below 12.0 percent.
Figure 2. Average Ratio of Excess Reserves and Treasuries to Total Assets for US BHCs, Q2 2012–Q4 2018
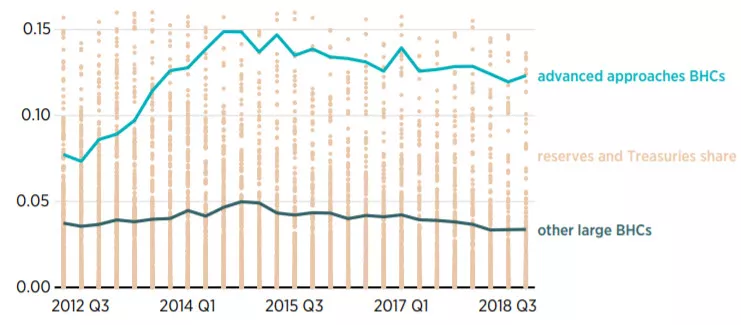
Note: The figure depicts the sum of excess reserves and the amortized cost value of Treasuries relative to total assets.
Source: To measure excess reserves, I use balances held at Federal Reserve banks from the bulk bank call report data. “Download All SDI Data,” Quarterly Financial Data - SDI, Federal Deposit Insurance Corporation, accessed June 1, 2021, https://www5.fdic.gov/sdi/download_large_list_outside.asp. After aggregating and sorting these figures by BHC, I divide the amount by BHC total assets reported from schedule HC, bhck2170. To measure Treasuries, I add held-to-maturity Treasuries (bhck0211), available-for-sale Treasuries (bhck1286)—measured at amortized cost from schedule HC-B—and consolidated Treasuries for trading from schedule HC-D (bhcm3531), then divide the sum by total assets reported from schedule HC, bhck2170.
Conclusion
Attempts to make the largest BHCs operate with more capital since the 2007–2009 financial crisis appear also to have the perhaps unintended consequences of making those banks increase holdings of the lowest-risk-weighted assets. These effects seem to arise from the complex nature of existing regulatory capital requirements for the largest BHCs. Even though the regulation allows BHCs more flexibility to comply with regulation, it still leaves them with the opportunity to fund with less capital than they would have without the risk-based regulation. With relatively little capital, BHCs have a higher likelihood of facing distress than if they had more capital.

