- | International Freedom and Trade International Freedom and Trade
- | Policy Briefs Policy Briefs
- |
Businesses on Facebook and Propensity to Export: Australia
Examining new Facebook survey data of 336,000 small- and medium-sized business (SMBs) across 42 countries—the survey is a joint effort by Facebook, the Organisation for Economic Co-operation and Development (OECD), and the World Bank—we find that the share of businesses on the digital platform that engage in trade ranges from 8 percent (Argentina) to 31 percent (Bangladesh). We focus on Australia and find evidence that firms on Facebook are more likely to export than firms in general. These findings support an emerging pattern in the data showing that digital platforms and online social networks can facilitate cross-border trade, especially for smaller firms. In this brief, we highlight three key observations:
- Australian businesses on Facebook have a higher propensity to export. The share of Australian businesses that export are 12.33 percent for businesses on Facebook and 7.6 percent for businesses in general, excluding single-person firms. We find that the propensity to export is higher on Facebook for every firm size category (except the largest firms) and for every industry category.
- Research consistently shows exporting firms outperform nonexporting firms, yet few small businesses engage in trade. In Australia, exporters outperform nonexporters on employment, training, innovation, wages, and introducing new products. Yet few small businesses export. Australian Bureau of Statistics (ABS) data indicate that 31 percent of larger firms export, compared to 6.95 percent of smaller firms. These results are in line with statistics of other OECD countries.
- Policies involving digital platforms and online social networks should not overlook their potential role in trade facilitation. High-performing firms are more likely to export. Whether good firms export or the act of exporting makes firms better is still not clear from the data (there seems to be evidence for both). Either way, as policymakers continue to seek expanded market access abroad, particularly for SMBs, they should not overlook the role of digital and online platforms in facilitating international trade.
Digital Platforms Are Changing the Trade Landscape
An emerging body of research, as discussed in this brief, shows that e-commerce can facilitate international trade, particularly for SMBs.
We analyze new data regarding businesses on Facebook from the Future of Business Survey. The survey is a collaborative effort of Facebook, the OECD, and the World Bank. The survey, launched in February 2016, has responses from 336,000 businesses on Facebook across 42 countries and includes information on business characteristics and whether businesses sell to foreign markets. Across all 42 countries, we examine the share of firms on the digital platform that engage in international trade.
We would expect that having a Facebook page would enable a firm to strengthen its local relationships and expand its reach outside its local community. That is, a social networking platform can connect the firm not only with those in its own circle, but with those in its mutual friends’ circles as well. Facebook can facilitate trust across individuals and then use that trust mechanism by connecting a firm to expanding circles of friends. In this way, a social network can help to create bridges between individuals and other existing networks.
For Australia, we analyze the relationship between the propensity to export and certain business characteristics, such as firm size and industry. The standard definition of an SMB in Australia is a firm with fewer than 200 employees, but the highly disaggregated nature of the survey data, combined with available national statistics, allows us to go even further and break down SMBs in terms of firm size (e.g., single person, 1–19, 20–199, and 200 or more).[1]
We find that Australian SMBs on Facebook consistently export more than SMBs in general, irrespective of firm size and industry. These businesses are important to the larger economy. SMBs represent a large share of the total number of firms in Australia and around the globe. In Australia, SMBs represent 99.8 percent of all businesses, 70 percent of employment, and 57.1 percent of GDP.[2] In the United States, SMBs represent 99 percent of all businesses, 48 percent of employment, and produce approximately 46 percent of private nonfarm GDP.[3] According to the World Bank, formal SMBs contribute up to 60 percent of total employment and 40 percent of national income in emerging economies.[4] In the European Union, SMBs represent 99 percent of all businesses, two-thirds of employment, and 57 percent of the value added by the nonfinancial business sector.[5]
Firm Performance and Propensity to Export
A body of cross-country evidence demonstrates that exporters typically outperform their counterparts that focus solely on the domestic market, in terms of total revenues, revenue growth, and labor productivity. Tim Harcourt found that Australian exporters outperform nonexporters on employment, training, innovation, wages, and introducing new products.[6]
While the data clearly demonstrate that exporters outperform nonexporters, that finding alone is not indicative of a causal relationship (i.e., whether good management leads firms to export or exporting improves a firm’s performance). There seems to be empirical evidence in both directions.
Andrew Bernard and J. Bradford Jensen provide compelling evidence that good firms become exporters: both growth rates and success measures are higher ex ante for exporters.[7] The evidence for the other direction (that exporting improves firm performance) is not absent but is less clear. Once a firm begins to export, its productivity and wage growth are not necessarily superior, although these firms do exhibit higher employment growth and higher probability of survival over a three to five years.
Recent work by David Atkin, Amit Khandelwal, and Adam Osman presents evidence of “learning by exporting,” whereby exporting improves technical efficiency.[8] The authors conduct a novel randomized experiment and attempt to identify a causal effect of exporting on firm performance using firm-level data of rug producers in Egypt. Exporters exhibited higher productivity and quality after controlling for confounding factors. One explanation is that exporting helps to connect producers with sophisticated foreign buyers, who in turn induce producers to improve performance.
Most governments recognize the need to ease access to foreign markets for the benefit of their business sectors. Over the years, we have witnessed the prevalence of free trade agreements, government-sponsored trade promotion efforts, trade financing assistance, and guidance on how to navigate foreign regulatory barriers. For instance, Australia has entered into 10 free trade agreements, and a number of other agreements are currently under negotiation.[9]
Nevertheless, the share of SMBs that reach foreign markets remains stubbornly low compared to larger firms in Australia.[10] For instance, ABS data indicate 31 percent of larger firms export, compared to 6.95 percent of smaller firms. Australian firms’ exporting behavior mirrors what is found across the OECD.[11]
Studies have examined reasons behind the low propensity of SMBs to engage in trade and generally point to access of financing, information barriers, and challenges with cross-border issues, such as regulatory differences and trade barriers.[12] Larger firms tend to have larger social networks and advertising budgets, and maintain relevant in-house expertise on customs administration, foreign regulatory issues, and trade finance, all of which are determining factors in their propensity to trade.
Trade and the Internet: Pieces of Evidence Starting to Add Up
In principle, digital platforms and financial technologies should facilitate information gathering and thus reduce the economic distance between parties. Large-scale datasets on cross-border e-commerce are not publicly available; however, researchers are finding ways to access data to study digital platforms and trade. For instance, Andreas Lendle and coauthors find that 97 percent of US-based eBay sellers export.[13] In another paper, Lendle and coauthors examine how the digital marketplace platform eBay can reduce trade costs. They find the economic effect of distance to be 65 percent smaller on eBay.[14] The authors compare the effect of geographic distance on eBay versus total international trade flows. Using bilateral trade data on 61 countries and a comparable basket of goods, they find that eBay can facilitate a distance-reducing effect on cross-border transactions.
PayPal Government Relations reports that 79 percent of US small businesses on PayPal sell to foreign markets. The PayPal merchants that engage in exporting experienced higher growth rates: small business exporters on PayPal grew 32.8 percent from 2015 to 2016 compared to 22.9 percent growth for small businesses in general.[15] These findings tend to be similar for coastal and noncoastal firms. Eighty percent of coastal merchants and 78 percent of noncoastal exported in both 2015 and 2016, and coastal exporters grew by 32.1 percent while noncoastal exporters grew by 33.6 percent. Additionally, PayPal merchants in rural areas were just as likely to export and exhibited growth rates similar to those of merchants in urban areas. In contrast, national statistics show that a higher proportion of urban firms export than rural firms and that more exporting firms are located in urban regions than rural regions.[16]
To our knowledge, this brief is the first look at the propensity of businesses on Facebook to engage in international trade compared to their counterparts in the general population. Facebook is somewhat different from other digital platforms, such as eBay, because it also functions as an online social network. The structure of Facebook facilitates connections across potential customers and the networks of those customers. The potential marketing reach is not trivial—there are two billion Facebook users.[17] No fees are required to start or maintain a Facebook business Page, and while a business may choose to buy ads on Facebook, less than 10 percent of businesses on Facebook actively advertise.[18]
Social Connectedness and the Costs of Economic Distance
Economic distance tends to increase trade costs. The cost of economic distance has been well documented—information frictions were first highlighted by James Rauch and have been found to account for over 90 percent of the distance effect in international trade.[19] Studies have shown the internet and online social connectedness can reduce the costs of economic distance through reduced search costs and easier business and customer networking.
Lincoln and McCallum find that US firm participation in exporting is positively related to internet usage in the exporting country. Their results suggest that a one percent increase in internet users in a country would increase the probability of US firms exporting there by about 1.1 percentage points, controlling for confounding factors.[20]
Social connectedness can also facilitate trade. Recent work by Bailey and coauthors introduces a new measure of social connectedness between US county pairs and between US counties and foreign countries. The researchers use the number of friendship links on Facebook to construct a “Social Connectedness Index” and examine the role of social networks in facilitating economic and social interactions. They find that the social networks on Facebook are relatively geographically concentrated. For the population of the average US county, 62.8 percent of friends live within 100 miles. Notwithstanding, they still find that trade with foreign countries is strongly related to social connectedness. In addition, higher social connectedness is associated with greater cross-country migration and more patent citations.[21]
Search costs and network access are hurdles to international commerce for both importers and exporters.[22] Mary Egan and Ashoka Mody have examined this from an importer’s point of view, and Bernard and Jensen from an exporter’s point of view.[23]
Networking—successful interactions with customers and competitors—is an inherent tool of marketing, yet it can be a challenge for small firms. Using firm-level data in Australia, Audrey Gilmore, David Carson, and Ken Grant highlight the inability of smaller firms to undertake conventional marketing owing to limited resources and the different behavior of smaller firms.[24]
Local networking has also been shown to facilitate international trade. Kamal and Sundaram examine the role of network effects in international trade and transaction costs. Their results indicate that a 10 percent increase in the number of exporters in a city results in a 5.1 percent increase in the likelihood of a first-time match between said sellers and buyer(s). In other words, the more exporters a firm is around, the more likely that firm will network and receive information about buyers abroad; inversely, the fewer exporters around, the less likely a firm will network and share buyer information.
Future of Business Survey Data on Facebook Firms
The Future of Business Survey is a collaboration between Facebook, the OECD, and the World Bank to identify how SMBs utilize Facebook business Pages to promote and facilitate business operations.
The survey was first launched in February 2016 and included 28,000 businesses from 17 countries. The survey is administered monthly. As of April 2018, the survey represents more than 336,000 businesses with a Facebook presence across 42 countries and across 31 different languages.[25]
Randomly selected firms receive the survey from Facebook and can respond to the survey once per year. The survey includes 15 to 20 questions and takes on average five to seven minutes to complete. Over time, the questions have changed slightly, as noted in our analysis later. The surveyed businesses encompass a broad range of sectors, including manufacturing; construction; wholesale and retail trade, automotive repair and maintenance services; transport, storage and communications; and other sectors.
Table 1 reports the percent of SMBs on Facebook that engage in trade, by country, and the number of observations for each country.[26] The share of firms on Facebook engaged in trade varies across countries (e.g., 8.1 percent in Argentina, 17.6 percent in Australia, and 30.9 percent in Bangladesh).
Table 1. Share of SMBs on Facebook That Trade (Percent), by Country
Country | Export Only | Import Only | Import and Export | Engaged in Trade | Number of Observations |
Argentina | 2.4 | 3.4 | 2.4 | 8.1 | 14,075 |
Australia | 4.8 | 7.6 | 5.2 | 17.6 | 13,793 |
Bangladesh | 9.1 | 11.2 | 10.6 | 30.9 | 5,768 |
Belgium | 6.0 | 10.4 | 8.2 | 24.5 | 3,989 |
Brazil | 2.1 | 4.5 | 2.0 | 8.6 | 14,401 |
Canada | 4.4 | 6.4 | 5.3 | 16.1 | 13,936 |
Chile | 2.9 | 13.4 | 3.4 | 19.7 | 5,163 |
Colombia | 4.2 | 8.2 | 3.8 | 16.2 | 14,793 |
Czech Republic | 7.6 | 10.4 | 8.7 | 26.6 | 3,032 |
Ecuador | 3.4 | 11.5 | 4.4 | 19.4 | 2,898 |
Egypt | 5.7 | 13.3 | 7.9 | 26.9 | 7,821 |
France | 6.3 | 5.8 | 5.8 | 17.9 | 14,102 |
Germany | 5.1 | 5.0 | 7.8 | 17.9 | 14,237 |
Greece | 5.0 | 11.4 | 7.3 | 23.7 | 4,342 |
Hungary | 4.9 | 7.4 | 6.5 | 18.8 | 3,404 |
India | 8.2 | 3.6 | 6.4 | 18.2 | 12,289 |
Indonesia | 4.3 | 5.5 | 4.7 | 14.5 | 12,780 |
Ireland | 6.0 | 9.5 | 6.8 | 22.3 | 8,372 |
Israel | 4.0 | 6.3 | 3.5 | 13.9 | 5,841 |
Italy | 6.4 | 4.4 | 4.9 | 15.7 | 14,344 |
Japan | 3.5 | 5.8 | 2.9 | 12.2 | 11,205 |
Malaysia | 4.2 | 7.8 | 6.1 | 18.1 | 6,988 |
Mexico | 3.5 | 7.8 | 3.5 | 14.9 | 14,095 |
Netherlands | 4.9 | 7.4 | 7.8 | 20.0 | 7,703 |
Nigeria | 5.1 | 14.7 | 10.4 | 30.1 | 2,950 |
Pakistan | 10.3 | 7.5 | 8.0 | 25.7 | 5,664 |
Peru | 3.9 | 11.2 | 3.9 | 19.0 | 7,551 |
Philippines | 4.6 | 6.7 | 6.5 | 17.8 | 7,342 |
Poland | 6.9 | 6.0 | 7.2 | 20.1 | 12,971 |
Portugal | 8.1 | 7.8 | 9.2 | 25.1 | 4,800 |
Romania | 5.2 | 12.7 | 6.4 | 24.3 | 4,500 |
Russia | 6.9 | 9.3 | 7.4 | 23.6 | 3,159 |
South Africa | 4.9 | 6.7 | 5.7 | 17.2 | 8,508 |
South Korea | 9.5 | 7.6 | 9.1 | 26.2 | 4,232 |
Spain | 5.2 | 8.4 | 5.6 | 19.3 | 15,379 |
Sweden | 5.9 | 12.6 | 7.9 | 26.5 | 3,802 |
Taiwan | 5.4 | 7.7 | 10.4 | 23.6 | 4,509 |
Thailand | 6.1 | 9.0 | 7.2 | 22.2 | 13,422 |
Turkey | 7.6 | 4.4 | 6.6 | 18.7 | 7,232 |
United Kingdom | 6.7 | 4.5 | 4.9 | 16.0 | 13,562 |
United States | 3.5 | 3.1 | 3.3 | 9.9 | 13,518 |
Vietnam | 4.6 | 10.0 | 8.0 | 22.6 | 12,365 |
Source: Authors’ calculations based on Facebook, the Organisation for Economic Co-operation and Development, and the World Bank, Future of Business Survey (dataset), accessed November 12, 2018, https://eu.futureofbusinesssurvey.org/.
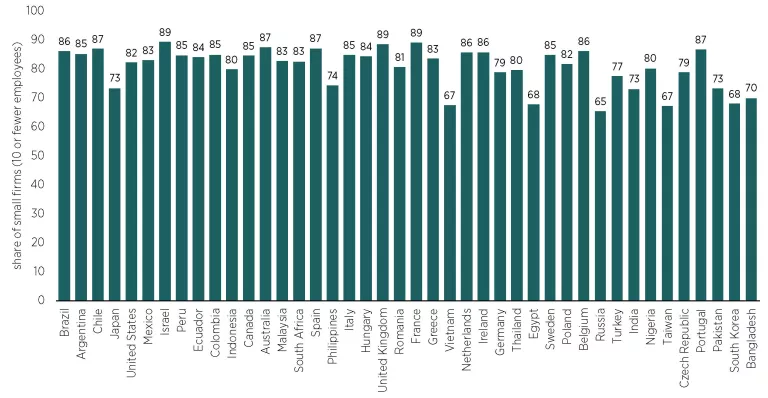
Figure 1a plots the share of businesses on Facebook that export, by country, in ascending order. Figure 1 b shows the share of Facebook businesses with 10 or fewer employees. Small businesses represent a large share of the firms not only in general, but also on Facebook (on average 81 percent). For instance, in Australia, the share of firms on Facebook that export is 10 percent, and the share of firms on Facebook with 10 or fewer employees is 87 percent.
Figure 1a. Share of Businesses on Facebook That Export (Percent)

Figure 1b. Share of Businesses on Facebook with 10 or Fewer Employees (Percent)
The Facebook survey includes questions about key business challenges.[27] The top two business challenges cited were “attracting customers” (75 percent of respondents) and “increasing revenues” (59 percent of respondents). Starting October 2016, firms were also given the option to select “selling to foreign markets” as a major business challenge.
Overall, 18 percent of businesses on Facebook across all countries (48,675 of 271,205 firms) stated that “selling to foreign markets” was one of their most important business challenges. Table 2 reports the share of firms that find exporting a key business challenge and the share of those firms that do not export. For instance, of the 8,286 Australian firms that were asked this question, 753 firms (9.09 percent) indicated that selling to foreign markets was a major challenge, and 60.03 percent of those firms do not export. Similarly, 5.75 percent of US firms indicated that exporting was one of their most important business challenges, and 69.68 percent of those firms do not export.
Table 2. Share of SMBs on Facebook That Find “Selling to Foreign Markets” a Key Business Challenge (Percent)
Country | Total Number of Observations | Find Exporting a Challenge | Don’t Export |
Argentina | 7,917 | 11.67 | 82.47 |
Australia | 8,286 | 9.09 | 60.03 |
Bangladesh | 5,768 | 35.04 | 68.88 |
Belgium | 3,989 | 9.55 | 47.77 |
Brazil | 8,953 | 8.34 | 82.20 |
Canada | 8,073 | 8.68 | 63.77 |
Chile | 5,163 | 16.97 | 80.25 |
Colombia | 7,992 | 28.52 | 83.37 |
Czech Republic | 3,032 | 11.11 | 48.96 |
Ecuador | 2,898 | 27.54 | 84.09 |
Egypt | 6,361 | 25.88 | 73.82 |
France | 8,368 | 9.63 | 57.07 |
Germany | 8,305 | 9.22 | 48.69 |
Greece | 4,342 | 24.83 | 68.92 |
Hungary | 3,404 | 20.45 | 69.54 |
India | 7,964 | 22.69 | 71.50 |
Indonesia | 8,216 | 35.50 | 85.91 |
Ireland | 6,225 | 11.20 | 56.53 |
Israel | 4,565 | 16.43 | 74.40 |
Italy | 8,440 | 13.97 | 69.64 |
Japan | 8,669 | 9.07 | 68.19 |
Malaysia | 6,988 | 27.95 | 82.59 |
Mexico | 7,872 | 19.99 | 82.02 |
Netherlands | 7,703 | 8.91 | 44.75 |
Nigeria | 2,950 | 34.20 | 75.72 |
Pakistan | 5,664 | 32.10 | 70.46 |
Peru | 7,551 | 27.90 | 82.63 |
Philippines | 7,342 | 27.19 | 79.46 |
Poland | 8,565 | 16.44 | 55.97 |
Portugal | 4,800 | 18.00 | 58.22 |
Romania | 4,500 | 18.42 | 71.77 |
Russia | 3,159 | 12.57 | 59.95 |
South Africa | 6,164 | 18.93 | 76.18 |
South Korea | 4,232 | 20.18 | 51.87 |
Spain | 8,297 | 13.98 | 63.71 |
Sweden | 3,802 | 10.15 | 49.48 |
Taiwan | 4,509 | 20.85 | 63.94 |
Thailand | 8,553 | 25.00 | 69.55 |
Turkey | 7,232 | 21.75 | 70.82 |
United Kingdom | 8,274 | 8.32 | 55.09 |
United States | 8,266 | 5.75 | 69.68 |
Vietnam | 7,852 | 21.75 | 72.95 |
Source: Authors’ calculations based on Facebook, the Organisation for Economic Co-operation and Development, and the World Bank, Future of Business Survey (dataset), accessed November 12, 2018, https://eu.futureofbusinesssurvey.org/.
The firms that indicated exporting was a major challenge were also asked to select the potential reason(s) as to why it was a challenge.[28] “Finding a business partner” was the top challenge for all countries overall and for Australia. The second most common challenge was “market access limitations.” For Australian firms on Facebook, the third- and fourth-biggest challenges were “large geographical distance from home country” and “language and/or cultural gap,” respectively (see table 3).
Some of these challenges are inherent to geography, and others are addressed through trade negotiations, cross-border cooperation, and pursuing regulatory compatibility. Outside of geographical distance, a lower share of Australian firms on Facebook find these issues to be a challenge to exporting, which may reflect the numerous free trade agreements Australia has with other countries that address a number of nontariff barriers.
Table 3. Export Challenges for Businesses on Facebook for All Countries and Australia (in Descending Order for Australia)
Export Challenges | Overall (Percent) | Australia (Percent) |
Finding business partners | 61.05 | 43.96 |
Market access limitations | 44.89 | 37.05 |
Large geographical distance from home country | 28.84 | 34.93 |
Language and/or cultural gap | 35.33 | 33.20 |
Different regulations in other countries | 36.03 | 32.67 |
Customs regulations | 35.94 | 24.30 |
Poor online payment alternatives to sell online | 30.66 | 18.59 |
Poor internet connection to sell online | 20.53 | 14.74 |
Other; specify | 5.66 | 13.41 |
Securing export finance | 33.37 | 12.88 |
Tax regulations in other countries | 15.81 | 9.96 |
Source: Authors’ calculations based on Facebook, the Organisation for Economic Co-operation and Development, and the World Bank, Future of Business Survey (dataset), accessed November 12, 2018, https://eu.futureofbusinesssurvey.org/.
Australian Facebook Firms Compared to the General Population
The ABS conducts two national surveys that are used in this analysis: the Counts of Australian Businesses, Including Entries and Exits and the Selected Characteristics of Australian Business.[29]
Table 4 shows the descriptive statistics for Facebook and ABS data. The share of firms with fewer than 20 employees is 91.37 percent on Facebook and 97.49 percent in the ABS data. We note that the share of single-person firms in the ABS data (61.21 percent) is larger than that in the Facebook data (45.80 percent).
With respect to industry categories, services is the largest main industry for both datasets, comprising 28.65 percent of firms on Facebook and 43.38 percent of firms in the ABS data. Firms categorized under hotels and restaurants and wholesale and retail trade make up a higher share of firms on Facebook, while construction firms are a higher share of firms in the ABS data. The share of firms in the “other” category is 28.97 percent in the Facebook data and 15.15 percent in the ABS data. Note that this category is a miscellaneous group and includes arts, agriculture, mining, and electricity.
Table 4. Overall Population Data Distribution of Firms in the Facebook and ABS Data (Percent)
|
| Future of Business Survey | Australian Bureau of Statistics Surveys |
Size of the firm | Single-person firm | 45.80 | 61.21 |
| 1 to 19 | 45.57 | 36.28 |
| 20 to 199 | 4.95 | 2.33 |
| 200 or more | 1.44 | 0.18 |
| Don’t know/prefer not to say | 2.24 | 0.00 |
Industry | Manufacturing | 3.63 | 3.75 |
| Construction | 5.16 | 16.60 |
| Wholesale and retail trade | 15.81 | 9.36 |
| Hotels and restaurants | 10.06 | 4.14 |
| Transport, storage, and communications | 6.55 | 7.62 |
| Services | 28.65 | 43.38 |
| Nonprofit/charity organization | 1.17 | N/A |
| Other | 28.97 | 15.15 |
| Total number of observations | (13,793) | (2,238,305) |
Note: The total number of firms in the ABS data is calculated by aggregating the total number of firms at the end of the operating year.
Sources: Authors’ calculations based on Facebook, the Organisation for Economic Co-operation and Development, and the World Bank, Future of Business Survey (dataset), accessed November 12, 2018, https://eu.futureofbusinesssurvey.org/; Australian Bureau of Statistics, “Counts of Australian Businesses, Including Entries and Exits, Jun 2013 to Jun 2017,” February 20, 2018, http://www.abs.gov.au/AUSSTATS/[email protected]/DetailsPage/8165.0Jun%202013%20…, data cube 2 (“Businesses by Main State by Industry Class by Employment Size Ranges, June 2016 and June 2017”).
Analyzing Australian Exporters
Figure 2 shows that 12.33 percent of all Australian businesses on Facebook export, compared to 7.60 percent of Australian businesses in general (excluding single-person firms on Facebook in order to make the data comparable to ABS data).[30]
Figure 2. Share of Australian Firms That Export, by Future of Business Survey and Selected Characteristics of Australian Businesses (Percent)

Sources: Authors’ calculations based on Facebook, the Organisation for Economic Co-operation and Development, and the World Bank, Future of Business Survey (dataset), accessed November 12, 2018, https://eu.futureofbusinesssurvey.org/; Australian Bureau of Statistics, “Selected Characteristics of Australian Businesses 2016-17,” August 16, 2018, http://www.abs.gov.au/AUSSTATS/[email protected]/DetailsPage/8167.02016-17?OpenD…, data cube 2 (“Business Markets and Competition”); Australian Bureau of Statistics, “Counts of Australian Businesses, Including Entries and Exits, Jun 2013 to Jun 2017,” February 20, 2018, http://www.abs.gov.au/AUSSTATS/[email protected]/DetailsPage/8165.0Jun%202013%20…, data cube 2 (“Businesses by Main State by Industry Class by Employment Size Ranges, June 2016 and June 2017”).
Figure 3 shows the share of firms that export by firm size. Small firms (firms with 1 to 19 employees) are more likely to export on Facebook than are firms in general—approximately 11 percent, compared to 7 percent. Similarly, on Facebook, 17 percent of medium-sized firms (firms with 20 to 199 employees) export, compared to 15 percent of firms in general.
While 7.19 percent of single-person firms on Facebook export, there is no comparable statistic in the ABS survey, and this is the case for firms classified in the “prefer not to say” firm size category. At first glance, it may appear that the largest firms (firms with 200 or more employees) are less likely to export on Facebook—26 percent, compared to 31 percent among firms generally. However, Facebook surveyed firms with 500 employees or fewer, while firms surveyed by the ABS may include firms with over 500 employees. Therefore, it is not surprising that these very large firms are more likely to export.
Figure 3. Share of Firms That Export (Percent), by Firm Size

Sources: Authors’ calculations based on Facebook, the Organisation for Economic Co-operation and Development, and the World Bank, Future of Business Survey (dataset), accessed November 12, 2018, https://eu.futureofbusinesssurvey.org/; Australian Bureau of Statistics, “Selected Characteristics of Australian Businesses 2016-17,” August 16, 2018, http://www.abs.gov.au/AUSSTATS/[email protected]/DetailsPage/8167.02016-17?OpenD…, data cube 2 (“Business Markets and Competition”); Australian Bureau of Statistics, “Counts of Australian Businesses, Including Entries and Exits, Jun 2013 to Jun 2017,” February 20, 2018, http://www.abs.gov.au/AUSSTATS/[email protected]/DetailsPage/8165.0Jun%202013%20…, data cube 2 (“Businesses by Main State by Industry Class by Employment Size Ranges, June 2016 and June 2017”).
The share of exporting firms on Facebook is greater than the share of exporting firms in general for every industry category (see figure 4). Manufacturing firms are the most likely to export both in general (19 percent) and on Facebook (32 percent). For wholesale and retail, 18 percent of firms on Facebook export, compared to 13 percent for firms in general. Transport, storage, and communication exhibits the largest difference in the propensity to export—20 percent of firms on Facebook export in this sector, compared to 8 percent of firms in general.
Figure 4. Share of Firms That Export, by Industry (Percent)

Sources: Authors’ calculations based on Facebook, the Organisation for Economic Co-operation and Development, and the World Bank, Future of Business Survey (dataset), accessed November 12, 2018, https://eu.futureofbusinesssurvey.org/; Australian Bureau of Statistics, “Selected Characteristics of Australian Businesses 2016-17,” August 16, 2018, http://www.abs.gov.au/AUSSTATS/[email protected]/DetailsPage/8167.02016-17?OpenD…, data cube 2 (“Business Markets and Competition”); Australian Bureau of Statistics, “Counts of Australian Businesses, Including Entries and Exits, Jun 2013 to Jun 2017,” February 20, 2018, http://www.abs.gov.au/AUSSTATS/[email protected]/DetailsPage/8165.0Jun%202013%20…, data cube 2 (“Businesses by Main State by Industry Class by Employment Size Ranges, June 2016 and June 2017”).
Conclusion
This report uses new survey data from SMBs with a presence on Facebook. We present detailed statistics for Australia and examine the propensity to export on Facebook compared with firms in general. We find that Australian businesses on Facebook have a higher propensity to export than firms in general for every firm size category (except the largest) and every industry category.
Our findings are consistent with the emerging literature on digital platforms and international trade, which generally shows that businesses, particularly small businesses, on online digital platforms exhibit a higher propensity to engage in trade than businesses in general.
It is still unclear if export-prone firms are more likely to be on digital platforms or if being on a digital platform makes a firm more likely to export. Firm-level data over time would enable a more sophisticated analysis and allow the researcher to control for confounding effects of other firm-level characteristics. But we should not be surprised if causality runs both ways in this relationship, and consequently we believe that a prudent approach in the design of policies and regulations on digital platforms and online social networks will not overlook the potential of these technologies in trade facilitation.
Appendix A: Facebook and Australian Bureau of Statistics Concordance
Data Description
The Selected Characteristics of Australian Businesses is an annual survey that reports the share of firms that export by firm size and by industry. Firm size is in terms of number of employees. The Selected Characteristics of Australian Businesses data exclude single-person (nonemployer) firms. The firm size categories in the Selected Characteristics of Australian Businesses are not directly comparable to the categories in Facebook. Hence, we map the Selected Characteristics data to the more aggregated Facebook data using Counts of Australian Businesses, Including Entries and Exits. The Counts of Australian Businesses, Including Entries and Exits survey reports the total number of firms in Australia by firm size and by industry at a disaggregated level. We weight the Selected Characteristics of Australian Businesses categories using Counts of Australian Businesses, Including Entries and Exits information to construct firm size categories comparable to the Facebook data. The concordance results in five firm size categories including single person, 1 to 19, 20 to 199, 200 or more, and unknown.
The Selected Characteristics of Australian Businesses and Counts of Australian Businesses, Including Entries and Exits survey data exclude firms with less than $75,000 in annual turnover, which is the threshold required to register for an Australian Business Number. The Future of Business data do not exclude businesses with less than $75,000 in annual turnover; however those would likely be the single-person firms (which are excluded from this analysis).
Next we detail the firm size concordance between Counts of Australian Businesses, Including Entries and Exits and Future of Business data. This concordance results in comparable datasets with the exception of the largest firm category. The largest firm size category of the ABS data is more than 200 employees, and the largest firm size category of the Future of Business data is 200 to 500 employees. (The Future of Business data were limited to SMBs, or businesses with fewer than 500 employees.) While this category should be interpreted with caution, it is likely that few additional firms are included in the Counts of Australian Businesses, Including Entries and Exits data, considering there are very few large firms in Australia.
Industries are classified according to the Australian and New Zealand Standard Industrial Classification (ANZSIC) code 2006. We also detail the industry concordance across Selected Characteristics of Australian Businesses; Counts of Australian Businesses, Including Entries and Exits; and Future of Business.
Firm Size Comparisons
Single-Person Firm
- Future of Business (shown February 2016–June 2016): just me
- Future of Business (shown since July 2016): just me
- Counts of Australian Businesses, Including Entries and Exits: nonemploying
1 to 19 Employees
- Future of Business (shown February 2016–June 2016): 2–3; 4–10
- Future of Business (shown since July 2016): 2–4; 5–9; 10–19
- Counts of Australian Businesses, Including Entries and Exits: 1–19
20 to 199 Employees
- Future of Business (shown February 2016–June 2016): 11–50
- Future of Business (shown since July 2016): 20–49; 50–249
- Counts of Australian Businesses, Including Entries and Exits: 20–199
Over 200 Employees
- Future of Business (shown February 2016–June 2016): more than 50
- Future of Business (shown since July 2016): 50–249; more than 250
- Counts of Australian Businesses, Including Entries and Exits: more than 200
Don’t Know or Prefer Not to Say
- Future of Business (shown February 2016–June 2016): don’t know or prefer not to say
- Future of Business (shown since July 2016): don’t know or prefer not to say
- Counts of Australian Businesses, Including Entries and Exits: not an option
Industry Classifications
Manufacturing
- Future of Business (shown February 2016–July 2016): manufacturing
- Future of Business (only shown in July 2016): manufacturing
- Future of Business (shown since July 2016): manufacturing
- Selected Characteristics of Australian Businesses: manufacturing
- Counts of Australian Businesses, Including Entries and Exits: ANZSIC 1111–2599
Construction
- Future of Business (shown February 2016–July 2016): construction
- Future of Business (only shown in July 2016): construction
- Future of Business (shown since July 2016): construction or home repair
- Selected Characteristics of Australian Businesses: construction
- Counts of Australian Businesses, Including Entries and Exits: ANZSIC 3011–3299
Wholesale and Retail Trade; Automotive Repair and Maintenance Services
- Future of Business (shown February 2016–July 2016): retail or wholesale
- Future of Business (only shown in July 2016): Wholesale and retail trade; repair of motor vehicles and motorcycles
- Future of Business (shown since July 2016): Retail or wholesale (including online shops); automotive repair or services
- Selected Characteristics of Australian Businesses: Wholesale trade; retail trade
- Counts of Australian Businesses, Including Entries and Exits: ANZSIC 3311–4320
Hotels and Restaurants
- Future of Business (shown February 2016–July 2016): hotel or restaurant
- Future of Business (only shown in July 2016): accommodation and food services
- Future of Business (shown since July 2016): accommodation (e.g., hotels, camping grounds); restaurant or café or other food services
- Selected Characteristics of Australian Businesses: accommodation and food services
- Counts of Australian Businesses, Including Entries and Exits: ANZSIC 4400–4530
Transport, Storage, and Communications
- Future of Business (shown February 2016–July 2016): not an option
- Future of Business (only shown in July 2016): transportation and storage
- Future of Business (shown since July 2016): transportation or storage (e.g., taxi, warehousing)
- Selected Characteristics of Australian Businesses: transport, postal, and warehousing
- Counts of Australian Businesses, Including Entries and Exits: ANZSIC 4610–5309
Services
- Future of Business (shown February 2016–July 2016): services
- Future of Business (only shown in July 2016): financial and insurance activities; real estate activities; professional, scientific, and technical activities; administrative and support service activities; education; human health and social work activities; public administration and defense; compulsory social security
- Future of Business (shown since July 2016): professional services (e.g., financial services, consulting, travel agents, business services); real estate (e.g., brokerage, leasing, management); education (e.g., schools, tutoring, driving school); healthcare (e.g., dentist, senior care); personal services (e.g., beauty and wellness, repair of household goods)
- Selected Characteristics of Australian Businesses: financial and insurance services; rental, hiring, and real estate services; professional, scientific, and technical services; administrative and support services; healthcare and social assistance
- Counts of Australian Businesses, Including Entries and Exits: ANZSIC 6221–8790
Nonprofit or Charity Organization
- Future of Business (shown February 2016–July 2016): nonprofit or charity organization
- Future of Business (only shown in July 2016): not an option
- Future of Business (shown since July 2016): nonprofit or charity organization
- Selected Characteristics of Australian Businesses: not an option
- Counts of Australian Businesses, Including Entries and Exits: not an option
Other
- Future of Business (shown February 2016–July 2016): other, specify
- Future of Business (only shown in July 2016): arts, entertainment, and recreation; agriculture, forestry, and fishing; mining and quarrying; electricity, gas, steam, and air conditioning supply; water supply; sewerage, waste management, and remediation activities; other, specify
- Future of Business (shown since July 2016): arts, entertainment, or recreation (e.g., museum, creative arts, sports club); other, specify
- Selected Characteristics of Australian Businesses: agriculture, forestry, and fishing; mining; electricity, gas, water, and waste services; arts and services; other services; currently unknown
- Counts of Australian Businesses, Including Entries and Exits: ANZSIC 111–1090; 2611–2922; 8910–9999
Appendix B: Comparable Shares of Firms That Export
Table 5. Shares of Firms That Export, by Facebook and ABS, and by Firm Size and Industry (Excludes Single-Person Firms)
|
| Future of Business Survey | Australian Bureau of Statistics Surveys | ||
|
| Distribution of firms | Share of exporting firms | Distribution of firms | Share of exporting firms |
Size of the firm, by number of employees | 1 to 19 | 84.08 | 11.20 | 93.53 | 6.95 |
|
| (6,286) | (704) | (812,078) | (56,439) |
| 20 to 199 | 9.14 | 17.13 | 6.02 | 14.50 |
|
| (683) | (117) | (52,245) | (7,576) |
| 200 or more | 2.65 | 26.26 | 0.46 | 31.00 |
|
| (198) | (52) | (3,976) | (1,233) |
| Don’t know or prefer not to say | 4.13 | 15.86 | 0.00 | 0.00 |
|
| (309) | (49) | N/A | N/A |
| Total number of observations | (7,476) | (922) | (868,299) | (65,248) |
Industry | Manufacturing | 3.75 | 32.14 | 5.49 | 18.60 |
|
| (280) | (90) | (47,653) | (8,863) |
| Construction | 5.71 | 3.75 | 17.60 | 0.80 |
|
| (427) | (16) | (152,783) | (1,222) |
| Wholesale and retail trade | 16.40 | 18.27 | 13.51 | 12.57 |
|
| (1,226) | (224) | (117,317) | (14,745) |
| Hotels and restaurants | 14.10 | 2.47 | 7.80 | 1.90 |
|
| (1,054) | (26) | (67,742) | (1,287) |
| Transport, storage, and communications | 7.32 | 19.74 | 5.64 | 7.92 |
|
| (547) | (108) | (49,007) | (3,880) |
| Services | 25.13 | 10.64 | 35.36 | 8.34 |
|
| (1,879) | (200) | (306,996) | (25,615) |
| Nonprofit or charity organization | 1.73 | 4.65 | N/A | N/A |
|
| (129) | (6) | N/A | N/A |
| Other | 25.87 | 13.03 | 14.60 | 7.60 |
|
| (1,934) | (252) | (126,801) | (9,635) |
| Total number of observations | (7,476) | (922) | (868,299) | (65,248) |
Note: The share of exporting Australian firms with 1 to 19 employees (6.95 percent) is the average of the shares of exporting Australian firms with 1 to 4 employees (6.8 percent) and 5 to 19 employees (7.1 percent).
Sources: Authors’ calculations based on Facebook, the Organisation for Economic Co-operation and Development, and the World Bank, Future of Business Survey (dataset), accessed November 12, 2018, https://eu.futureofbusinesssurvey.org/; Australian Bureau of Statistics, “Selected Characteristics of Australian Businesses 2016-17,” August 16, 2018, http://www.abs.gov.au/AUSSTATS/[email protected]/DetailsPage/8167.02016-17?OpenD…, data cube 2 (“Business Markets and Competition”); Australian Bureau of Statistics, “Counts of Australian Businesses, Including Entries and Exits, Jun 2013 to Jun 2017,” February 20, 2018, http://www.abs.gov.au/AUSSTATS/[email protected]/DetailsPage/8165.0Jun%202013%20…, data cube 2 (“Businesses by Main State by Industry Class by Employment Size Ranges, June 2016 and June 2017”).
[1] Australian Government, Department of Innovation, Industry, Science, Research and Tertiary Education, Australian Small Business: Key Statistics, December 1, 2012.
[2] Australian Bureau of Statistics, Counts of Australian Businesses, Including Entries and Exits, Jun 2013 to Jun 2017, February 20, 2018; Australian Government, Department of Innovation, Industry, Science, Research and Tertiary Education, Australian Small Business, 20.
[3] US Census Bureau, “Geography Area Series: County Business Patterns by Employment Size Class 2016 Business Patterns,” American Fact-Finder, April 19, 2018, https://factfinder.census.gov/faces/tableservices/jsf/pages/productview…; US Small Business Administration, Office of Advocacy, United States Small Business Profile, 2016; US Small Business Administration, Office of Advocacy, Small Business GDP: Update 2002–2010, January 2012.
[4] World Bank, Small and Medium Enterprises (SMEs) Finance, accessed November 12, 2018, http://www.worldbank.org/en/topic/smefinance.
[5] European Commission, Annual Report on European SME: 2016/2017: Focus on Self-Employment, November 2017, 11–12.
[6] The US International Trade Commission reports that US exporting SMBs have more than twice the total revenue, greater revenue growth, and 70 percent greater labor productivity than their nonexporting counterparts. See International Trade Commission, Small and Medium-Sized Enterprises: Characteristics and Performance, November 2010; Tim Harcourt, Why Australia Needs Exports: The Economic Case for Exporting (Sydney: Australian Trade Commission, 2000); Andrew B. Bernard and J. Bradford Jensen, “Exceptional Exporter Performance: Cause, Effect, or Both?” Journal of International Economics 47 (1999): 1–25; Bee Yan Aw, Sukkyun Chung, and Mark J. Roberts, “Productivity and Turnover in the Export Market: Micro-Level Evidence from the Republic of Korea and Taiwan (China),” World Bank Economic Review 14, no. 1 (2000): 65–90; Andrew B. Bernard and Joachim Wagner, “Exports and Success in German Manufacturing,” Weltwirtschaftliches Archiv 133, no. 1 (1997): 134–57; Joachim Wagner, “Exports and Productivity: A Survey of the Evidence from Firm‐Level Data,” World Economy 30, no. 1 (2007): 60–82; Ana Teresa Tavares-Lehmann and Diana Alexandra Gonçalves Costa, “Performance Differences between Exporters and Non-Exporters: The Case of Portugal” (FEP Working Paper No. 569, University of Porto, Porto, Portugal, December 2015); Julio E. Revilla, Productivity Unplugged: The Challenges of Malaysia’s Transition into a High-Income Country (Washington, DC: World Bank Group, June 2018).
[7] Bernard and Jensen, “Exceptional Exporter Performance.”
[8] David Atkin, Amit K. Khandelwal, and Adam Osman, “Exporting and Firm Performance: Evidence from a Randomized Experiment,” Quarterly Journal of Economics 132, no. 2 (2017): 551–615; Bernard and Jensen, “Exceptional Exporter Performance.”
[9] For a complete list, see Australian Government, Department of Foreign Affairs and Trade, “Australia’s Free Trade Agreements,” accessed November 12, 2018, https://dfat.gov.au/trade/agreements/Pages/trade-agreements.aspx.
[10] Sónia Araújo and Eric Gonnard, “Selling to Foreign Markets: A Portrait of OECD Exporters” (Statistics Brief No. 16, Organisation for Economic Co-operation and Development, Paris, February 2011).
[11] The overall share of firms that export is less than 10 percent. That figure jumps to roughly 40 to 60 percent for firms with over 250 employees, and drops to 10 to 20 percent for firms with 10 to 49 employees (and is even less for firms with fewer than 10 employees).
[12] World Trade Report 2016: Levelling the Trading Field for SMEs (Geneva, Switzerland: World Trade Organization, 2016); “Small and Medium-Sized Enterprises and Decent and Productive Employment Creation” (Report IV, International Labor Office, Geneva, Switzerland, 2015); Uri Dadush et al., What Companies Want from the World Trading System (Geneva, Switzerland: World Economic Forum, 2015); International Trade Commission, Small and Medium-Sized Enterprises: U.S. and EU Export Activities, and Barriers and Opportunities Experienced by U.S. Firms, July 2010.
[13] Andreas Lendle, Marcelo Olarreaga, Simon Schropp, and Pierre-Louis Vézina, “eBay’s anatomy,” Economics Letters 121, no. 1 (2013): 115–20.
[14] Andreas Lendle, Marcelo Olarreaga, Simon Schropp, and Pierre-Louis Vézina, “There Goes Gravity: eBay and the Death of Distance,” Econ Journal 126, no. 591 (2016): 406–41.
[15] Democratizing Globalization: How Small Businesses across America Are Growing in the Digital Marketplace (San Jose, CA: PayPal Government Relations).
[16] William A. Ward, “Globalization and Its Implications: The Size and Location of Manufacturing Sector Export Firms in SC” (CUCIT Working Paper No. 0001115, Clemson University, Clemson, SC, November 2000).
[17] Facebook Investor Relations, “Facebook Reports Second Quarter 2018 Results,” news release, July 25, 2018, https://investor.fb.com/investor-news/press-release-details/2018/Facebo….
[18] Rural areas are defined as those with fewer than 50,000 people and not in an urban area—as defined by the US Census Bureau—coastal and noncoastal.
[19] James Anderson, “A Theoretical Foundation of the Gravity Model,” American Economic Review 69, no. 1 (1979): 106–11; James E. Rauch, “Networks versus Markets in International Trade,” Journal of International Economics 48, no. 1 (1999), 7–35; Treb Allen, “Information Frictions in Trade,” Econometrica 82, no. 6 (2014): 2041–83. Using meta-analysis of 103 empirical papers, Anne-Célia Disdier and Keith Head reported that that the average elasticity of trade with respect to distance was −0.9. See Anne-Célia Disdier and Keith Head, “The Puzzling Persistence of the Distance Effect on Bilateral Trade,” Review of Economics and Statistics 90, no. 1 (2008): 37–48.
[20] William F. Lincoln and Andrew H. McCallum, “The Rise of Exporting by U.S. Firms” (International Finance Discussion Papers No. 1157, Board of Governors of the Federal Reserve System, Washington, DC, January 2016).
[21] Michael Bailey et al., “Measuring Social Connectedness” (NBER Working Paper No. 23608, National Bureau of Economic Research, Cambridge, MA, July 2017).
[22] “Fostering Greater SME Participation in a Globally Integrated Economy” in SME Ministerial Conference (Mexico City, Organisation for Economic Co-operation and Development, February 22–23, 2018); Trade Obstacles to SME Participation in Trade (Geneva, Switzerland: World Trade Organization, 2016).
[23] Mary Lou Egan and Ashoka Mody found that buyers undergo a costly search process for potential suppliers from within a product-specific network for both final and intermediate goods. Importers gather information about suppliers at trade fairs and conferences or direct visits to factories (once a buyer knows about the company). See Mary Lou Egan and Ashoka Mody, “Buyer-Seller Links in Export Development,” World Development 20, no. 3 (1992): 321–34. Bernard and Jensen explore entry costs from an exporter’s point of view and find that exporting today increases the probability of exporting tomorrow by 36 percent. In other words, they also find past exporters are apt to reenter. (They also find state export promotion expenditures have no significant effect on the probability of exporting.) See Andrew B. Bernard and J. Bradford Jensen, “Why Some Firms Export,” Review of Economics and Statistics 86, no. 2 (2004): 561–69.
[24] Audrey Gilmore, David Carson, and Ken Grant, “SME Marketing in Practice,” Marketing Intelligence & Planning 19, no. 1 (2001): 6–11.
[25] First Quarter 2018 Results Conference Call (Menlo Park, CA: Facebook, April 25, 2018), https://s21.q4cdn.com/399680738/files/doc_financials/2018/Q1/Q1-18-earn…; Financing and Women-Owned Small Businesses: The Role of Size, Age, and Industry (Menlo Park, CA: Facebook, March 2018).
[26] Respondents were asked whether they were an exporter, importer, both, or neither. The share of exporters combines those that only export as well as those that export and import. These data represent the aggregate responses over the three years.
[27] Facebook asks, “What are the most important challenges your business currently faces?” Firms may select however many challenges are applicable. Over the three years, the list of challenges included 13 options, as well as an “other” option (in which firms must expand upon this response).
[28] Facebook asks, “You said that ‘selling to foreign markets’ is a challenge for your business. What particular challenges does this include?” Firms may select however many challenges are applicable. Over the three years, the options did not change, remaining 10 choices, as well as an “other” option (in which firms must expand upon this response).
[29] See Appendix A for the detailed data description as well as the concordance between the Facebook data and the Australian Bureau of Statistics data.
[30] See Appendix B for the change in descriptive statistics once the small firms are excluded from the two datasets. It also contains the number of observations for the share of firms that export by each size and industry category.
Related Content
- | Antitrust and Competition Antitrust and Competition
- | Expert Commentary Expert Commentary
Are Google and Facebook Monopolies?

- | International Freedom and Trade International Freedom and Trade
- | Expert Commentary Expert Commentary
Globalization Isn't Killing Factory Jobs: Trade Is Actually Why Manufacturing Is up 40%
- | Financial Markets Financial Markets
- | Expert Commentary Expert Commentary
What Australia Can Teach Us About Regulatory Hoarding
- | Technology and Innovation Technology and Innovation
- | Expert Commentary Expert Commentary

