The Economy at Halftime
We are at the year’s midpoint, a good time to assess 2019’s first five months. In short, the US economic outlook is positive but with a heavy dose of uncertainty. The unemployment rate is low, wages are rising a bit, and GDP growth is hitting some strong marks, but US policy battles over trade, deficits, immigration, and foreign affairs offer heavy doses of uncertainty. We now know that GDP growth for 2018 fell from a quarterly high point of more than 4.0 percent in the second quarter, what some termed a Goldilocks economy, to 2.2 percent in the fourth quarter. Following a series of year-end shocks—government shutdown, interest rate increases, and accelerating trade disputes—what had been a fast growth economy was trembling. However, the first GDP growth estimate for 2019’s first quarter arrived showing a handsome 3.2 percent. But policy uncertainty raised its ugly head again when, in early May, US trade negotiations with China fell apart, equity markets swooned, and investors shifted from equities to cash.
Later in May, weakness in industrial production and other national data led some forecasters to offer pale second-quarter GDP growth estimates. For example, retail sales fell in April, as did the Federal Reserve’s (Fed’s) industrial production index for the third time in recent months. Along with these weaker data came a pessimistic assessment of the outlook for the US freight market. These and other data led the New York Fed’s May 24th NowCasting report to list second-quarter GDP growth at 1.41 percent. On that same day, the Atlanta Fed’s GDPNow estimate came in at 1.3 percent.
This brings us back to the question raised in the March Economic Situation report: will 2018’s Goldilocks economy return, or are things going to weaken further? I am not sure about Goldilocks, but I think it is safe to say that 2019’s growth will come in close to 2018’s 2.9 percent level. With all its ups and downs, I am expecting 2019’s GDP growth to register at 2.8 percent.
In this report, I focus again on growing protectionism, trade wars, and their effects on US prosperity. I then turn to the elephant in the room—the US deficit, our growing indebtedness, and the rapidly expanding cost of servicing the debt. In that section, I offer a “what if” scenario involving interest rate increases, just to show how tough it may become to maintain all of America’s growing government services while also building more debt. In the part that follows, borrowing a powerfully useful chart from American Enterprise Institute economist Mark J. Perry, I delve into what has happened to consumer prices for broad categories of goods and services. Here, the beneficial effects of international competition are seen in a powerfully positive way. I then return to a favorite theme and discuss American capitalism, changing attitudes regarding it, and what might be the prospects for the capitalist goose that lays the golden eggs. The report then turns the state spotlight on Missouri and that state’s economic prospects. A visit to Yandle’s reading table concludes the report.
Trade Wars, Tariffs, Taxes, and Prosperity
In what may come to be seen as a strange revolution in how the nation taxes its citizens, the Trump administration is gradually shifting the US tax burden from income and profit to consumption. Personal and corporate income taxes have been cut, and tariffs have been placed on consumer and producer goods. This has been done without any congressional debate and without the White House ever mentioning the fact that America now has a growing tariff-based national sales tax.
Indeed, sometimes President Trump’s mention of tariffs makes it sound as though they aren’t really paid by ordinary Americans like you and me. They just sort of get paid somehow. But we know that only people pay taxes, one way or another. For example, in late November, the president tweeted, “Billions of Dollars are pouring into the coffers of the U.S.A. because of the Tariffs being charged to China, and there is a long way to go. If companies don’t want to pay Tariffs, build in the U.S.A. Otherwise, let’s just make our Country richer than ever before!”
Billions? Richer? In some cases, the new border tax is shifted directly to consumer goods—washing machines from Korea, for example. In other instances, the tax may be shifted forward, partly or totally, by producers of products that use foreign goods. Tariffs are now applied to Canadian timber products, Chinese solar panels, aluminum, steel, and, with new increases in the works, more than $300 billion of Chinese goods that range from bicycles to baseball gloves.
The most recent data on federal government current receipts and expenditures tell us how this is playing out. Personal taxes fell from $1.648 trillion in 2017’s fourth quarter to $1.633 trillion in Q4 2018, a reduction of $15 billion—not much change. But we must remember: 43 percent of Americans pay no income taxes. Corporate income taxes fell to $161 billion in Q4 2018 from $264 billion in Q4 2017, down $103 billion. Now we are talking real money.
Looking at tariffs or what are termed custom duties, $72.3 billion was collected in Q4 2018, compared with $40 billion in Q4 2017, for a gain of $32 billion. Most likely, not all the $72.3 billion was passed forward to consumers. In some cases, competitive forces required foreign and domestic producers to absorb some, if not all, of the tariff, in which case investors and workers carried the burden. We can be sure that someone paid it. It didn’t come down as manna from heaven!
In all, then, tariff payments increased $32 billion in Q4 2018 as compared to Q4 2017. Income taxes were down $118 billion. Yes, at the margin, the nation moved from taxing income to taxing consumption. Will the shift continue? From the way things look, tariff revenues will rise again.
Here We Go Again
After raising the price US consumers pay for foreign-produced aluminum, steel, lumber, automotive parts, dairy products, and a host of Chinese goods, in April, President Trump, the self-proclaimed tariff man, rode again. This time European goods were targeted. Mr. Trump was inspired by a 2018 World Trade Organization ruling in a US-brought complaint involving Boeing- and Airbus-produced planes.
The complaint, which was filed 14 years ago under World Trade Organization procedures, claimed that the Europeans, like Santa Claus for adults, were subsidizing world consumption of Airbus aircraft. But instead of rising up and calling their name blessed for their generosity, Mr. Trump, in a strange “I’ll show them” moment, now indicates that the US will get even by penalizing American consumers. In a tweet supporting the new tariffs, Mr. Trump indicated that “the EU has taken advantage of the US on trade for many years.”
If providing cheaper aircraft and other goods is taking advantage, maybe we need more, not less of it. Now that we are being rescued by the Trump administration, we will pay more for European helicopters, textiles, olives, jelly, jam, cutlery, cheese, and more, and all the while—owing to the untimely death of the Airbus Santa Claus—we will be paying more for European-built aircraft.
Can This Somehow Be a New Road to Prosperity?
And how did the European politicians respond? Oddly enough, they responded in kind. They said “If you, Mr. Trump, penalize your supporters when they buy our goods, we’ll put a bite on our voters when they buy American goods.” In a strange game of “I can do anything better than you,” politicians on both sides of the pond have found a way to quietly impoverish their own people by placing taxes called tariffs on bundles of consumer goods. But let us not get carried away. After all, relative to the world or even the US or EU economies, the tariffs in question are small potatoes. That said, it is still the case that the cumulative effect of tariffs, no matter how small, is always a step taken away from prosperity.
All of this tit-for-tat tariff targeting is taking place at a time when the United States is engaged in serious trade talks with China as well as with the European Union on other issues, and when a renegotiated North American Free Trade Agreement awaits congressional approval. Meanwhile, word from the International Monetary Fund tells us that—little wonder—the world’s economic pulse is slowing. Obviously, sleepwalking economies do not provide the best situations for opening wider doors to world competition. Indeed, the common response is just the reverse. With jobs threatened by foreign-produced goods, as the argument goes, this is the time to close the doors even more, which will, in turn, reduce even further the pace of economic growth.
In the long run, prosperity hangs in the balance. In the short run, politicians will try to get even by imposing high costs on their voters, somehow justifying their actions by way of bumper-sticker nationalism.
What about the Effects of All This?
Can we estimate the economic effects of all this? Can we accurately identify the winners and losers?
The effects of trade war ripple across the entire economy in complex ways, through both direct and indirect effects. These make it close to impossible to isolate trade-war impacts. Then, there are other things going on that confound the problem. Along with trade wars are Fed interest rate changes, a threatened and then real government shutdown, Brexit, Iran and Venezuela sanctions, and oscillations of the world economy, just to mention a few. Still, it may be possible to examine economic pictures, get a feel for what may be happening, and form sharper questions about winners and losers. We may be able to infer some effects by examining state leading indicator maps produced by the Federal Reserve Bank of Philadelphia.
The monthly maps are based on statistical treatment of a multitude of variables that include employment, average hours worked in manufacturing, the unemployment rate, housing permits, unemployment insurance claims, interest rates, and a few more variables. The indicators look six months out and offer a forecast of future prospects.
In figure 1, I provide an outline map for May 2018, the month the steel and aluminum tariffs took effect. I call attention to the prevalence of the dark green, predicted high-growth states. These include heavy manufacturing states (e.g., North Carolina, Ohio, Pennsylvania, and South Carolina). The dark green hue also shows up for West Virginia and many of the western hard-grain states. There are also two slow-growth states, Kentucky and Maine, and no negative growth states. Just next to the May 2018 map, I provide the March 2019 map, which is the most recent one produced by the Philadelphia Fed. Notice how things have changed: Kansas, Michigan, and Minnesota have turned pink, meaning negative future growth, and Wisconsin has fallen into the near negative growth range.
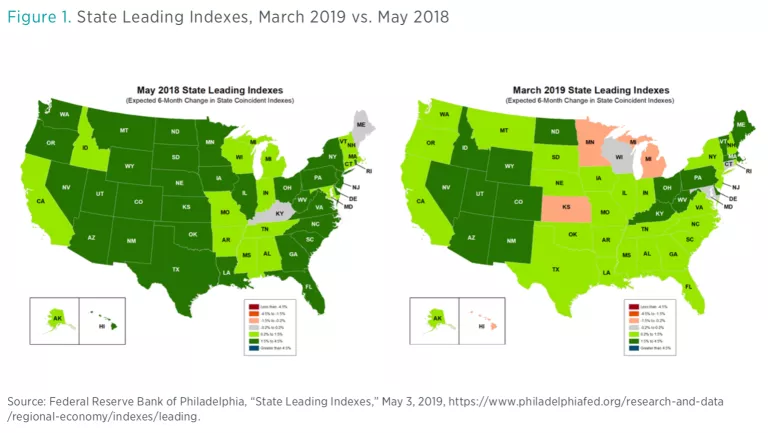
There can be little doubt that the prospects for the US economy have weakened since May 2018. We cannot determine if the weaker picture is caused by trade wars, Fed interest rate movements, a pending government shutdown, a slowing world economy, or some combination of these forces. But neither can we reject the hypothesis that trade wars are one of the forces that have eroded the prospects of people across a large number of the 50 states.
Yes, the US economy is on a roll, but the direction is flat to mildly downhill. We will see what the next series of charts tells us. Perhaps the trade negotiators will successfully take some rocks out of our harbors.
Deficits, Debt, and Interest Costs
Almost inevitably, it seems, the last question I receive after giving an economic outlook presentation is about the deficit. Why is it the last question? I sometimes wonder. Perhaps it’s the same reason the issue seemed to be on the back burner this past election season.
Maybe it’s because the size of the federal deficit has little bearing on next year’s GDP growth or unemployment rate. After all, people attending outlook conferences are especially interested in the near term. Or perhaps it’s because President Trump’s trade war and migration battles, generally raised early in Q&A sessions, can have immediate effects on local manufacturing and agricultural operations.
But maybe, just maybe, it’s because most people think the deficit doesn’t really matter. This in spite of the fact that in 2018, according to the US Department of the Treasury’s public debt reckoning, we will see “the highest annual debt issuance since $1.586 trillion in 2010, when the U.S. economy was still crawling out of a recession.” But let’s face it, we have been hearing about growing deficits and debt most of our lives, and so far, nothing serious seems to have happened.
Soon, however, we may not be able to pay interest on the debt.
Whatever the reason for our benign neglect, the now-rapidly-growing deficit does matter—and the interest cost of the debt is why it matters. It’s one thing to run in the red. It’s something else entirely to lack the wherewithal to make interest payments, and that’s where we may be heading.
According to the Congressional Budget Office’s January 2019 report, the big five spending categories for federal government outlays for 2018 were as follows: Social Security benefits: $982 billion; Medicare: $704 billion; military: $622 billion; Medicaid: $389 billion; and net interest on the public debt: $325 billion. Of the big five, interest payments have grown the fastest, rising 19.2 percent in 2018. Each of the other categories is up by less than 10 percent over the same period.
Now let’s play some number games. Assume that all the big five expenditures except for interest costs are held constant. Then suppose the average interest rate paid by the US treasury for all debt outstanding rises from the 2018 level of 2.45 percent to the December 2008 level of 3.20 percent. Put another way, what if the interest rate on the debt rose by 30 percent?
If so, America’s debt interest costs would rise from $343 billion to $422 billion, which is creeping up on current defense spending. To finance this higher interest cost, we’d either have to make painful cuts to all the other categories—in the big five and beyond—or borrow even more, which would of course mean more total debt and even more interest costs. That’s not a solution at all.
A quick scan of the possibilities puts us face to face with the tough—if not impossible—political challenges. Social Security cuts? No way. Medicare? Come on, give me a break. Medicaid? Not in your lifetime. Defense? Wait a minute, we just started building it back up. Somewhere else in government? EPA, the big one? Not a lot of wiggling room here.
The solution? Start cutting the growth of spending now. The economy is booming. Now’s the time to get serious about controlling the deficit.
Rising Costs, Global Competition, and the Chart of the Century
American Enterprise Institute economist Mark J. Perry is justifiably respected for his ability to convey complicated economic relationships by way of rather simple charts and graphs. The most famous example of this, shown here, is called by some the “chart of the century” (see figure 2). Perry’s most recent version reports price increases from 1998 through 2018 for 14 categories of goods and services, along with the average wage and overall Consumer Price Index.

Overall, the result we see is astounding. In a word, the price increases shown for hospital services, college textbooks, and college tuition are startling. In a similar way, the zero price increases, or even decreases, reported for cars, household furnishings, and clothing are comforting.
Inspection of the chart raises several observations. First off, the chart’s underlying data suggest that activities heavily affected by government rules and subsidies are prone to be less efficient and therefore more costly. Hospital services, medical care, and housing seem to fall into this category. A second consideration suggests that international competition matters a lot and that services, as well as home building, are almost immune to global competition. This logic offers an explanation for the taming of costs for TV sets, toys, cell phone service—which includes the phone itself—clothing, cars, and household furnishings.
But the exploding costs associated with college tuition and textbooks raise other questions. Yes, there is a lot of government regulation and public-sector ownership that affects college operations. And yes, there is an absence of meaningful international competition in the higher education marketplace. But what about textbooks? What may be happening here?
Perhaps, just perhaps, these two higher education items are plagued by a third consideration that could also affect each of the other 12 consumption categories. Tracking cost changes across time requires the analyst to adjust for changes that take place in the good or service being followed, and this is a monumental challenge for Bureau of Labor Statistics analysts who maintain the chart’s underlying data.
Just what is included in 1998 college tuition? Is it the same in 2018? What about expanded computer centers, 24-hour, 7-days-a-week, information services (libraries!), advanced technology, physics and manufacturing labs, and what about the skills of faculty required to teach and guide research? Textbooks? Do they include complete online instruction capabilities? CDs with self-contained lectures?
Of course, one can raise similar questions about hospital services. It could well be that higher costs are driven partly by a fourth consideration: When someone else pays the cost and there is little accountability between who pays and who benefits, then suppliers respond by providing what they think is most important. This implies that healthcare, higher education, textbooks, and childcare services are especially vulnerable.
Recapping these thoughts, I find myself thankful for international competition and hope that we American consumers will get more of it. I also hope the future will facilitate more global competition in healthcare services. And finally, I wonder what will happen to the hidden cost of college tuition and textbooks if some leading politicians get their way and college becomes “free.”
The Capitalist Goose That Lays Golden Eggs: Feed It or Kill It?
Can we get capitalism’s golden goose to lay more eggs soon enough to avoid the Washington-planned economy that so many now envision? That appears to be the key question in 2019.
We’re facing a series of related choices between private and public decisions, permitting or breaking up big businesses, and encouraging today’s largely market-based system versus building a future with significantly more federal regulation. In making each choice, we must ask whether our elected officials are really brighter and more ethical, on average, than the people they represent.
Some of those planning a presidential run in 2020, including members of the current Trump administration, are focused on counting the goose eggs and arguing that better policies will bring more of them.
Others seem less concerned about the count but suffer heartburn over who gets the eggs once they are produced; they express loudest concern that so few people get the largest eggs.
Still others just seem to despise the whole dirty business of capitalism’s golden goose. They love golden eggs but hate egg-laying geese, which they associate with people acting primarily out of self-interest, appearing at times to care more about themselves and their loved ones than humanity in general, as the goose haters do.
The goose haters, like a long series of authoritarian dreamers before them, believe that if given the opportunity, they and their colleagues could move all the economic chessmen in more benevolent, less selfish ways. They may even understand that several centuries of history stand opposed to the prospects of their success, but they still believe this time to be different. It’s just a matter of getting the right people in the right places at the right time.
Of course, the cost of running an organization that coordinates the economic and political life of 327 million Americans has to be reckoned with. It doesn’t come free. It’s also possible that the managing apparatus turns out to be so large and elaborate that the production of a meticulously managed economy becomes an obscure and declining curiosity. As the administrative state becomes larger, a time may come when the picture frame becomes more important than the picture itself. When that occurs, it may be wiser to be a frame builder than a picture painter.
In spite of lofty rhetoric, the goose haters—and indeed, all three groups—face a somewhat humble problem. Whether through capitalism, a socialistic bureaucracy, or a communistic regime, the eggs we produce are determined by just two variables: how many people work each day and the tools—mental, physical, mechanical, and digital—that they work with.
Thus, no matter what high-sounding name we assign to the process of organizing economic life, growth in our resources will depend on the growth in the size of the workforce and the productivity of those in it. When we add those two variables together, we have an estimate of GDP growth, the best way we know of to track golden eggs.
This gets us to the US economic situation today. Figure 3, which draws on Fed data, contains annual growth data for the US labor force and labor productivity. The bars are stacked so that we can see how the variables look when they are summed. The chart also contains shaded bars that identify recessions. The unusually tall bars that follow recessionary periods should be disregarded, since productivity is always distortedly high when the economy moves from negative to positive growth.
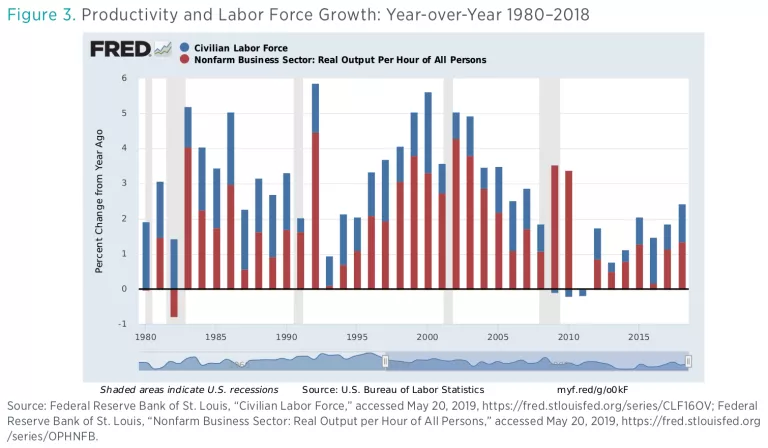
A quick scan identifies the current challenge: recent decades just don’t compare favorably with the 1990s and the first decade of the 2000s. We face slower growth in the working-age population and worker productivity. The baby boomers are retired, immigrants no longer see a US welcome mat, and the expanding dot-com bubble seems to have stalled in the face of taxes and regulation.
Given the lay of the land, even with some regulatory and tax relief taking place, expanding the count of golden eggs will be difficult. Changing the rules of the game to require government provision of healthcare, free education, wealth taxes, corporate breakups, and more and larger government agencies is not likely to help, at least if past experience is any indication. We must remember that government bureaucrats armed with command-and-control regulation do not launch golden eggs. Also, when things seem to be free, lots of people will line up and demand access. The resulting necessary rationing will require a larger bureaucracy, and that will further reduce the production of golden eggs.
The current experience in Venezuela, the longer test in Cuba and North Korea, and China’s dramatic move toward prosperity by abandoning communism for a mix of markets and socialism tell us there is simply no good substitute for individual freedom.
But does this mean that we live in the best of all possible worlds? Not at all. If there’s a way to ramp production back up on those golden eggs, it means finding ways to unrig the system where it has been rigged by special-interest interaction with politics, to decentralize decisions so that accountability is more visible and accessible, and to avoid empowering politicians and their appointees to pick winners and monopolize markets.
And we should always remember that the economic picture is more important than the décor on the frame that holds it.
Missouri in the State Spotlight
Patrick A. McLaughlin, Stephen Strosko
Each quarter, we select one state and assess that state’s economic outlook and health. Last quarter, we put Hawaii in the spotlight. In previous quarters, we have examined Colorado, Illinois, Kentucky, Michigan, Nebraska, North Carolina, Oregon, and Utah. We focus on Missouri this quarter.
Missouri’s economy shows mixed economic indicators, as it is growing in some areas but is largely stagnant relative to many other states during the country’s postrecession growth. Some of Missouri’s major industries are showing stagnant growth, many of the state’s major metropolitan areas are not performing well, and many leading indicators are painting a gloomy picture. However, Missouri is showing some promising signs with its unemployment rate, fiscal policy, and regulatory state. A good place to start our analysis is by looking at some of Missouri’s largest and most important industries.
Manufacturing is extremely important to Missouri’s economy and represents $39 billion of the state’s GDP. This equates to roughly 13 percent of Missouri’s economy, a larger percentage than the majority of other states. This sector has shown relatively slow growth over the past few years and is projected to continue this slow growth in the near future. The Bureau of Economic Analysis estimates that from 2013 to 2017, Missouri’s manufacturing sector has grown by only 1.3 percent. In addition, employment projections for Missouri’s manufacturing sector are not promising. The Missouri Department of Economic Development estimates that employment growth in Missouri’s manufacturing sector will only increase by 0.5 percent through 2020.
Agriculture, a sector that has been strong in Missouri for a long time, may be starting to fade with the state’s increasing focus on other industries. The agricultural sector in Missouri saw a sharp decline between the years of 2014 and 2015: a drop from a little over $5 billion to barely over $3 billion. The industry has yet to recover. The University of Missouri’s Food & Agricultural Policy Research Institute attributes this decline to an increase in competition, both from within the US and from the international stage. The Federal Reserve Bank of Chicago points out that farmers in the Midwest are struggling to cut costs because of debt, lack of innovation, and the need for machinery from previous overexpansion of operations, among other things.
As of March 2019, Missouri’s unemployment rate sits at 3.3 percent, below the national average that hovers around 3.8 percent. However, as the Show-Me Institute in Missouri points out, the unemployment rate story does not align with the reality of Missouri’s economic performance. The Show-Me Institute points toward labor participation rates as the potential culprit. The institute states, “[Missouri’s] labor force shrunk by almost 30,000 people from 2016 to 2017. In this same period, our neighbor to the southeast, Tennessee, saw a spike in their labor force with 81,000 people joining.”
Missouri sits in the middle of the 50 states with a per capita income of $43,444 and an average cost of living, ranking 24th and 25th respectively. Missouri’s fiscal indicators also sit near the middle of the pack but are showing some promising signs. The Mercatus Center’s fiscal rankings mark Missouri as the 15th healthiest state (fiscally), citing the state’s service-level solvency as a strong suit.
Very recent data on the 2017/18 academic year shows that Missouri’s education sector is performing at a high level. For that year, the high school graduation rate in Missouri was 93 percent. However, similar to the previous state of focus, Nebraska, Missouri may have trouble retaining some of that educational success with postsecondary school when those students move into higher education. Only 27.6 percent of Missouri’s population of 25 years or older has a higher education degree. This is below the national average, ranking Missouri 32nd out of the 50 states.
Finally, we will take a quick look at the seven statistical metropolitan areas in Missouri. Policom Corporation recently released a rankings list of 383 metropolitan areas in the United States for 2018. Policom states, “The highest ranked areas have had rapid, consistent growth in both size and quality for an extended period. The lowest ranked areas have been in decline for an extended period.” Missouri’s metropolitan areas rank as the following: St. Joseph (332), Joplin (300), Cape Girardeau (275), Jefferson City (271), Springfield (205), Columbia (105), and Kansas City (58). It is not difficult to see that the majority of the metropolitan areas in Missouri are not ranked highly. The state has just one highly ranked metropolitan area: Kansas City.
Missouri’s Regulatory Outlook
Missouri’s regulations are published online and can be found on the secretary of state’s website. The state’s administrative code spans approximately 22 different titles and is generally organized around the different departments found in the state government. The 2017 edition of Missouri’s regulatory code contained over 7.5 million words as counted by the RegData project at the Mercatus Center. Reading at a rate of 300 words per minute during a 40-hour work week, it would take an individual more than 10 weeks to read Missouri’s entire code.
Out of the 37 state codes that have been analyzed by the Mercatus Center, Missouri has the 24th-largest code by restriction count. Regulatory restrictions, as defined by the RegData project at the Mercatus Center, are terms that are legal and binding in nature. These terms are shall, must, may not, prohibited, and required. Missouri had 113,112 regulatory restrictions as of 2017 in its regulatory code.
The Department of Natural Resources is the largest regulator in the state. The department is responsible for 24,370 regulatory restrictions, 4,000 more than the second-largest regulator, the Department of Insurance, Financial Institutions, and Professional Registration. The most regulated industry in Missouri’s code is the utilities industry (North American Industry Classification System [NAICS] code 221). This NAICS subsector includes both the infrastructure and the services provided by utility companies. Every state is also affected by federal regulations. This effect can vary from state to state based on the mixture of industries in each state’s economy. The Mercatus Center’s FRASE Index ranks the degree to which a state’s economy is affected by federal regulations. The FRASE Index ranks Missouri as experiencing the 28th-lowest impact of federal regulations out of all 50 states and the District of Columbia.
Conclusion
Missouri’s regulatory environment is relatively healthy compared to many other states and is also less affected by federal regulations than many other states. However, many economic variables paint a picture of a state that is currently struggling. Sadly, the future may not be any brighter. Leading economic indexes paint a poor picture for Missouri as we approach the halfway mark of the 2019 calendar year. The leading indicator published by the Philadelphia Federal Reserve Bank predicts the success of a state’s economy over the next six months. Missouri’s February 2019 indicator is 0.28, well below average, and also the state’s lowest score since June 2009. The New Economy Index produced by the Information Technology and Innovation Foundation provides a broader assessment. Its most recent report shows that Missouri ranks 28th out of all of the states with respect to knowledge jobs, economic dynamism, globalization, digital economy, and innovation capacity. Hopefully, Missouri can prove these indexes wrong in the near future.
Yandle’s Reading Table
Some well-written books gain our favor because they inspire us to think new thoughts; others help fill some of the deep and wide crevasses of ignorance we face on particular topics; still others are just entertaining; and then there are those that do all this and do so in a relatively small number of pages. Tom Standage’s A History of the World in 6 Glasses (New York: Walker & Co., 2005) falls into this happy final category. As noted, the book, which has been around for a while, made it into my hands when my daughter passed along some volumes she was culling from her library. What a delightful read!
The book is based on an undebatable truth. Human beings cannot live long without water. But then there is a corollary. Access to safe drinking water hasn’t always been easy. In fact, for most of human history and still in many places today, potable water is scarce and dear. Given the situation, humans flourished when they found ways to make water safe. Beer, discovered by Stone Age people, was the first remedy, Standage explains. Wine, the second, is followed by spirits. Done with alcohol, the author introduces coffee, which made an inroad as a way to sober up drunks; tea; and finally, Coca-Cola. Yes, the story is told with six glasses.
As one who favors beer, I was fascinated to learn that beer was produced accidentally, perhaps as early as 10,000 BCE, when those distant ancestors of ours foraged and stored naturally grown wheat and barley and did so by mixing crushed grain with water to form a gruel. When stored for a while, a fermentation process developed. Ergo, the gruel produced beer! Standage shows a Sumerian pictogram from around 4,000 BCE of two men sipping beer from a huge urn and doing so with straws! From the pictogram, historians infer that sipping or drinking beer from the same vessel became the basis of important social interactions that signaled trust, sharing, and good feelings. The author suggests that the “clinking of glasses symbolically reunites the glasses into a single vessel of shared liquid, [which are] traditions of very ancient origins.” As might be expected, anything that intoxicates tended to become included in activities associated with the supernatural, and this led to the belief, perhaps shared by many today, the beer was a gift of the gods. So, two problems were solved. Water was made safe for drinking, and belief in the supernatural was enhanced. Standage devotes 29 pages to beer, so there’s a lot to enjoy.
Standage introduces wine, his second cup, by relating a story about King Ashurnasirpal II’s 870 BCE inauguration of a new capital at Nimrod, Assyria. It was a fabulous affair with feasting that went on for 10 days. According to historic records, the celebration was attended by 69,574 people, which included 5,000 foreign dignitaries. Serving 1,000 fatted cows, 10,000 sheep, 500 gazelles, and 20,000 doves, the king, significantly, did not serve beer at the main feast, the beverage of choice. He served wine, which was rare, costly, and symbolic of regal power. Referred to as beer of the mountains, it was also safe. The discussion goes on for almost 50 pages.
I will leave it to you, dear reader, to discover the delightful tidbits of knowledge—and joy—contained in the author’s account of spirits, coffee, tea, and Coca-Cola. And I assure you that you will enjoy the read and will wish that you had read the book sooner.
Few living life scientists are held in such high esteem as Edward O. Wilson, the long-lived Harvard-based biologist. In addition to being recognized as founder of sociobiology and as a leading expert on ants, Wilson is the winner for two Pulitzer Prizes for earlier books. His latest book, Genesis: The Deep Origin of Societies (New York: Liveright Publishing, 2019) focuses on the same question that motivated Adam Smith to write in 1759 The Theory of Moral Sentiments and a host of other writers as well. Both Wilson and Smith and many scholars in between have faced a profound human behavior puzzle: Why do human beings systematically engage in what appears to be altruistic, unselfish behavior? For Wilson, however, the question has three related parts that have to be addressed: What are we? Who or what created us? And what do we ultimately wish to become? The short book—it has just 140 pages, including references—contains seven chapters and a prologue. Obviously, these three existential questions cannot be fully addressed in so few pages. It is at the very beginning that Wilson offers an answer to the puzzle. Here I will quote from page 10: “The answer is tribalism, and I will show, tribalism is one consequence of the way humanity originated. Each of the organized or otherwise public religions as well as scores of religion-like ideologies defines a tribe, a tightly knit group of people joined by a story.” As Wilson seeks to explain in the pages that follow, tribalism is the source of altruism, while religions seek to provide answers to the other questions regarding what we are and who or what created us.
To give a feel for the book, I turn to chapter 7, “The Human Story.” At the outset, the author’s summary of species disappearance will shake those who worry about modern-day species loss—not that we should not be concerned. As Wilson traces the rise of the human species, he points out that roughly a half billion large animal species have lived and disappeared over the course of a hundred million years. But only “one of these many species reached the human level of intelligence and social organization.” And once that well-equipped species emerged, all bets were off for future dominance. The location was in eastern or southern Africa. The time was 300,000 to 200,000 years ago.
As Wilson sees it, the rise to dominance of our homo sapiens ancestors was accommodated by two key events or transitions. The first was a gradual change in diet that led families of small groups to move from heavily forested areas to savannas and planes. This then triggered the second transition, which came when lightning-induced fires caused widespread burning and the accidental “cooking” of larger animals. This in turn led to a change in diet as well as homelike activity that involved food preparation for families and groups and therefore enhanced tribal activity and eventually storytelling. Meanwhile, the meat diet fed brain growth and contributed to further species superiority.
The story continues as the author explains how tribal survival required cooperation and reduced roles for individualistic behavior. What seems like altruism within the tribe supported sustained life and enabled battles and wars to take place across competing tribes. Along the way, as suggested by others, witchcraft, belief in supernatural forces, and religion further reinforced community life that could expand beyond kinship. (On this, see Nicholas Wade, The Faith Instinct: How Religion Evolved and Why It Endures [New York: Penguin Books, 2007].)
As evidenced by his two Pulitzers, Edward Wilson is a masterful writer. His short book should be a perfect selection of book club discussion or for this summer’s trip to Yellowstone, the Outer Banks, or any other favorite retreat—even your own backyard.
David Goodhart’s The Road to Somewhere (London: Hurst Publishers, 2017) is another short book well worth reading. The title derives from Goodhart’s division of politically active citizens into two categories. These are citizens in the UK, where he is based, those in the United States, and those in Europe. People who relate first to the county, town, city, or even zip code where they live are “somewheres.” Those who see themselves as citizens of the world—what we once called jetsetters—are termed “everywheres.” The everywheres are better educated, more highly skilled, wealthier, more mobile, and more liberal. They are suspicious of the intelligence of those who cling to religion-based habits of the heart and likely to be supportive of government programs that help to compensate the somewheres for their unfortunate disadvantage.
The everywheres also tend to have a warmer appreciation of recently arrived citizens, be they temporary or otherwise, especially those who are fellow workers in high-tech industries. The somewheres, on the other hand, are resentful of government programs that tend to erode participation in their traditional customs and culture and are also concerned about the marked decline of small towns and rural areas, which they blame partly on the successful political lobbying of everywheres.
Out of Goodhart’s two-part political brew comes surging nationalism and populist revolt. In the UK, the somewheres support Brexit with the hope that their country will become the place they knew and loved in their youth. As he sees things, the everywheres just as strongly support strengthening the bridges that link the UK to the EU and the world. In the United States, the somewheres are seen as Trump supporters who hope to see their rural areas flourishing again. The everywheres, just as enthusiastically, wish that the somewheres would become more sophisticated, like them, and better prepared to engage an inevitable global destiny.
While Goodhart makes it clear that he should be identified as an everywhere, he indicates deep sympathy for the position taken by the somewheres. He sees them as perhaps taking a morally superior position that reflects a deeper wisdom regarding life’s necessary bedrock.
Is there a road to somewhere that might be embraced by politicians who hope to win a majority vote that includes both groups? That question motivates the book. According to the author, the answer is yes. I will leave it to the reader to discover the details.

