- | Government Spending Government Spending
- | Policy Briefs Policy Briefs
- |
The Economic Situation, March 2013
There was only one lane open as I made my trip to Atlanta; the other three were blocked with those unhappy yellow and black make-believe barrels used by the highway folks. Traffic flow was constrained by efforts to repair potholes and broken pavement. We in the slow lane had little choice in the matter. Instead of 70, we were slowed to 20 miles per hour. We had to accept our fate, or find another route at the next exit.
GDP: Slow Growth Ahead
Caution: three lanes closed
There was only one lane open as I made my trip to Atlanta; the other three were blocked with those unhappy yellow and black make-believe barrels used by the highway folks. Traffic flow was constrained by efforts to repair potholes and broken pavement. We in the slow lane had little choice in the matter. Instead of 70, we were slowed to 20 miles per hour. We had to accept our fate, or find another route at the next exit.
We live in a pothole economy. GDP growth is suppressed, deliberately. There are occasional runs and places where full speed is attained for brief periods, but the yellow and black barrels are all around us. And there are some definite bright spots to be observed on distant landscapes, if only we can route ourselves in their direction. But the potholes are slowing us down.
We see their images in forecasts for 2013 real GDP growth: Congressional Budget Office, 1.7 percent; World Bank, 1.9 percent; Wells Fargo, 1.7 percent; the Conference Board, 1.3 percent. The year is predicted to be slower and bumpier than 2012. Happily, 2014 is generally predicted to be better, but the variation around forecasts is large. As time passes, average GDP growth nationwide will show improvement and some parts of the economy will warm up considerably, as will a few prosperity pockets across the nation.
Deliberately suppressed growth?
But I said deliberately suppressed growth. By whom? And why?
I make my judgment on the basis of indirect evidence. Interest payments constraints on the federal debt form the critical piece. At present, the average interest cost on the $16.4 trillion US public debt is 2.037 percent or about $388 billion per year. If the cost jumped to 5 percent, the annual interest cost would rise to $820 billion. If 7 percent, then $1.1 trillion. To give some perspective, consider this: The total 2012 federal budget is estimated to be $4.7 trillion. In 2012 we expect to spend $710 billion on national defense and $2.473 trillion on human resources—Medicaid, Medicare, Social Security and Veterans Benefits. When these expenditures are combined with significantly higher interest costs, the fat lady will clear her throat to sing. We would be close to broke. By the way, here’s another “gee whiz” number. An increase in debt-interest cost of just one percentage point, from 2.037 percent to 3.037 percent, would generate additional costs about equal to the 2012 cost of fighting wars in Afghanistan and Iraq.
But what does this have to do with suppressed GDP growth? There’s another puzzle piece to consider.
If the banking system opened the lending valves, then some interest-based credit market rationing would follow. If loans increased rapidly, then inflation would follow. Credit rationing and higher inflation would translate into higher interest rates. And how much lending capacity is there?
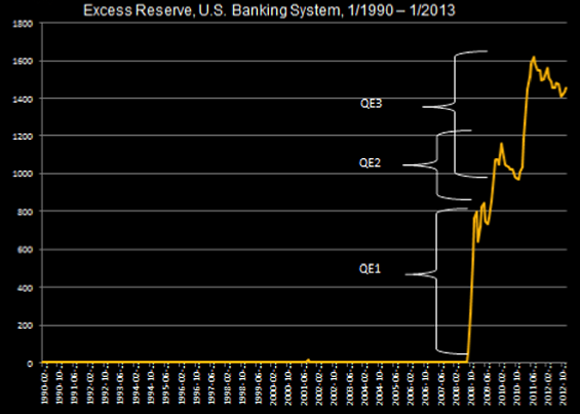
The accompanying chart shows the current level of banking system excess reserves and relates them to the three steps taken by way of quantitative easing. As indicated by the decline from peaks, those easing steps have produced economic activity, but vast amounts of the funds are still held in reserve. These are funds that could be converted into loans, if only the regulators would ease up.
And that’s the point. GDP growth is being suppressed by bank regulators who maintain a tight grip on lending. If price is not allowed to ration, regulations must. As I see it, the outcome is about avoiding a massive budget train wreck that would occur if interest rates were to rise significantly. I am not suggesting that the bank regulators organized all this. But it is still happening as a result of deliberate action. It is a spontaneous order. This brings us to the deficit, the source of growing federal debt, and the interest-cost problem. What are the prospects for reducing the deficit? And how?
Deficits: Another Way Out
Why not grow our way out of the deficit problem?
Robert Arial’s cartoon captures the essence of the two-sided continuing deficit debate. The political song has just two themes: one is about cutting expenditures. The other is about raising taxes. And the song has no harmony.
It’s as if there is a fixed pie, a zero-sum game. If the spending cut guys win, then the tax increasers lose. Oddly enough, our political leaders are silent with regard to addressing the problem another way: getting the economy growing again. Maybe it’s because it’s so hard to find encouragement in the growth data. Or maybe it’s because there is no special interest constituency that supports economic growth and progress.
What could growth do for the problem?
Let’s play with some Congressional Budget Office (CBO) numbers and, in doing so, focus on what really matters when paying for government expenditures. Let’s focus on nominal GDP growth. Bills are paid with current dollars, not real dollars. To make the analysis interesting, let’s see what might happen if over the next few years we have the 6.4 percent nominal GDP growth the country experienced in 1999, 2000, and 2004. To be specific, let’s assume 2015–2018 generates 6.4 percent nominal GDP growth instead of CBO’s 5.7 percent projection and that 2019–2023 racks up 6.4 percent instead of the 4.3 percent assumed by CBO. If this happens, there is an average increase in GDP growth across 2015–2023 of roughly 1.47 percentage point.
Other things the same, would that help bring down the deficit? Yes, but not by enough to offset our spending habits.
Here’s why. Revenue collected by the US government is expected to average roughly 19 percent of GDP over the next ten years. This is a long-term relationship that goes back to the 1950s and holds, no matter what the tax rates may be. Maybe that last phrase bears repeating: no matter what the tax rates may be. If only our leaders would acknowledge that revenue and tax rates are not the same thing.
So here’s the real problem. According to the CBO, projected spending from 2012 to 2023 will average roughly 22 percent of GDP. With revenue growing 19 percent, there is a 3 percent gap that needs to be closed. And that in a nutshell is the size of our deficit problem. But let’s do the numbers. An increase in GDP growth of 1.47 percentage points multiplied by 19 percent, the amount of tax revenue generated from GDP, yields about a 0.28 percentage point increase in revenues. All else equal, the gap would stand at 2.72 percent of GDP.
We can’t grow our way out of the deficit problem. With revenue as a constant 19 percent share of GDP, no matter what the tax rates, we can’t tax our way out of the problem, either. But we can combine growth with expenditure cuts and work our way out of the hole.
The analysis indicates that the nation cannot avoid taking the tough medicine. We have to give up some government-provided benefits or deal with even more severe challenges later. But improved GDP growth, like a spoonful of sugar, will help the medicine go down.
Wait a minute, what about letting inflation do the job?
There is also the possibility that politicians caught in gridlock will just hope that inflation takes care of the problem. “Remember, my pledge? I promised never to raise your taxes. I’ll just take your savings with inflation.” What might happen if we get galloping inflation? We can’t. Better said, let’s hope we don’t; it won’t work. World credit markets are very smart. When the world predicts that the dollars to be received in debt payment will be worth less than the dollars lent, the world demands an interest rate premium. If inflation jumped to 5 percent annually, the interest rate on 10-year bonds would rise to 7 percent or more. While more revenue would be coming in Treasury’s door by way of inflation, more dollars would be headed out the door to pay the interest cost of the debt.
The bottom line: world credit markets will not allow the United States to inflate its way to a deficit glory land. We have to go back to cutting spending and freeing up the economy. And this gets us to regulation. How heavy is the burden? What are the prospects for lifting some of it?
Regulation’s Growing Burden
Obvious ways to juice up US GDP include changing the way we regulate, loosening up the economy, and focusing America’s creative genius on enterprise instead of lobbying.
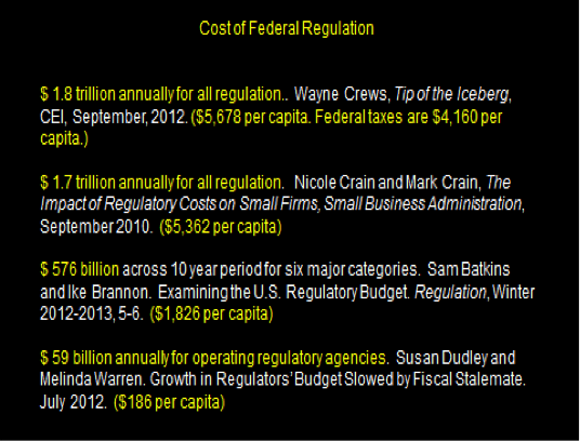
Just how heavy is the regulation burden? As seen here, by some recent estimates, the dollar cost of federal regulation is significantly more per capita than that of federal taxation.
As large as these amounts may be, there are far more serious costs not included in these figures. These hidden costs stem from changes in behavior induced by regulation. Once regulation is found at every major decision-making margin, people focus on ways to escape or, better yet, alter regulation to their advantage. As more rules get written, more effort goes into lobbying Congress and the regulatory agencies to get the right kind of rules.
Two episodes illustrate the point. [1]
On January 2, President Obama signed legislation that addressed the fiscal cliff problem, at least temporarily. According to a Wall Street Journal analysis, the legislation contained $12 billion in benefits for producers of windmill energy, $222 million in tax rebates for liquor makers, some $78 million in write-offs for NASCAR track owners, a special $62 million tax credit that will keep StarKist operating the only meaningful industrial plant in American Samoa, and best of all, a $410 million special tax treatment gift to Hollywood movie studios. But there was an even larger prize. According to the New York Times, drug maker Amgen may have won the single-firm blue ribbon in the pork-packing contest.
The fiscal cliff legislation contained language that delayed limits on drug prices that had been a part of previous legislation developed to bring down Medicare costs. When politicians regulate prices, all kinds of things can happen. It is reported that Amgen had 74 lobbyists working on the deal, working the halls of Congress while the fiscal cliff battle was being fought. 74 people produced $500 million in future net revenues. That’s $6.75 million per worker, perhaps enough for a Thanksgiving turkey for each of them. With gains that large, surely the Amgen government affairs office is counted as a major profit center, along with other Amgen divisions.
Amgen was not the only Medicare price manipulation winner. According to The Wall Street Journal, Senate Majority Leader Harry Reid adjusted some prices to accommodate California-based Varian Medical Systems, Inc. Varian, a maker of radiation tools for battling brain tumors, received a bonus when its arch rival, Swedish firm Electa AB, found its Medicare reimbursement rate was cut 58 percent, all at the very last minute, while Varian’s rate held firm. Electa’s US chief said that he was shocked when he heard the news.
The unhappy adage applies. If you do not have a seat at the table, you are apt to be on the menu.
Transacting in America’s entangled regulatory economy
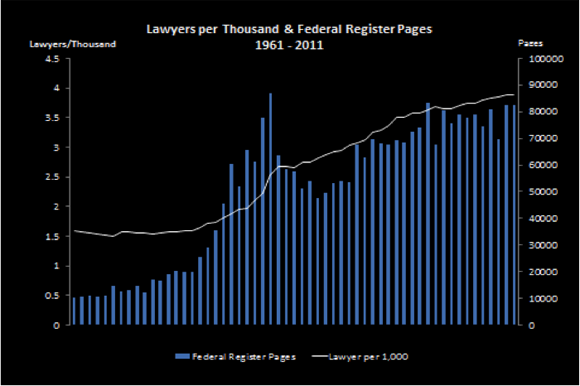
With federal regulation at every major margin of action and with high payoffs available to those who have the lobbyist’s right stuff, it is understandable that our complex economy requires a rising number of lawyers per thousand to keep all the gears turning. This in no way suggests that lawyers are not earning their keep. Just the reverse. They are a necessary component of the regulatory economy. And when that economy gets larger and more complex, they get busier.
For decades prior to 1970, the good old USA operated with about 1.5 lawyers per thousand. Then when regulation shot to the ceiling, the number of lawyers per thousand rose to 3.8 per thousand. More than twice as many lawyers were required to work through life’s complex transactions. It’s interesting to see how these numbers map into the count of pages in the Federal Register, the official federal journal where new and modified rules are posted each day. We see this in the next chart. Does correlation mean causation? I think so in this case.
It’s worse than that
Unfortunately, regulation’s burden is even heavier than described by estimates of per capita cost and suggested by the higher transaction cost ordinary folks and firms must pay when working through the regulatory maze. As illustrated in stories about Amgen and Varian Medical Systems, there are incredibly high payoffs to be obtained through successful lobbying, perhaps even more than may be gained from developing and marketing an improved product or service. In short, incentives and priorities change within highly regulated state.
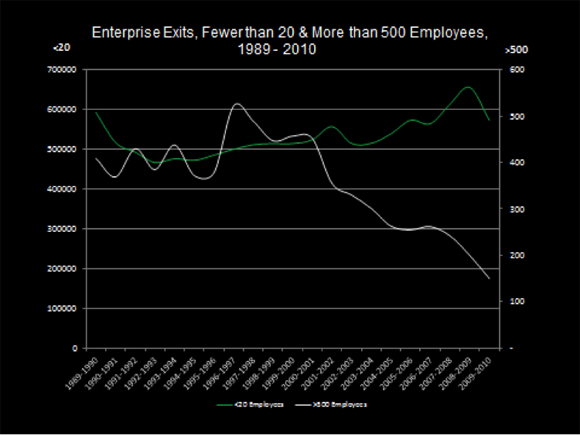
What sort of data might give us a hint as to how things change? Let me suggest that the life expectancy of firms may be affected. Those that worked regulation successfully may live longer and more comfortably. Those that are not so fortunate continue to live and die in the competitive economy. As proxies for this, consider the annual count of deaths for firms in two size categories, those with fewer than 20 employees and those with more than 500. I will assert that the little guys gain very little in the way of regulatory protection from competition. They are too small to lobby. I assert that firms with more than 500 employees know the ways of Washington like the backs of their hands. They know how to get goodies that make life more comfortable and life expectancies longer.
Consider the next chart. Here we see the count of enterprises disappearing each year from 1989 through 2010. The green line describes the small fry. Notice that the number exiting rises across time and in association with recessions. Now, compare that with the white line for the firms with more than 500 employees. White and green move in a similar way across half the chart, then diverge. The death rate of large firms has plummeted since 2000. We must be careful here. Death means disappearance, which includes mergers. Nonetheless, the divergence begs for an explanation. I think part of the explanation relates to the cushioning effects of regulation and the resulting crony capitalism. But the data deserve closer scrutiny.
Lifting regulation’s load
With regulatory benefits being spread thickly across special interest groups on a daily basis, why would anyone in his right mind see prospects for regulatory reform? Call me a congenital optimist, if you wish, but let me suggest that prospects for change have brightened. Why?
More people are waking to the fact that regulation is not delivering the benefits they expected when they marched in the street—figuratively speaking—for more regulation. Water quality is a prime example. By most EPA measures, US water quality in lakes, rivers, and shorelines is falling, not rising. Consider ethanol mandates and subsidies. There is growing evidence that the mandate generates more damage than benefits. But these are just two examples, hardly enough to motivate a movement.
Systematic regulatory reform emerges when there is systematic review of all regulatory programs for the purpose of lightening the load. This occurred in the Ford Administration and was carried forward in the Carter Administration. During those six years, the nation saw the end of airline regulation by the Civil Aeronautics Board, the termination of Interstate Commerce Commission surface transportation regulation, major revisions in banking regulation, and the introduction of reform efforts at the Environmental Protection Agency. Reform was characterized by focus on outcomes, not technical specification of how to regulate. Put another way, efforts were made to push command-and-control regulation into the back seat.
If ever there were a time to free up the economy, it is now!
New Developments in Labor Markets
Employment data from the Bureau of Labor Statistics continue to show slow improvement in total employment. With low GDP growth, it is impossible to close the overall unemployment gap, but it is still possible for more people to have jobs. Life is getting better for more people.
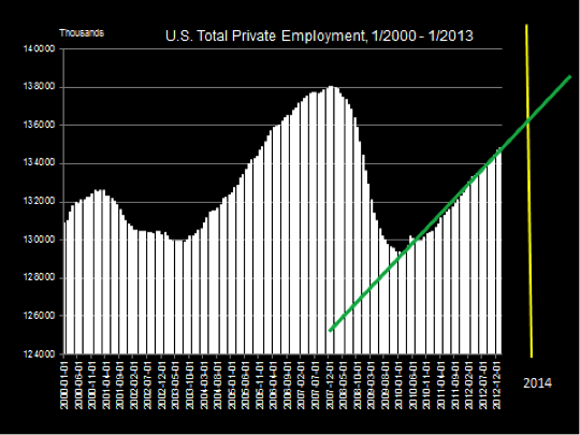
The accompanying chart shows this improvement and, with the included trend line, gives an estimate for when the level of total employment will recover to the December 2007 level. The first half of 2014 appears to be the time when the economy resets to go, but while overall employment levels are rising, recent labor market studies by economists raise the strong possibility that labor markets have become polarized. This is a way of saying that there are growing opportunities for lower-skilled and higher-skilled workers, but diminishing opportunities for those in between. Those caught in the middle are being replaced by smart automatic processes that are taking over operations that previously required some skill and specialized knowledge.
Translated into educational attainment, polarization suggests we should observe much better prospects for high school graduates (low level) than for high school dropouts and even better prospects for people with a bachelor’s degree.
We may be able to see a bit of this in the next chart, showing unemployment by educational attainment. The data are for the month of January, begin in 2003 and reach to 2013. The unemployment rate difference observed between those with a bachelor’s degree and those without a high school diploma is largest during the peak of the recession. In a sense, those with the lowest level of educational attainment are not strong participants in the labor market. In fact, the participation rate is about 45 percent.

A different picture is seen for those with a high school diploma and those with a two-year degree; they are definitely in the labor market along with those with a four-year diploma. Still, polarization or not, the lesson to be learned is pretty clear: education reduces unemployment risk, and the last two years of education reduce that risk by a large amount.
Will a $9.00 minimum wage help those at the bottom?[2]
In his February 12 State of the Union address, President Obama came forth with a proposal to raise the federal minimum wage to $9.00 an hour from the current $7.25 per hour, a large 24 percent increase, not in one single step, but then pegged to inflation going forward. Offering traditional justification, President Obama asserted that raising the minimum wage would bring immediate improvement to the well-being of millions of American workers. Making a moral argument, he put the proposal this way:
We know our economy is stronger when we reward an honest day’s work with honest wages. But today, a full-time worker making the minimum wage earns $14,500 a year. Even with the tax relief we put in place, a family with two kids that earns the minimum wage still lives below the poverty line. That’s wrong. That’s why, since the last time this Congress raised the minimum wage, 19 states have chosen to bump theirs even higher. Tonight, let’s declare that in the wealthiest nation on Earth, no one who works full-time should have to live in poverty, and raise the federal minimum wage to $9.00 an hour.… This single step would raise the incomes of millions of working families.
It is interesting that the president offered as justification the fact that 19 states had higher minimums than $7.25, as if somehow those states were wiser or better than the others. But the fact that federalism was resolving the issue of whether or not there should be a minimum and if so, how much, is justification for doing nothing. Let federalism work!
Can the president’s initiative stimulate the economy? Just how many workers earn the minimum wage?
According to the Bureau of Labor Statistics, in 2011 the number of hourly paid workers earning the $7.25 minimum wage was 1.7 million, this out of a current total of 134 million on nonfarm payrolls. About 50 percent of these were less than 25 years old. So how can this immediately “raise the incomes of millions of working families”? Perhaps the Obama advisers are counting those who currently earn more than $7.25 per hour but less than $9.00, and maybe they are counting on a wage-bump effect that will cause wage rates at all tiers to bounce higher. But if and when that happens, won’t the law of demand still hold? Won’t those who earn more still have to produce more? There must be still more to the story.
So what’s going on? Is President Obama talking about lowering the first rung on the ladder of opportunity or helping organized labor by raising rivals’ costs? Maybe some of both? Is this another bootleggers and Baptists coalition, where one interest group tries to take the moral high ground while the other chases bottom-line benefits—but both propose the same government restriction?

Consider the accompanying map, which shows prevailing minimum wage rates across the 50 states. As indicated, these vary from a high of $9.19 to a low of $7.25. More to the point, notice the juxtaposition of states like Vermont, with an $8.60 minimum, and New Hampshire, with a $7.25 minimum. Or compare Illinois, with an $8.25 minimum, and Iowa, Indiana, and Wisconsin, currently enforcing the federal $7.25 minimum. Surely union organizers will appreciate, and lend their support to, the president’s proposal for reducing competition in competing labor markets.
Why not try “the right kind of nothing”?
There is another approach that can be taken to lifting the wealth of nations. Instead of yielding to command-and-control conceit and thinking that markets can simply be ordered successfully to deliver a better world, an alternate approach involves using what Duke political economist Michael Munger calls "the right kind of nothing."
This has do with first clearing away thickets of rules and regulations that limit work opportunities, reducing taxes and regulations that discourage hiring, and then getting incentives right and unleashing the energies of free-market forces. But let’s be more specific. What might we place on the brush-clearing agenda?
- Eliminate or sharply revise the ACA insurance mandate for small businesses to offer employee health plans. The current law sets the entry point at 50 or more employees. Make it 100, or eliminate the mandate completely.
- Eliminate payroll taxes for all teenage workers. The number involved is small; the lost revenue can be obtained later from higher wages.
- Remove or soften overly strict licensure requirements that limit entry into personal care and other services jobs.
- Allow interns in college-supervised program anywhere in the economy to work for nothing in jobs that form part of their educational experience, just as they currently do in congressional offices.
Let’s reduce poverty the old-fashioned way. Let’s get back to work. America doesn’t have a minimum wage problem. America has an overly energized-government problem, one that limits opportunity for entry-level workers and on-the-job training.
Still Looking for Heroes
Over the years, I have enjoyed sharing stories about people who did marvelous things to make life more fun and better for one and all. R.E. Olds came up with the moving assembly line, which dramatically reduced the cost of building automobiles, and Henry Ford took the idea to the limit. Then there was Alexander Bell and the telephone, along with lesser-known individuals such as Francis Wolle, the 1852 inventor of the paper bag, and Clarence Hamilton, who in 1888 introduced the Daisy BB-gun to promote the sales of his cast-iron windmills.
Consider the Daisy story. The tail wagged the dog. The gun was so popular that Hamilton shut down his mill operation and went into the Daisy air rifle business full force. Hamilton didn’t invent the gun; he popularized it. But here’s my latest hero.
His name is Gideon Sundback, a Swedish immigrant who worked at the Automatic Hook and Eye Company in New Jersey. According to a fascinating New York Times story, Sundback took on the task of automating the hook and eye, a frustrating fastening device used routinely on women’s shoes, corsets, and dresses for hooking things together. In 1911 Sundback invented the zipper. Think where we would be without it! All decked out in buttons and bows! But he didn’t give it its name. This was done by the rubber company B.F.Goodrich. In the 1920s, Goodrich introduced a line of men’s rubber boots that were equipped with Sundback’s invention. The boots were called Zippers. And the name transmuted to the device itself.
We must be thankful for little things.
Footnotes:
1. Bruce Yandle, “Rahm’s Rule of Crisis Management: A Footnote to the Theory of Regulation,” The Freeman, February 11, 2013, accessed February 27, 2013, http://www.fee.org/the_freeman/detail/rahms -rule-of-crisis-management-a-footnote-to the-theory-of-regulation#ixzz2M0GD3jXD.
2. Bruce Yandle, “Minimum Wages: Equal Opportunity or Barrier to Entry?” The Freeman, February 20, 2013, accessed February 27, 2013, http://www.fee.org/the_freeman/detail/minimum-wages-equal-opportunity-or-barrier-to-entry#ixzz2M0Ej2Qvz.

