- | Government Spending Government Spending
- | Policy Briefs Policy Briefs
- |
The Economic Situation, March 2021
As March arrives, reflections on 2021’s first couple months may prompt many to recall the opening lines of Charles Dickens’s A Tale of Two Cities. Reflecting on London’s prosperity and Paris’s destructive revolution in 1789, Dickens spoke of the best of times and worst of times, an age of wisdom and one of foolishness, an epoch of belief and of incredulity. On one of the more tragic afternoons in the nation’s political history, Americans watched on January 6 as a horde of disgruntled individuals converged on and sacked the nation’s capital, leading to the death of five people. The melee disrupted a constitutionally mandated electoral college report on Joe Biden’s victory and led to destruction of some of the Capitol building’s furnishings and features. It was, sadly, America’s version of the worst of times.
In the background that day, the coronavirus was raging; more than 400,000 people had died from it since the start of the pandemic, and the economy, understandably, was waxing and waning, yet still performing. Somehow, in spite of all this, world financial markets held steady, testimony to the notion, perhaps, that investors do take a long view of things. The US Constitution and rule of law prevailed yet once more. Somehow, cooler-head influence emerged and law-abiding Americans put Washington back together in time for a National Guard–protected inauguration. It was a time of wisdom and foolishness, to put it mildly.
Prospects for 2021
With a peaceful inauguration now past, a rollout of much-hoped-for virus vaccines now beginning, and stronger signals for the 2021 economy being observed, I feel that America has, in the words of the psalmist, walked “through the valley of the shadow of death.” America has much to celebrate. Although growth in retail sales had been sailing—but weakened—in November and December, there are stronger economic signals including high-paced construction activity (especially in homebuilding), rising industrial production, and 4.0 percent fourth-quarter GDP growth. I note that the 4.0 percent estimate left a total GDP gap of 2.5 percent between the levels of GDP in December 2020 and December 2019. In February, the Congressional Budget Office predicted the gap would close by the middle of 2021. Other forecasts discussed in this report agree. Finally, looking further ahead, Treasury Secretary Janet Yellen expects the economy to reach full employment in 2022, provided that the Biden stimulus package is approved. But for full employment to happen, recovery will have to take place in the hard-hit leisure and hospitality sector. In January 2021 there were more than 10.0 million unemployed workers, with some 1.9 million of those in leisure and hospitality.
America still must deal with the economic burden imposed by the novel coronavirus. The count of victims and their families is huge, and the disruption associated with partially closed economies continues to take a toll. Apparently, however, the vaccine rollout is reducing some of peoples’ fear, as reflected indirectly in the massive buildup of savings that occurred in association with the early-2020 multitrillion dollar federal stimulus program. The urge to save seems to be easing, which means spending is rising. There will be more on this later.
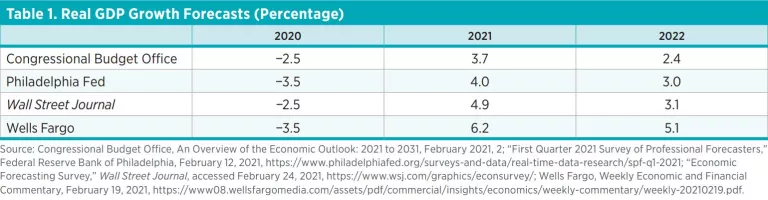
A review of what various forecasters expect for 2021 and 2022 gives reason for optimism. (I note to readers that the first estimate for 2020 real GDP growth came in at −3.5 percent. The Federal Reserve Bank of Philadelphia and Wells Fargo should pop a cork!) As shown in table 1, 2021 is expected to see greater than 4.0 percent real GDP growth, and 2022 will show weaker growth. I call attention to the extraordinary Wells Fargo forecast. It is the only one that explicitly takes account of the $1.9 trillion stimulus bill making its way through Congress when the forecast was made. Otherwise, the rise and decline are associated with the combined effects of stimulus growth and tax increases promised by the Biden administration.
How This Report Is Organized
This Economic Situation report has four main sections. The first section addresses some of President Biden’s recent policy proposals. These include his proposed economic stimulus, trade, and student debt forgiveness policies. I argue that major elements of Biden’s stimulus package are driven by payoffs to two important interest groups: middle-class America and organized labor. I also make the point that parts of the proposed spending can be reduced significantly without blunting the desired stimulus effects. My examination of trade policy raises a common concern regarding protecting a sector against foreign competition by imposing tariffs on US consumers: typically, the numbers just don’t add up. Ultimately, lots of people pay so that a small group can enjoy protection. In a discussion of student debt, I make the point that debt cannot simply be erased in total. Yes, debt can be forgiven for some people, but another group of people will have to pick up the burden. Ultimately, someone has to pay the debt.
The report’s next section offers some philosophical thoughts on what Americans, individually, may do when they are deeply disturbed about their troubled nation and the prospect for more civil times. Drawing first on Voltaire’s Candide, this section recommends that each American tend to his or her garden. Put another way, Americans should take actions close to home, where they can make a difference. Making a difference helps achieve Adam Smith’s ideas regarding community life and how to get along with other people. These thoughts are reinforced with a short discussion of the French economist Frédéric Bastiat’s optimism about the prospects for markets and freedom immediately following the French Revolution of 1848.
As always, the report includes a state spotlight. This time we focus on Ohio, one of the nation’s older industrial states, and that state’s economic performance. And finally, the report concludes with a look at Yandle’s reading table and a review of two books.
Comments on President Biden’s Policy Proposals
The Next Stimulus and What It Reveals
In their popular 2012 treatise, The Dictator’s Handbook: Why Bad Behavior Is Almost Always Good Politics, political scientists Bruce Bueno de Mesquita and Alastair Smith offer a cogent explanation of what it takes to be a successful politician. Coincidentally or by design, one can see echoes of their theory in the renewed stimulus effort from President Biden.
In brief, successful politicians, also known as the “selected” (the authors’ term, because the book applies to all government forms), who wish to keep their jobs must pay special attention first to the “essentials.” The essentials are people who are critical to the selection of the selected and to whom the selected must provide important benefits. The selected must also provide benefits to the “influentials”—other people who matter a lot in the selection process—and must never forget the less critical “interchangeables.” In America’s case, the interchangeables are citizens who vote but who individually are not critical, because there are so many of them.
Parts of President Biden’s proposed, mammoth $1.9 trillion spending plan seem to recognize this three-part advice. But because the economy is already overloaded with cash from past relief efforts and seems primed to jump when the virus lets up, the full Biden plan may be far more than the economic situation calls for. More on this later.
Let’s look at some essentials, influentials, and interchangeables.
Any US politician who wins national office knows America’s swing-voting middle class is essential. Biden certainly seems to. His initial plan, now being modified, calls for them to share in a round of $1,400 checks that, combined with the most recently sent $600 checks, bring $2,000 to households earning more than $50,000 annually. I note that 2019 US median household income was $68,703. The politically essential middle class and members of other economic classes should feel good.
What about the influentials? In his “Build Back Better” plan for America, the president makes it clear that organized labor is favored. Since taking office, the president has moved to replace the National Labor Relations Board’s general counsel with one who would be friendlier to unions; called for continued support of the Jones Act, which requires coastal shipping always to occur in American-made ships; and ordered that federal contractors pay a $15 minimum wage. Indeed, unions appear to be an important part of his overall support—they are perhaps not essential but certainly influential. So what’s in Biden’s stimulus plan for them?
The Minimum Wage Component
There is a much-debated $15 federal minimum wage in the stimulus package that would cover the 50 states. One should note that 29 states already have minimum wage laws that exceed the current national rate (with more states in the works), and a number of cities do as well. The population of any state or city can work the democratic process to raise the minimum if it chooses to do so. So why might the federal government impose on people in states with a lower cost of living who choose to maintain the wage status quo? The answer, I believe, is that organized labor, like every other enterprise, prefers less competition to more. This permanent law change would have no direct impact on the federal budget but would place high-growth states with low union membership—such as many in the industrializing southeast—at a competitive disadvantage. Likewise, highly unionized, older industrial states, where wages and living costs are higher, would have an advantage. (I note that the fact that this part of Biden’s stimulus package has no direct budgetary effect may, because of Senate rules, cause the minimum wage provision to be deleted from the final bill. This means that a minimum wage increase may be proposed in later legislation.)
Any analysis of the effects of a minimum wage that is set higher than prevailing market-determined wages will indicate that those who are still employed following implementation are made better off. The difficulty is faced by those who are no longer employed. A February Congressional Budget Office study of the effects of a $15 national minimum indicates that 1.4 million jobs would be lost and GDP growth would be slowed a bit, but 900,000 workers would be lifted above the poverty line. Unfortunately for the employment prospects of the lowest wage earners in America—those in the hotel, food service, and travel sectors, which are now seriously affected by the pandemic—a higher minimum wage will challenge them to somehow become more productive in order to keep their jobs. (In 2019, 1.6 million workers, or 1.9 percent of all hourly paid workers, were paid the current federal minimum wage of $7.25 per hour or less.) For example, laid-off workers who previously earned $10 an hour would have to become 50 percent more productive to earn $15, and that would be a challenge. In some cases, an employer may be able to raises prices and push the wage increase forward, but pandemic times are not likely to be the best times to do so.
While these concerns are being registered in congressional debate, a separate minimum wage bill has been introduced by Senator Bernie Sanders. His proposal would raise the minimum to $15 across a five-year period, which may help to defuse some of the concerns about the current proposal in the stimulus package. Even so, the same concern remains. Imposing a higher minimum wage across the 50 states has regressive effects. States with a lower cost of living and lower wages would bear a heavier burden when adjusting to the higher wage minimum than will states with a higher cost of living, where wages are also higher.
Another feature of the stimulus package for influential state and local government leaders and their public employees, unionized and otherwise, is a one-time $350 billion shot of money that could assist with education, healthcare, and also COVID-19 relief. And, because money is fungible, it could bolster anything else local politicians seek to do.
What about the Interchangeables?
As for the interchangeables, who individually matter less in the political scientists’ scheme but taken together matter a lot, the stimulus package offers temporary increased unemployment benefits, expanded food stamp and childcare benefits, a hold on evictions for nonpayment of rent, an increased earned income tax credit, and, under the rubric of what should be termed “new welfare thinking,” payments from $3,000 to $3,600 to families for each child, the exact amount depending on their children’s ages. These payments would last one year for individuals earning more than $75,000 annually or for couples earning more than $150,000, but they would be a permanent part of the welfare landscape for those earning less than the noted amounts. This child-payment proposal lays the foundation for a federal minimum income program.
In Dictator’s Handbook terms, Biden’s plan assumes that middle-class voters form the bedrock essentials group. Unions are influential and would get a permanent shot in the arm. Influential state and local politicians and workers also would receive a large temporary benefit package. Other, less critical interest groups could receive sizable temporary and ongoing transfers—enough, perhaps, to inspire them to rise up and call Biden’s name blessed.
But Is It All Necessary?
As mentioned earlier, Biden’s proposed $1.9 trillion spending increase comes on top of an additional $900 billion approved in December. There’s no doubt about it: $2.7 trillion is a mammoth amount of money. But other than taking the critically important step of beefing up COVID-related actions and assisting genuinely hard-hit workers, is the money really necessary? Most likely not—and certainly not, in my opinion, when it comes to the upper-middle-class and union benefit pieces of the package.
There was early pushback on part of this by senators from both parties who talked about their concerns with White House staff. They wanted to reduce the income eligibility threshold for the proposed $1,400 stimulus payment to well below the initial range, which would have benefited households earning as much as $200,000 annually. The senators urged that the funds be targeted first to the lower-income group, where, in their view, people were hurting most.
Consider this. Since the run-up in federal payments to households, businesses, and individuals, vast amounts of money have been tucked away in savings and other bank accounts instead of spent, and a large amount of credit card and other consumer debt has been paid off. According to Federal Reserve data, in January 2020, total US demand deposit balances stood at $1.6 trillion. In January 2021, the level was $3.2 trillion, up $1.6 trillion. In January 2020, the total amount in savings was $9.8 trillion. In January 2021, the level stood at $11.1 trillion, an increase of $1.3 trillion.
Why so much cash? Maybe fear of later COVID troubles, perhaps fear of reduced spending opportunities, and maybe uncertainty about future tax increases to pay off the rising debt. But there is a bit more. Higher-income people have a lesser tendency to spend windfall cash than do lower-income people. As the same amount of cash is distributed across people representing an income range, less gets spent as income rises. And there is yet one more consideration to be made, which relates to what in economics jargon is called the permanent income hypothesis, an argument put forward years ago by economist Milton Friedman. In plainer English, the hypothesis says that individuals are more inclined to change their spending habits when their estimated permanent income changes, not when there are transitory changes. Not many people would consider a $1,400 stimulus check to be a basis for altering spending across their household budget; they might stick that money in the cookie jar instead.
And credit card debt? In January 2020, credit card and other consumer revolving credit balances stood at $840 billion. In January 2021, they were down to $744 billion. Sure, there are lots of people hurting, and America can find them and offer assistance; but on the basis of the surge of funds in checking and savings accounts, one can see that the bulk of American consumers—though of course, not all—seem to be stoked and ready to go.
Do current and future taxpayers really need to send another trillion or so when it is unlikely to affect current spending significantly? Does America really need to raise the $7.25 federal minimum wage to $15, when 29 states have already adjusted their wages upward (in most cases reflecting local market conditions), others have significantly lower living costs, and the rest could do the same if the voters in their states so wished?
Maybe it really is politically necessary to take care of the essentials and to pay off the influentials. Or maybe the country could concentrate on dealing directly with COVID-19 and providing immediate aid to the parts of the population that are truly hurting. Relief that comes with accelerated vaccine distribution and belief that the worst has passed will generate some relaxation of purse strings and generate more sustainable spending increases.
Biden’s Worker-Centered Trade Policy
The Trump administration will long be remembered for many things. One of those will be a get-tough trade policy, particularly with respect to China, but also with respect to any other country that seemingly raised President Donald Trump’s ire. Yes, there were significant increases on tariffs affecting imports from China and on aluminum and steel from everywhere, but there were also spasmodic changes in trade policy with Canada, France, and Germany. Starting out of the gate in 2017 with unsuccessful proposals for border taxes, Trump operated what I call “gatekeeper capitalism.” He attempted to get something at the gate for those who wished to trade with America.
With a new administration in town, many have wondered what the Biden trade stance will look like. In early January, Katherine Tai, President-Elect Biden’s choice for US Trade Representative, offered some important insights. She indicated that the Biden administration will have a “worker-centered trade policy” that recognizes the dual nature of economic life. She emphasized that people in a market economy are both consumers and producers and that they should not forget that the worker side of the equation has to be emphasized when tariffs are considered. Later, in February, President Biden further described his emerging trade policy as “foreign policy for the middle class,” again noting that workers will receive attention when trade policies are modified.
Tai makes a valid point. Yes, each employed American is both a consumer and a producer. And of course, in a global economy characterized by economies of scale and division of labor, it’s hardly ever the case that individual workers spend their monthly paycheck on goods that they themselves produced. For example, as a university professor, I have never purchased anything from my university other than a few items from the bookstore. And as much as I love to shop at Dollar Tree, it is surely the case that Dollar Tree never buys anything from me. But there’s something else one must consider when it comes to using tariffs to limit the importation of consumer goods in order to protect the jobs of American workers. Should the country really have tariffs on French wine, Canadian lumber and aluminum, European steel, and Chinese-produced shoes and shirts in order to protect the jobs of American workers in each of these affected industries? Or is it possible that in doing so, trade policy hurts far more American citizens than it helps?
To answer this question, one should look at the number of American workers who are employed in producing goods, where international competition can matter a lot, versus the number employed in services, where international competition is less consequential. In December 2020, there were 20.4 million Americans employed in the goods-producing sector, which includes mining and logging, construction, and manufacturing. Just 12.3 million of those were employed in manufacturing, which is the sector discussed most often when tariffs are debated. There isn’t much international competition in construction, and the number employed in mining and logging (630,000) is relatively small. So my focus is on those 12.3 million people and their families.
What about the number of people who are employed in jobs that hardly ever face direct international competition? What about barber, hairdresser, teacher, nurse, surgeon, cook, chef, and restaurant operator, just to mention a few of the services employment categories? In December 2021, there were 100.8 million American workers employed in the service sector—five times more than in the goods-producing sector and nine times more than in manufacturing.
Does it make sense to implement tariffs or take other actions that raise the cost of living for more than 100 million Americans in order to provide balm for 20 million or less? Reasonable minds may disagree, but each should know the numbers first. There’s yet one more employment sector that one should review when considering who wins and who loses when the government chooses to place tariffs on consumer goods that enter American ports. The government sector employs 21.3 million workers, and that sector faces almost zero international competition.
So in an effort to assist 20 million workers employed in producing goods, the government may increase the cost of living of an equal number of government workers, along with 100 million others employed in the service sector. It seems to me that the crude benefit-cost test implied here fails. As nice as using trade policy to assist people in the goods-producing sector sounds, the country plays a losing game by placing tariffs on imports. But if that’s the case, why do US presidents typically protect a small number of workers at the expense of a huge number of other Americans? In a way, the answer comes from the same benefit-cost analysis just considered.
Here’s the compelling public choice logic. The smaller the group of people seeking a government benefit, the lower the cost of organizing its appeal for protection and the larger the average gain per group member. It pays to protest. On the other side of the coin, the larger the number of unorganized service workers tasked with paying for the protection, the less pain each worker feels. And the cost of organizing their protest is almost insurmountable. Indeed, if tariffs are imposed on consumer goods and production inputs (e.g., steel and aluminum), most of those in the now-higher-cost sectors will not even recognize that their economic hair has been clipped a wee bit. Their industries will become a little less competitive, their purchasing power a little less than it would otherwise be. Over time, businesses hit by higher costs on the margin fail.
Of course, elected presidents understandably dance “with them that brung them,” and, as noted earlier, Biden is clearly attempting to reward middle-class voters by way of transfers and to reward organized labor by way of tariffs and legislation to increase the minimum wage. But presidents are responsible to all the people, which means all people should somehow be considered when protection benefits are being considered. Consideration of Trump trade policy, which was highly chaotic, with what is expected from President Biden suggests that Biden will be more predictable and therefore less chaotic and more reliant on normal government agency reviews and open debate when trade deals are formulated. Because of this stability, the trade world may be a bit more settled.
Forgiving Student Debt and Double-Entry Bookkeeping
Doing something about student loan debt has become a political hobgoblin for any new administration. Yes, according to the Congressional Budget Office, “between 1995 and 2017, the balance of outstanding federal student loan debt increased more than sevenfold, from $187 billion to $1.4 trillion (in 2017 dollars).” And yes, the total now owed exceeds the total owed for credit cards and auto loans. An average of about $35,000 is owed by some 44,000 students and their parents. Interestingly, no one seems too concerned about Americans’ collective $1.2 trillion in auto debt, where the average loan stands at $32,480 for new vehicles and around $20,000 for used cars—perhaps owed by some of the same struggling student loan borrowers.
There is yet another relevant consideration. Debt is an important part of the typical person’s balance sheet, but net worth may be a more important focal point. It is possible to have healthy net worth (which is determined by subtracting debt and other liabilities from assets) and still have sizable debt. On this point, the Federal Reserve recently indicated that the average net worth of families with a head of household age 35 or younger was $76,300. The median value was $13,900. The point of this is obvious: some of the college debt holders are now lawyers, doctors, accountants, and young businesspeople who have valuable assets as well as a student loan debt they hope to pay off. Before leaping to the conclusion that all student loan debt should be forgiven, it might be wise to take a closer look. In some cases, debt enables income, which then generates a buildup of assets.
To most people, debt is debt, and paying it off is never easy. But politicians seem to see things differently, especially when debt is owed mainly to the federal government and when debt holders can vote. After all, the political reduction of federal debt can be done with a bookkeeping entry. Reducing private debt takes real money. The source of the pressure to forgive student debt has at least four elements.
First, the debt amount, which has built up over decades, is large—equal to the size of the Defense Department budget—and, partly as a result of ongoing promises that it will be forgiven, in arrears. Debt holders were already facing difficulty owing to the Great Recession; COVID-19 has understandably made things even worse.
Second, when running for office and acknowledging the hardship faced by hard-pressed Americans in all walks of life, candidate Joe Biden promised to cancel $10,000 of debt for each student who borrowed money to pay educational expenses. His promise, and those made by other presidential candidates, added significant fuel to the debt forgiveness fire. Third, the Trump administration’s temporary relaxation of payment requirements expired on the last day of January 2021. And fourth, debt holders are stuck with the problem; even personal bankruptcy does not allow one to discharge student debt. While Senator Elizabeth Warren is currently attempting to fix the bankruptcy issue, it remains the case that student debt must be paid one way or another.
Many politicians and public figures are joining the call for debt cancellation (or forgiveness, as they often put it). Described in these terms, the proposed action seems easy: just erase the debt and get on with life. But fewer are vocally recognizing the simple realties of double-entry bookkeeping.
If debt is to be forgiven for named individuals, even by the federal government, the same debt would have to be funded by some other named or unnamed individuals. Put another way, the books have to be balanced. Debt forgiven for one party will be debt transferred to another party. After all, the federal bonds must be paid off.
Because one cannot simply wipe these things away, student debt forgiveness would mean that instead of 44,000 former students being in hock, some yet-to-be identified future taxpayers will face paying off another dose of federal debt. Maybe these unknown future debtors will include the grandchildren of today’s borrows and taxpayers.
The “how to pay for it” question was hit head-on by aspiring presidential candidates during the 2020 Democratic primary. Indeed, then-candidates Warren and Sanders were in dead-heat competition in an effort to cancel the largest amount of student debt. At times, Warren spoke about doing away with $40,000 per student loan, if not all debt. Sanders promised that amount also, sweetened with the additional promise that college education will be made available at no cost, which of course would put an end to future student debt problems but surely aggravate the amount of federal debt owed by everyone else.
But both candidates made serious proposals for paying off forgiven debt. Warren promised higher taxes imposed on America’s highest-income earners; Sanders called for funding with a transaction tax levied against bond, stock, and derivative trading. Though their math may have been a bit fuzzy, each recognized that there was no such thing as free debt forgiveness. Someone has to pay—if not now, at least eventually.
Months later, recognition that there is no such thing as free debt forgiveness seems not to be fully forgotten or irrelevant to the current times. President Biden has steered away from substantial forgiveness and still recommends that $10,000 be written off, though other Democrats still call for more. As has been said before, whoever would rob Peter to pay Paul can be certain to get Paul’s vote. Failure at the national level to communicate honestly about debt forgiveness—to communicate that someone else will have to pick up the debt burden—leads to a combination of distrust, accusations of favoritism, and efforts to form another debt forgiveness coalition.
If it’s so easy, why not take on auto debt? Debt owed to hospitals for cancer surgery? What about forgiving past-due mortgage and rental payments instead of just pausing payments? And what about debt that comes from devastating forest fires and hurricanes? Conversely, maybe it’s time to get serious with some straight talk about double-entry bookkeeping and how Americans as a people must pay for their growing appetite for debt forgiveness. Otherwise, they are left to try and determine why some debtors are more important than others. Maybe, just maybe, Americans should try to get to a world where everyone pays their own debts.
Worried about the Country? Try Tending Your Garden
Voltaire and Candide
Some poet somewhere suggested that the night is darkest before the dawn. If that is the case, then as one thinks about the health of the republic, those in America should expect to see some blazing sun rises in the days ahead. Following the horrible tragedy that just befell the US Capitol, the pain and suffering associated with it, and the stumbling search for a way to heal this divided nation, one may find a guidance in Voltaire’s Candide. The book was published just four years after the devastating 1759 Lisbon earthquake that destroyed the entire city and took 30,000–50,000 lives. It’s a story of personal hardships, torture, and even suffocation that befell the central character, Candide, and a small band of associates who made a venturous and decidedly painful tour with him.
Voltaire’s story was inspired by the notion that all was surely not well in this world and that there was no tragedy-eliminating natural harmony that humans could count on to reduce life’s hardships. Voltaire’s lesson comes at the end of the story, when Candide’s small surviving band makes it home to his farm. Bruised, beaten, and maimed, they discuss what they may do next.
After considering various options and consulting with a holy man, Candide offers a simple piece of advice: “[L]et us cultivate our garden.” And they do. Instead of trying to struggle against the evil forces that befell them, each member of Candide’s small band goes to work in the garden. They specialize and together produce more than enough to satisfy their needs. They flourish.
A broader interpretation of garden tending encourages serving the community and offering a helping hand to neighbors and others who may be suffering. Americans have all seen some of this during the pandemic. Church groups and other organizations are doing more to check on shut-in individuals, provide free healthcare services, and expand day care for out-of-school children. United Way has expanded its umbrella, and local community foundations have accelerated efforts to provide additional financial support for local nonprofits. And then there are small and large businesses alike that are increasing their charitable contributions. Maybe this is how healing comes about.
What can America as a nation do to cultivate its garden? Are there some basic economic lessons that it can apply?
Guidance from Adam Smith and Frédéric Bastiat
When facing questions such as these, I try to consider some of the foundation stones of economics that represent, in their own way, wisdom of the ages. I turn first to Adam Smith for advice. In his 1776 Wealth of Nations, Smith urges each person to focus on the desires and needs of others, to figure out how to serve them, and then to produce goods and services for other people. He advises that by doing so, individuals may flourish.
Another one of Smith’s fundamental insights relates to getting along with people and how doing so can relate to long-term prosperity. His 1759 Theory of Moral Sentiments talks about the “impartial spectator,” the man within the breast, a disinterested observer who judges one’s own behavior and steers a person in a more noble direction. Smith suggests that this spectator is formed from life’s experiences, learning about social norms and civil behavior.
These two foundational ideas are tied together. To survive and prosper, people must be oriented to others. They must tend their gardens so that they satisfy their own needs and the needs of others.
Well, all this sounds pretty good, but what about the government and the devastated Capitol?
Smith argued that none of this garden-tending business would work very well unless there is order, protection of life and property, provided by government. In the immediate case, such order would include adequate protection for people who come together in Washington, DC, or anywhere else. It would also include public health protection from a virus that has, putting fear in their hearts, caused Americans to withdraw from normal commercial activities and pull away from their gardens. These fundamental public-sector functions must be done diligently so that each American can spend more time working, producing, and satisfying their needs and the needs of others.
Writing in 1850, French economist and journalist Frédéric Bastiat expressed Smith’s central argument in a different way. At the time, the February revolution in France had just occurred, overthrowing a king and establishing the French Second Republic. There was turmoil, efforts to reshape to the republic, and popular support of programs in support of organized labor. Noting all this, Bastiat concentrated on the harmony that can emerge when markets are allowed to work and free citizens can choose what they will do with their lives so that they may flourish.
Like Smith, Bastiat recognized that there is another way for individuals and interest groups to obtain the world’s goods. One can turn to politics and lobbying, even to revolution, to obtain wealth from others. One can seek to use the state to block competition, to regulate all wrongs, large and small, into rights. Some of this is inevitable, but too much elevates government to the focal point of society and magnifies the importance of being heard and seen as opposed to more quietly producing goods and services to be exchanged in markets. Sometimes chaos seems to reign supreme. Indeed, at the time Smith was writing, his world was shot full of government interventions, tariffs, regulation, and political favoritism.
Smith’s answer was a limited-but-critical role for government: protecting society from violence or invasion, protecting individuals from injustice and oppression, and providing critical public works and institutions. When one considers America’s almost 250 years of experience, how has this notion held up? Two scholars from Presbyterian College, Jody Lipford and Sydney Patton, have an answer. They calculated the share of US government spending on Smith’s vital functions versus all other categories. The latter, which includes a large array of transfer programs, now accounts for roughly 80 percent of the budget, up from around half in 1960.
So as a new administration takes charge, this will be a time first to provide order and protect the public. Yes, the COVID-19 vaccine rollout must be accelerated. Yes, public places must be made secure. And yes, those who have been injured by the coronavirus and other disruptions must be assisted.
After that, Americans must focus on their home place, their neighborhoods, and things they can do something about. As Candide suggests, Americans must cultivate their gardens. Does this mean they should all become gardeners, even those with proverbial brown thumbs? Not at all. The garden for some is the community they live in. Cultivating their garden may involve community service. For others, it is their family. Tending that garden may involve spending more time together. And for others, their work is their garden. Finding ways to be more effective or to be congenial and more supportive of coworkers may be part of tending that garden.
If each person tends their garden, they may find that the economy will get a bit better too.
State Spotlight: Ohio

Each quarter, we select one state and analyze its economic and regulatory outlook. This past quarter, we diverged from this pattern somewhat by looking at the territory of Puerto Rico. This quarter, we return to form with a look at the state of Ohio.
Ohio is in many ways the poster child for American industrialization. Initially a backwater territory for fur trading and farming, Ohio experienced a swell in population from waves of European immigrants looking for employment in a rapidly expanding manufacturing industry. In the 1970s, this growth tapered off, and the population declined slightly, as the economy shifted to a service sector orientation. Ohio was left behind economically and demographically as it become the center of the “rust belt,” an area of the Midwest and Northeast that embodied postindustrial America. New industries such as hydraulic fracturing and finance and insurance took up some of the slack left by manufacturing, and Ohio generally followed the economic trends of Pennsylvania and the Great Lakes states. However, large unfunded pension liabilities and an uncompetitive tax environment burden the state.
Ohio takes up about 41,000 square miles of land, making it the 35th largest state by land area. With a population of 11.5 million as of 2010, it is the 7th most populous state, and it has a population density of 284 per square mile, which is much higher than that of the typical state but comparable to that of neighboring Pennsylvania. Besides Pennsylvania, Ohio is bordered by Michigan to its north, Indiana to its west, Kentucky to its south, and West Virginia to its southeast. Its central location, along with its position on Lake Erie, definitively makes Ohio a crossroads between the eastern and western United States. Columbus is the capital and largest city, but Cleveland in the north and Cincinnati in the south are more central cities in their respective parts of the state.
Ohio’s Early History and Development
Ohio was inhabited by humans as early as the end of the last ice age 9 thousand to 15 thousand years ago. Agrarian civilizations developed starting around 800 BCE and eventually fell into decline to be replaced by various Iroquois tribes from the northeast, which traded furs and fought a series of wars for dominance with each other and early European settlers. After the American Revolution, the land that would become Ohio and the other Great Lakes states was annexed by the United States as the Northwest Territory. In 1803, Ohio was the first state to be formed out of this territory.
The state’s population grew dramatically from several waves of immigration: first, German and Swiss settlers from Pennsylvania; after 1830, German and Irish settlers directly from their country of origin and American settlers from the Appalachians; and after 1880, immigrants from southern and eastern Europe and African American settlers from the south. By the start of the American Civil War, the state’s economy had already been shifting from agriculture to industry. Slavery had been banned in Ohio since its beginning, and the state was central to the Union war effort on account of its large contribution of troops and manufactured goods.
Ohioan manufacturing dominance would continue well into the 20th century, when it would be complemented by Ohio’s prime location as a connection point between the Great Lakes, the Midwest, and the Northeast, the development of extensive transportation infrastructure, access to deposits of key natural resources such as coal and iron, and a swelling labor force from so many waves of immigration. The Progressive Era and Great Depression brought major unions to political prominence in the northeastern parts of the state, but the other parts remained more conservative, a trend that would continue into the 21st century. Starting in the 1970s, industry started to decline both in absolute and relative terms as the service sector became dominant. The most recent major economic development has been a boom in hydraulic fracturing in the state.
Ohio’s demographics, mix of industries, and workforce characteristics reflect this history. Racially speaking, 80.9 percent of Ohio residents are white, 12.6 percent are black, and 6.5 percent are some other race or multiple races. Ethnically speaking, 4.0 percent of residents are Hispanic. Of all Ohio residents, 4.8 percent are foreign born. The United States as a whole is more diverse: 72 percent of Americans are white, 12.8 percent are black, and 15.2 percent some other race; 18.4 percent are Hispanic; and 13.7 percent are foreign born. This difference in diversity reflects the fact that Ohio was heavily influenced by the historical waves of immigration from white European countries in the 19th and early 20th centuries but has since drifted from the national immigration patterns of the late 20th and early 21st centuries.
Ohio’s educational attainment also drifts from the national average. More Ohioans graduate from high school than the national average (90.8 versus 88.6 percent), but fewer Ohioans go on to earn a bachelor’s or postbachelor’s degree (a combined 29.3 percent versus 33.1 percent).
Ohio’s current mix of economic sectors also reflects this history. In terms of overall contribution to state GDP, manufacturing is 17.2 percent of the Ohio economy, finance and insurance is 8.3 percent, mining is 3.2 percent, and education and healthcare is 9.7 percent. Each of these are more important to the Ohio economy than to the US economy, where they contribute 11.6 percent, 6.3 percent, 2.6 percent, and 8.7 percent to national GDP, respectively. In Ohio, information is 3.2 percent, agriculture is 0.7 percent, real estate is 10.3 percent, and government is 10.2 percent of state GDP, and these are all less important to the Ohio economy than they are to the US economy overall, to which they contribute 6.5 percent, 1.3 percent, 12.7 percent, and 11.7 percent, respectively. The other core economic sectors are all about as important to the Ohio economy as they are to the US economy overall. The special importance of manufacturing is expected, given the state’s history, although as mentioned previously, the sector is no longer nearly as important to the Ohio economy as it once was. The slack has been picked up by service sector industries, such as finance and insurance, largely centered around Columbus. The importance of fracking and higher education to the Ohio economy is also apparent in these data. The relative unimportance of the entertainment and broadcasting industry in Ohio is manifest in the lesser contribution of the information sector in the data. One surprising fact is that agriculture is less important to Ohio GDP than to US GDP.
Some sources mention agriculture as one of the main sectors of the Ohio economy, but GDP data from the Bureau of Economic Analysis show this not to be true. It is also not true in terms of employment. Occupation location quotient data from the Bureau of Labor Statistics divide a state’s number of employees in a given occupation by the total number of workers in that state, then compare the resultant fraction to the same proportion generated for the US economy as a whole. In Ohio, production occupations, which cover a wide array of manufacturing-related jobs, have a location quotient score of 1.5, meaning that manufacturing jobs are 50 percent more prevalent in the Ohio economy than they are in the overall US economy. Healthcare practitioners and technical occupations are 13 percent more prevalent in Ohio. Management occupations; legal occupations; construction and extraction occupations; personal care occupations; arts, design, entertainment, sports, and media occupations; and life, physical, and social science occupations are all between 10 and 20 percent less prevalent in Ohio than they are in the United States as a whole. Shockingly, at the very low end of the scale, farming, fishing, and forestry occupations are only 31 percent as prevalent in Ohio as they are in the United States as a whole. The overrepresentation of manufacturing employment in the state is unsurprising, but the fact that agricultural jobs are only a third as prevalent in Ohio as they are in the overall US economy directly contradicts sources that claim agriculture as a major sector in the state of Ohio.
An Assessment of State Policy
On tax policy, Ohio is mixed at best. The Tax Foundation ranks it 39th out of all the states on account of medium-to-high taxes across all tax categories. Individual income taxes range from a 2 percent marginal rate stating at $10,850 of income to a 4.8 percent marginal rate at $217,400 of income. The state sales tax is 5.75 percent, with an average 1.42 percent local sales tax rate. The combined sales tax rate is the 20th highest. The median local property tax is $1,836, which is the 20th highest as a percentage of median income (3.16 percent) and 11th highest as a percentage of property value (1.36 percent). Meanwhile, Ohio levies a gross receipts tax rather than a corporate income tax. Gross receipts taxes are sometimes regarded as more burdensome than regular corporate income taxes because they are assessed as a percentage of every single intermediate business activity rather than final profits. This favors vertically integrated companies with high profit margins and penalizes businesses with a high volume of input and activity before the final sale. Ohio is less competitive on tax policy than every single one of its neighboring states, each of which score higher on this index.
This situation contributes to Ohio’s mediocre score on a variety of “best state to start a business” rankings, where it is often in the middle and sometimes closer to the bottom. The state is often noted for its good infrastructure, good location, and lower costs of living, but the poor tax climate, underdeveloped workforce, and already low level of dynamism and startup activity make it relatively unattractive on most lists.
Fiscally, the situation is also lackluster. Ohio does very well at paying its bills on time and has plenty of cash on hand to cover short-term obligations. It sometimes runs budget deficits, does not have a very impressive list of long-term assets, and may not easily raise taxes if necessary, but these shortcomings are not especially bad compared to other states. Ohio’s unfunded pension liabilities, however, are the third largest (as a ratio to state income) in the nation. Most Ohio workers who aren’t within a decade or so of retirement age should not expect to receive the full or even partial promised amount of their pension if they have one, or they should expect their taxes to be raised significantly at some point to allow these pensions to become solvent.
Ohio is the seventh-largest state economy, with a real GDP of $597 billion in quarter three of 2020 (using 2012 dollars). This number is about 96 percent of the fourth-quarter 2019 Ohio real GDP value of $619 billion, which gives some perspective on the state’s recovery from the coronavirus pandemic. Compared to other states, this progress is right in the middle, with some states such as Utah and Washington having already recovered (in GDP terms) by this point and with other states such as Hawaii still suffering from a roughly 9 percent drop in GDP. Comparing quarter to quarter, Ohio had the 20th-worst drop from quarter four of 2019 to quarter one of 2020 and the 14th-worst drop from quarter one of 2020 to quarter two of 2020. It is notable, however, that the magnitude of the initial drop, as well as the current pace of recovery for Ohio, is part of a regional trend shared by most of the Great Lakes states and by Ohio’s neighbor Pennsylvania. Ohio also followed this trend with regard to its unemployment rate, which hit 9 percent in July 2020, but which was at 5.5 percent in December 2020. The December 2020 rate was higher than Wisconsin’s or Indiana’s, but lower than Pennsylvania’s and quite a bit lower than Michigan’s.
In terms of prepandemic comparisons, Ohio ranked 31st in 2019 for nominal personal income, at $50,200 (in 2012 dollars). This was comparable to Indiana and Michigan ($48,600 and $49,200, respectively) and was higher than Kentucky ($43,800) but lower than Pennsylvania ($58,000). GDP per capita follows the same pattern. Finally, recent real GDP growth patterns in Ohio reveal a very bad first decade of the 21st century and a much better decade in the 2010s. Specifically, Ohio’s total real GDP growth from 2000 to 2010 was only 2 percent during a decade where the United States as a whole averaged 18.7 percent. Ohio had the second-worst state economic performance that decade. Ohio’s real GDP growth from 2010 to 2019 was a much better 18 percent, compared to an overall US increase of 22 percent. This was in line with the performance of the other Great Lakes states and Pennsylvania over that period. Given that growth in the past decade was skewed heavily toward a small group of about 10 West Coast, Rocky Mountain, and Southwest region US states, the 2010s was a very good decade for Ohio and its region. This has been attributed by some to the boom in the hydraulic fracturing industry. However, other states without a significant amount of fracking activity, such as Michigan, Minnesota, and Wisconsin had a decade that was equally as good to that of fracking-heavy states such as Ohio and Pennsylvania, so a general regional trend is more likely.
Ohio has long been seen as a bellwether for national politics, but it’s really more accurate to think of it as the typical postindustrial American state. It swelled as a center for immigration and industry just as America also swelled for the same reasons, but America has moved on to new sectors of growth and opportunity, while Ohio hasn’t. Even for a postindustrial state, Ohio has been handicapping itself unnecessarily. Compared with Pennsylvania, which has two very vibrant cities that have largely sprung back from their worst days and which has benefited more extensively from the boom in fracking, or compared with Indiana, whose policies have been actively courting entrepreneurs and consequently poaching Ohio’s businesses and population, Ohio has senselessly burdened itself with high and poorly constructed taxes, crushing pension obligations, and (as one can soon see) one of the largest volumes of regulation for any state in the country. In this regard, it is not necessarily worse off than, say, its northern neighbor Michigan. Indeed, the terrible first decade of the century Ohio had seems to have given way to a brighter regional economic trend in the most recent decade. But why not take some pointers from its neighbors to the west and east and make the coming decade even brighter?
Regulatory Outlook
With the release of State RegData 2.0 in 2020, the Mercatus Center’s QuantGov platform now allows researchers to access two years of regulatory data for the majority of US states. State RegData allows researchers to count the regulations in Ohio’s regulatory code and find the associations between these regulations, industries, and state agencies. The rest of the state spotlight dives into the current structure and state of Ohio’s regulations and provides a short analysis of the aforementioned data.
Just like the legislatures of other states, the Ohio General Assembly passes laws that are then interpreted and enforced by regulations created by various state agencies. These regulations are compiled into what is officially referred to as the Ohio Administrative Code (OAC). This consolidation is made available to the public on a LAWriter website that is linked to on the Ohio General Assembly’s website.
LAWriter currently houses nearly 380 distinct, topic-based chapters for the OAC. These topics include typical occupation boards (e.g., chapter 4734, regarding the State Chiropractor Board), commissions (e.g., chapter 184, regarding the Third Frontier Commission), funds (e.g., chapter 122, regarding the Housing Trust Fund), seemingly random topics (e.g., chapter 901, regarding dairy), and even completely unlabeled regulations (e.g., chapter 4729). To say the least, organization is severely lacking in the publicly available version of the OAC.
Even though Ohio’s regulatory code is extremely disorganized, researchers at the Mercatus Center have been able to quantify the regulations in the OAC for both 2018 and 2020. In 2018, the OAC had 260,977 regulatory restrictions and 16,696,957 words; these numbers increased to 274,470 regulatory restrictions and 22,646,803 words in 2020. Regulatory restrictions are defined as terms that are legally binding in nature, including “shall,” “must,” “may not,” “prohibited,” and “required.” Some of the larger chapters in the OAC are 3770:1-9, “Additional Lottery Games” (27,390 restrictions); 1301:7-7, “Ohio Fire Code” (11,776 restrictions); and 3745-27, “Solid Waste and Infectious Waste Regulations” (3,523 restrictions).
In addition to finding the number of regulatory restrictions in the OAC, Mercatus Center researchers have used custom machine learning algorithms to organize each unit of text in the OAC according to the North American Industry Classification System (NAICS). In 2020, Ohio’s most regulated industries at the three-digit level were industry 524, insurance carriers and related activities (31,063 restrictions); industry 562, waste management and remediation services (7,190 restrictions); and industry 512, motion picture and sound recording industries (6,305 restrictions).
In addition to regulations that states write on their own, federal regulations in the US Code of Federal Regulations also regulate states. The Mercatus Center’s Federal Regulation and State Enterprise (FRASE) index measures the degree to which a state’s economy is affected by these federal regulations and ranks the states according to their FRASE score. The FRASE index ranks Ohio as experiencing the 26th-highest impact of federal regulations out of all 50 states and the District of Columbia. According to the newly published 2021 FRASE index, a few industries that are a large part of Ohio’s economy are also heavily regulated in the US Code of Federal Regulations. Two of these industries are the chemical manufacturing industry and the petroleum and coal manufacturing industry, which contribute 13.1 percent and 11.6 percent to Ohio’s FRASE score respectively.
As mentioned previously, as of 2020, Ohio had close to 274,470 regulatory restrictions in effect. This is actually the third-highest total among US states, according to State RegData. The good news is that Ohio has recognized that it has a regulatory accumulation problem and has taken recent steps to rectify the issue. In July 2019, Governor Mike DeWine signed a new budget that included instructions for cataloging and cutting unnecessary regulations.
The language of the new law is straightforward, asking agencies to catalogue regulatory restrictions: “Not later than December 31, 2019, a state agency shall review its existing rules to identify rules having one or more regulatory restrictions that require or prohibit an action and prepare a base inventory of the regulatory restrictions in its existing rules. Rules that include the words ‘shall,’ ‘must,’ ‘require,’ ‘shall not,’ ‘may not,’ and ‘prohibit’ shall be considered to contain regulatory restrictions.”
The new law is equally clear on the creation of future regulatory restrictions: “Beginning on the effective date of this section and ending on June 30, 2023, a state agency may not adopt a new regulatory restriction unless it simultaneously removes two or more other existing regulatory restrictions. The state agency may not satisfy this section by merging two or more existing regulatory restrictions into a single surviving regulatory restriction.”
Owing to the timing of this law, State RegData 2.0 will not have captured any significant movements in regulatory accumulation numbers. However, the next iteration of State RegData, which will capture state regulations from March 2020 through March 2021, is slated to be released later this year and should provide a clear picture on the success or failure of Ohio’s new regulatory policy.
Yandle’s Reading Table
For anyone looking for 400 pages of sheer reading pleasure—well, really 414 pages—it will be hard to find anything better than Tony Horwitz’s Spying on the South: An Odyssey across the American Divide. Horwitz is remembered for his much-celebrated 2009 book, Confederates in the Attic: Dispatches from the Unfinished Civil War. A story within a story, Spying on the South masterfully recounts Horwitz’s effort to retrace exactly Frederick Law Olmstead’s multistate trek across the south when, in 1852–1854, under commission of the New York Daily Times, Olmstead was employed to explore the southern states and describe life and culture below the Mason-Dixon Line. To the newspaper editors, it seemed at the time that the southern slave economy and its hopes and fears were distinctly different from those in the industrial north. Olmstead, who later became America’s leading landscape architect—the designer of New York’s Central Park, the US Capitol grounds, multiple college campuses, and the grounds of the Biltmore Estate—was no lightweight traveler. His exploration comprised two legs, each starting in Washington, DC.
The first extended trip covered the seaboard of Virginia, the Carolinas, and then parts of Georgia, Alabama, and Louisiana. The second trip went west across some of those same states, traversed the Appalachian territory, and turned westward to Mississippi, after which Olmstead traveled to Louisiana, Texas, and even to the edge of Mexico. Throughout, Olmstead kept a detailed journal, wrote lots of notes, and of course, submitted text to his sponsor. Using all these materials for guidance, Horwitz attempts to use the same modes of travel—mules, wagons, trains, and steamboats—to stop at the same hotels and inns and see the exact landscapes and locations that Olmstead had observed.
His 22 chapters are delightfully organized using parallel material, his running commentary integrated with Olmstead’s descriptive material. In reading about Horwitz’s travels, one learns about the lonely work of men who worked on Ohio River coal barges, about New Orleans and the gumbo city, and about the heavy German population that settled much of western Texas and, in World War II, struggled because of their nationality.
The author’s clear-eyed descriptions and delightful reports on conversations from his present-day trek are at times reminiscent of J. D. Vance’s Hillbilly Elegy: A Memoir of a Family and Culture in Crisis. Whereas Olmstead, at times in rural territories, described the contrast between the elegant life of plantation owners who enjoyed the benefits of higher-priced cotton and the desperation experienced by the slaves who worked the field, Horwitz often finds stagnant communities and regions where those who can leave have long since departed and those who remain are either stuck and can’t buy a ticket out or are owners of family land to which they are dedicated. Displaying a remarkable talent for getting next to folks, the author reports frequently on conversations that begin over a Pabst Blue Ribbon in a run-down bar that lead to immediate friendships and assistance in seeing the local sights and getting the latest lowdown. But just as Vance’s Hillbilly Elegy introduces the reader to the forgotten men and women in America’s rustbelt, Horwitz brings attention to a rural counterpart where optimism is in short supply and lingering racism is often dominant. But the book is far more than a travelogue; it offers deep, historic content and economic thought about what has happened.
I should mention one last thing that makes Spying on the South so remarkable. That is the subject of the original journey that motivated the book: Olmstead himself—who he was, how he lived, and what he did as America’s original landscape architect. Horwitz does more than render a fascinating account of Olmstead’s professional life and work; he takes the reader into the man himself and helps one to comprehend how this driven man accomplished so much in his lifetime.
I like the book so much that I bought a copy for a son and one for my sister. I urge you to read it.
Anyone looking for a thorough, strongly constructed presentation on the coronavirus—what it is and how it affects human health and behavior—will be well advised to get a copy of Nicholas A. Christakis’s Apollo’s Arrow: The Profound and Enduring Impact of Coronavirus on the Way We Live. The book’s title comes from Greek mythology, for which the author has special affection. It seems that during the Trojan War, the god Apollo took his silver bow and arrows and rained a plague on the Greeks to punish them for enslaving the daughter of one of Apollo’s favorite priests. The book’s eight chapters begin with COVID-19, explore the history of virus tragedies and how human communities seem always to be dealing with them in one form or another, and takes the reader through reactions, responses, and changes induced by this sad and costly global experience. The author is a medical doctor and sociologist and directs the Human Nature Lab at Yale University. His wide-ranging scholarly interests go beyond Greek mythology and include medicine, data science, biomedical engineering, and, of course, sociology. Many of these interests are revealed in clear and, at times, entertaining terms in the book’s well-crafted chapters.
The fact that Christakis has for years worked with the Chinese scientific community in virus studies and that he had Wuhan graduate students working with him before the coronavirus outbreak adds a strong dimension of credibility to his explanation of how the virus emerged in China, how it was transmitted to the rest of the world, and what one may expect for the virus’s resolution. Part of his fascinating medical explanation of the coronavirus prepares the reader to accept the high likelihood that the virus will never go away, but will diminish and become part of life’s biological background, that human communities will find ways to live with its presence just as has been historically the case with other virus-induced pandemics. Christakis makes the point that the common cold is most likely the remnant of some pandemic that occurred centuries ago, but through developing immunity and continuing public health activities, people worldwide make it through the cold seasons without having large scale community disruptions.
Early in the book, the author explains in almost journalistic prose how the virus was carried by human agents from China to US west-coast locations, how versions of the virus emerged at the Life Care Center of Kirkland, anursing home in Kirkland, Washington, and how the person called “Patient Zero,” a resident at the center, succumbed to the deadly virus. The account, which reads at times like a detective novel, reveals the importance of gum shoe work performed by public health staffers who took it upon themselves to trace the origins and spread of the virus. More than once in the account, the reader encounters serendipitous occurrences that help to hasten the arrival of scientific explanations of what is really happening. One of these, for example, occurred in the Seattle area, where a Bill & Melinda Gates Foundation virus study had been underway in the area for more than a year before the coronavirus breakout. Researchers already had a swab-generated database for known individuals that enabled the researchers, when alerted, to identify the contagion pattern followed by the virus as it moved in the Pacific Northwest community. At other times, there is “zemblanity” (the polar opposite of serendipity), such as when Washington Regional Medical Center and university labs were prohibited by the federal government from providing alternate means for large-scale testing when the testing kits approved by the Centers for Disease Control and Prevention or the FDA were found to be faulty.
Some of the book’s more fascinating reading is found in the various accounts of past plagues and pandemics. Christakis does more than just brush against the tragedies that occurred in Athens in 430 BCE, the Justinianic Plague of 541–549 CE, the Black Death of 1346–1353 CE, and of course, the Spanish Flu of 1918–1920 CE, during which 550,000 US lives were lost (equivalent to 1,721,000 deaths today, adjusted for the US population in 2020). The author makes the point that epidemics and plagues are a normal human experience but generally not a global one. However, in the case of coronavirus, the pandemic is global and extensive across the United States.
Going beyond history, the author provides an accessible scientific framework better to equip the reader to understand how, for various virus-driven diseases, human beings go from being exposed and not symptomatic to being infectious and symptomatic. He then applies this framework to data for various infections to show how the rate of infection is determined for exposed populations. It is here that the reader learns about the R0, which is an estimate of the average number of people who may be infected by one pathogen carrier. For example, measles has an R0 of 12.0 to 18.0; smallpox has one of 3.5 to 6.0; and the current coronavirus has one of about 3.0. But like all averages, there can be large variations around the mean, which helps one to understand how 52 members of a church choir in Washington state became infected by one carrier and how one person attending a southern Georgia funeral spread the virus to several hundred attendees. Part of the explanation for these two extreme instances is close encounters involving enthusiastic singing and involving hugging symptomatic people.
Christakis is at his best when examining broad human pandemic responses. The combination of his medical and social science affections is seen in his discussion of human learning, innovation, adaptation, and propensity to look out for future generations, which can be bundled into the term “culture.” He then discusses cumulative culture and how this competitively determined learning enables life to go on even after encounters with new and devastating biological forces. But it is during the struggle with pandemics that people are able to identify the parts of culture that are most precious to them. Indeed, when the “cure” requires an end to close encounters with family members, neighbors, and strangers, one is left to wonder about the purpose of living. As the author makes clear, humans are a social species, and a very creative one at that.
Listen to a conversation with Bruce discussing this Economic Situation Report on the Mercatus Policy Download here.

