The Sleepwalking Economy
The August 30 second estimate for 2017’s second quarter tells us the US sleepwalking economy picked up speed from first quarter’s zombie-like 1.2 percent GDP growth, and registered a more respectable 3.0 percent second quarter growth rate. With this happy spurt, the average for the two quarters fell dead on the 2.1 percent growth rate that has persisted since the return from the dead in 2008. Even so, the economy is still sleepwalking, getting nowhere near the 3-plus percent average annual rate of growth that was the norm prior to the Great Recession and the rate hoped for by the Trump administration and all the rest of us. Still, when we dig deeper into the GDP data, we find signs of renewed life.
Consumer spending is rising again, finally confirming what the University of Michigan’s and Conference Board’s optimistic consumer sentiment indexes have been suggesting. For months, the happiness survey indexes have been on the upswing, but consumers were not backing their words with money. With household debt subsiding somewhat, consumers are spending again. But there is a small cloud on the horizon—not a big one, but still a warning. Credit card delinquencies are on the rise. On another front, driven partly by a weakening dollar but also relatedly by a more stable Europe, net exports are giving the economy a positive nudge, and that helps manufacturing.
July’s celebrated employment report indicated that 209,000 jobs had been added to the economy, and that was accompanied by a lower 4.3 percent unemployment rate. The solid job growth and unemployment numbers together tell us that job openings ran ahead of labor force growth. Labor force participation bounced up a bit. But of perhaps even greater importance, the July employment level closed the gap between where the economy stood in November 2007 and the current period, after adjusting for the effects of population growth and retirements. Yes, the July employment report was a strong one, but still not strong enough to lift the five-month moving average increase. Total employment increased, but due to some weaker months in the series, the five-month average for total employment gains is trending downward. In other words, total employment is increasing, but at a slower pace than before.
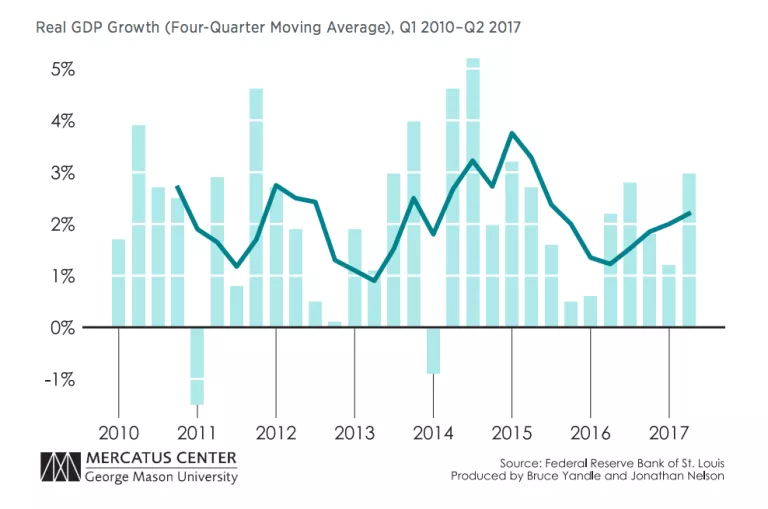
We see a larger picture in the accompanying GDP growth chart, which shows quarterly growth data along with a four-quarter moving average. Unlike the labor market counterpart, real GDP growth is definitely improving at a slightly better rate. It’s that second derivative that causes concern for those who worry about the possibilities of a mild 2018 or 2019 recession. Meanwhile, GDP growth has demonstrated the 3.0 percent hoped for by the Trump administration in its 2019 budget. Perhaps with a failed effort to repeal and replace the Affordable Care Act, we will see serious work on tax reform, which could give a bit of new juice to the economy. Treasury Secretary Mnuchin vowed that meaningful tax reform would come within the year: “We will have success. This is a pass/fail exercise and we will pass tax reform, period.”
What about the Fed?
But what about the Fed? Will we see more interest rate increases and actions taken to unwind the Fed’s recession-swollen balance sheet? Yes and yes. The question, of course, is when and how fast. At the June and July meetings, the Federal Reserve Open Market Committee kept its powder dry, and pulled no triggers. In June the GDP implicit deflator, a closely watched inflation indicator, was sailing along at a 2 percent annual rate, the boundary that marks the beginning of Fed heartburn. Most folks in the guessing business thought inflation would continue an upward trek. But wouldn’t you know, the deflator turned south and is now pacing along at around 1.5 percent. The US-led fracking revolution and the expanding sharing economy are apparently still shifting supply curves to the right. Taken together, these two revolutions generate more production from the existing stock of capital assets, and that brings a much-desired nudge toward prosperity.
At this point, the Fed seems to be relaxed; there was no July rate increase, and there will not likely be one in September. Meanwhile, the Fed will likely allow its balance sheet to unwind on its own, without replacing bonds that mature. A December hike? What happens on the employment and inflation front will be determining factors. By then, we may see the effects of higher wages interacting with a large supply of money. We saw a hint of wage inflation in the July employment report’s comment on wage growth. Now running at 2.5 percent annually, wages are rising again, and that may be enough for the Fed to pull the trigger on interest rates when December rolls around.
Better Days Ahead?
Yes, we are seeing some improved data. Indeed, in a fit of optimism, the Fed Open Market Committee announced in June a higher GDP growth forecast. I hope you are sitting. The Fed raised the estimate from 2.1 percent to 2.2 percent. Gasp! Is this really big stuff or what? Not to be outdone, the International Monetary Fund reduced its US GDP growth estimate. Guessing that Mr. Trump will fail to implement his tax reform and his infrastructure spending program, the IMF cut its 2017 estimate for the US from 2.3 percent to 2.1 percent. When all is said and done, the world continues to look flat. I expect we will see 2.1 percent growth for 2017 and perhaps a bit better in 2018.
The Geographic Imprint
Anyone making a long US road trip can delight in the beauty of the scenic countryside after steering away from the traffic snarls of cities. By observation, long trips can give one a sense of the economic growth and change that is occurring across the US. When traveling off the interstates, one can see small towns where storefronts are being spruced up and others where much of main street is shuttered.
A few weeks ago, my wife, Dot, and I traveled by car from middle Georgia to Chautauqua, New York, a trip that involved crossing half of Georgia, the two Carolinas, Virginia, West Virginia, Pennsylvania, and a tiny part of New York. The scenery was spectacular. The secondary highways were wonderful. And the patterns of growth we observed as we toured small towns and rural areas were diverse. As evidenced by large commercial and road construction, some regions are enjoying fast-paced population growth. They can hardly keep up. Eye-popping apartment construction is underway. Shopping centers are expanding. For others, it is just the reverse. The roads are not being rolled up and stored, but retail shops are closed, and homes in many small townships are empty and deteriorating.
As always, people vote with their feet—not always well, but they do vote. The results of the votes are seen vividly in migration between the 50 states. The accompanying map, which I produced using the State of Oregon’s regional economics website, shows population growth across the years 1959–2015.
States colored in shades of blue are enjoying higher growth; those that are tan or brown are experiencing weak or negative growth. Texas, Utah, and North Dakota logged the highest population growth in the five-year tally. The Northeast and much of the Midwest experienced weak growth. The path Dot and I traveled in our trip carried us across states with 1.2 percent to 1.0 percent growth, as well as states with 0.6 percent growth and less.
When people vote with their feet, the migration results in an interesting regional population pattern. Consider the four major US regions: Northeast, South, Midwest, and West. The South, which by Census definition extends to include Texas, now has a larger population than the Northeast and Midwest combined. The West and South are the two regions experiencing the highest population growth.
Most of growth nationwide is occurring in larger urban areas. Since 2007, cities with more than one million residents have grown by 6.6 percent. Urban areas with 250,000 to one million people have grown by 3.4 percent. Nonurban area populations have fallen by 2.5 percent. The lesson? Two things, perhaps. Adam Smith taught us that the division of labor is limited to the extent of the market. Cities have become more attractive as occupations have become more specialized. It’s also the case that younger adults—at least those who are not living with family members—seek out an urban lifestyle. In the most recent 12-month period, four of the five fastest-growing large cities were located in Texas; the other was in South Carolina. Conroe, Texas, with a July 1, 2016–July 1, 2017, growth of 7.8 percent, led the pack. It was followed by Frisco, Texas, with 6.2 percent growth. McKinney, Texas, was number three—5.9 percent. Greenville, South Carolina, with 5.8 percent growth, was number four. And Georgetown, Texas, with 5.5 percent growth, was number five.
Deficits and Our Grandchildren
According to the Congressional Budget Office, the federal government will run a $693 billion deficit this year, up from $563 billion in March. Acting as if we have a gold-plated government credit card, we Americans buy more government services than we pay for. And guess what? We are encouraged to do so! After all, why should Medicaid be cut? Or housing subsidies? Or school lunch programs? Or flood-plain insurance? And why not build more highways, bridges, and treatment plants? Politicians tell us these are good things. They provide needed benefits and often produce jobs.
We continue to run deficits. As my second grade teacher might have put it, this shows a lack of self-control. But it’s worse than that. We even criticize elected officials who, in a rare moment of self-control frenzy, dare to cut spending on someone’s favorite program.
But we are not talking about an occasional blast of red ink. On the basis of projected spending and revenue estimates, the US government will run an annual deficit each year for the next 30 years. By 2027, just 10 years from now, the projected debt will be 91 percent of GDP—nearly our entire annual product—up from 31.7 percent in 1981. The 2017 share will be 77 percent, the highest since World War II. It’s been quite a ride.
But we aren’t borrowing to win a war or save the world. We are borrowing to support activities we once paid for the old-fashioned way, with our own earnings. There was a tougher time when families with their own money paid the corner grocer, the landlord, their doctors bills, and college loans, or they declared bankruptcy. Shifting some of these activities to the government and calling them entitlements has made it possible for all of us to consume more and pay less, or not at all.
Is there some distant Santa Claus or another rich benefactor who someday will pay off our government credit card balance? Or will we just go bust with one huge bang?
In a recent study of federal government fiscal policy, Jody Lipford, a Presbyterian College economist, and I inspected data for the years 1979 to 2013 for US taxpayers divided by income into five groups. When we looked at taxes paid as a share of market income, we found that the share fell from 1979 to 2013 for all five quintiles, with the decline progressively smaller when moving from the lowest to the highest income group. With the exception of the surplus years of 1999 and 2000, the federal government was able to cut taxes but was unable to generate enough income to pay the bills. As a nation, we just kept on borrowing to cover our government-provided consumption benefits.
Lipford and I then asked the hard question. Who will bail us out? Our answer? The forgotten man and woman—in this case, the unborn, or the future hard-working individuals who will pay more taxes and enjoy fewer government benefits while paying down the debt they inherit from our generation. William Graham Sumner, the Yale professor and originator of the metaphor, in 1876 described the Forgotten Man this way:
He works, he votes, generally he prays—but he always pays—yes, above all, he pays. He does not want an office; his name never gets into the newspaper except when he gets married or dies. He keeps production going on. He contributes to the strength of parties. He is flattered before election. He is strongly patriotic. He is wanted, whenever, in his little circle, there is work to be done or counsel to be given. He may grumble some occasionally to his wife and family, but he does not frequent the grocery or talk politics at the tavern. Consequently, he is forgotten.
So why doesn’t the Washington deficit machine stop? Because those unborn taxpayers have no voice in the matter, and the rest of us and our public servants are enjoying the ride without having to pay for it. But when will it end? There are too many moving parts to the story for anyone to know. This said, we can still foresee a time when continued consumption on credit will become extraordinarily difficult; when the interest cost of the debt becomes so large that, after paying the interest bill, Social Security, and funding healthcare, nothing will be left to pay for the rest of government. According to the Congressional Budget Office, that will be the picture in 2047. We have about 25 or 30 more years to go before the ride gets bumpy.
The Transitional Gains Trap and Obamacare
After the Republican leadership’s failed effort to pass a “skinny” replacement for the Affordable Care Act, there was no lack of finger pointing and ad hoc theorizing as to what went wrong. Naturally, the Republicans blamed the Democrats, the House of Representatives blamed the Senate, administration loyalists blamed renegades, and lots of commentators blamed the president. None that I know of dared to turn to economic theory for a bit of insight. After all, economic logic doesn’t make for good six o’clock news headlines. There is a simple explanation for why Senate Republicans faced such challenges in revising America’s healthcare programs, or, for that matter, why any party would face the same challenges. Let me explain.
In 1975, the late George Mason University economist Gordon Tullock wrote a short paper that became a niche classic in Public Choice economics, a specialty field that applies economic logic to political decision making. Titled “The Transitional Gains Trap,” Tullock’s piece, in simple language, explained why it seems impossible to revise major laws and regulations that initially give advantage or subsidies to well-identified individuals and groups.
To make his point, Tullock described the New York City system of taxicab medallions. These are licenses that must be purchased by each cabby who wishes to operate on the city’s streets. First required in 1937, the medallions were issued for a fee of $10 to the then-13,437 cab operators. Meanwhile, the population grew, as did demand for transportation services, as did fares. Most recently, one of the limited number of medallions sold for $475,000. In 2014, prior to the full impact of Uber and Lyft, they were fetching more than $1 million.
Obviously, those individuals and their heirs who obtained medallions for $10 earned a nice windfall. But later cab operators who purchased permits are lucky to have earned a normal return on their investments. Think about the ones who paid $1 million in 2014.
Now to Tullock’s point. Suppose a new mayor were to call for regulatory reform, do away with medallions, and allow the free market—Uber, Lyft, and anyone else fit and ready—to serve the public. Medallion elimination would translate to lower fares. The unorganized cab riders of the world would rejoice.
Who would object the loudest? The highly organized medallion owners, of course, many of whom would go bankrupt. Medallion values are capitalized into the business. No one is getting rich because of them.
Now back to healthcare reform. The 2010 Affordable Care Act established a complex system of rules to be met by all who operate in America’s healthcare sector. Forms of insurance are regulated, as is who can purchase it and what they pay. Subsidies are paid to well-identified people and organizations. Services provided by hospitals are regulated, along with reimbursement rates. And, of course, the Medicaid services doctors provide are regulated.
All the players have adjusted to the rules, more or less. And after a hard adjustment process, the surviving players are earning at least a normal return. Even though premiums are rising, generally speaking, no group is getting rich off the ACA.
Now to the obvious. When proposals are made to sharply revise the ACA, who screams the loudest? Answer: Those who are funded by it. The American Medical Association, the association of medical universities, the American Hospital Association, and AARP, which appeals for its currently subsidized members.
Tullock’s point is simple but profound. Once a government-sponsored institution is in place—or a privately developed institution, for that matter—the world adjusts to it, and even though something better may be designed, those invested in the existing institution will be harmed by the transition. They are trapped. The ordeal of change is painful. And the better they are organized, the louder the cries that are amplified on the evening news.
America's Disappearing Capitalism
Recent research from the University of Chicago’s Center for Research in Security Prices reported on in the Wall Street Journal indicates that more than half of all publicly traded companies have disappeared in the last 20 years. In 1997 there were 7,355 exchange-listed firms; today there are less than 3,600. According to the report, most of listed-firm decline, which occurred across the years 2000 to 2012, began in 2002 when Sarbanes-Oxley (S-O) was passed. S-O significantly increased the reporting burden and officer liabilities for listed firms. The authors also report that the average market-capitalized value of exchange-listed firms has risen from $620 million in 1979 to $6.8 billion in 2016 (both in 2016 dollars). In addition, the average age of listed firms has risen from 10.9 years to 18.4 years. Simply put, today’s marketplace is dominated by large, mature firms. Is this the twilight of American capitalism? Or just evidence of a sleepwalking, regulation-entangled economy?
When I dug a bit deeper, I found that data from the Kauffman Foundation on new businesses starts offer a parallel picture of declining capitalism. In 2000, there were approximately 190 new starts per 100,000 people in the country. By 2012, the count had fallen to 133, a 30 percent decline. Of course, the Great Recession effects are hidden in the data, so we must be careful in arriving at a capitalism-related conclusion. But there are also estimates of the size of the US underground economy to consider. These are sometimes based on the count of $100 bills per capita that circulate in the economy. That count has risen sharply since 2008. Going underground is surely a way to escape regulation as well as taxation. But has the regulatory burden risen significantly since 2000?
Examination of the annual count of major federal regulations sheds a bit of light on the matter. Federal regulatory agencies are required to give special attention to rules that impose costs on the economy of $100 million or more annually. More costly rules generally translate into less productivity or a sleepwalking economy. But they can also give advantage to existing larger firms that enjoy economies of scale in dealing with the government. Work by George Washington University’s Regulatory Studies Center on the number of major rules published each presidential year from 1996 to 2015 shows a sharp increase in regulation that began in 2008, when more than 100 major rules were placed on the books. That’s 100 times at least $100 million in costs each year for as long as those rules are in effect.
There’s yet one more piece of evidence to consider as we think about America’s brand of disappearing capitalism. Data from the Small Business Administration reports the annual exit rate of firms from the economy from 1990 through 2011. After around 2000, the exit rate of firms with 500 or more employees plummeted. Somehow, life got better for them. Fewer exits also mean fewer new replacements, which may translate to a smaller number of exchange-listed firms. But the exit pace for firms with 20 or fewer workers was pretty much constant. The implication is that larger firms are prospering relative to their smaller cousins, and doing so in the face of growing regulation or perhaps because of it.
When examined together, these fragmented pieces of data support the notion that America’s capitalism has indeed changed; it has become entangled with regulation. An entangled economy produces less stuff, moves slower, and rewards those who can make politics work for them—all the more reason to push for regulatory reform.
What Makes for Success?
Earlier this year, I had the opportunity to give a keynote talk on the occasion of the 70th anniversary of a Georgia industrial machinery company, a firm with some 300 employees working in five states. The invitation to speak at the firm’s Jekyll Island sales meeting and celebration was pretty special to me. The business had started in 1947. I went to work with the firm in 1952, part-time, when I was a sophomore in college. As was often said in those days, “I was working my way through college.” It was not an unusual way of life in post–World War II America. On my first day at work, the firm had 8.5 employees—I was the 0.5. That year, the business, with 2016 revenues exceeding $100 million, had sales of $300,000, about $3 million in today’s money. I stayed with the company, working afternoons and summers till graduating from college, then worked for another 15 years, becoming part owner along the way.
The company’s founder was a generous man, who enjoyed success himself, but also got unusual pleasure from seeing other folks succeed. He was more than a boss or partner to me; he was a special mentor and friend. My keynote talk contained an economic situation report that went back to 1947, came forward to the present, and offered thoughts on the future for firms that flourish with industrial activity.
A few weeks after the 70th celebration, I swapped messages about the experience with a good friend who has a special passion for industrial development. She was not aware of this early pre-academic chapter in my life, and, on hearing about the celebration, commented on the remarkable life span and success of the closely-held business, and asked the right question: What accounts for the success? What are the keys that unlock the door to prosperity?
I had thought a lot about that question as I prepared my remarks on the firm’s life story. Could I distill the answer to the question—what accounts for success?—into a few words? In replying to my friend, I take a shot at it. Of course, we are talking about a person—a man who formed and led a company for his entire life, and who, along the way, prepared and attracted others who would fill key company positions. As I thought of words and phrases that I felt captured the key ingredients—the keys to his success—my mind went to the teachings of Napoleon Hill, the renowned author of Think and Grow Rich, that 1937 best-selling classic dedicated to answering the very question I was considering. I wrote down Hill’s first key to success: having a definiteness of purpose. The leader of the firm I was celebrating was dedicated to serving some specialized needs of industry; he knew where he was headed—broadly speaking—and was patient in getting there, was uncompromising in his commitment to future prosperity, and was unrelenting in his commitment of time, energy, and thought to the project. That’s item one: definiteness of purpose.
Item two? The principal owner was a fact-based, long-run player. He had a big heart and a sharp pencil. In fact, he could perform routine accounting assessments on the back of an envelope, and enjoyed doing so. He knew that success called for building long-term relationships and cultivating them, for customers as well as employees. This meant always performing as well as promised, if not better; and that meant rewarding people—the ultimate resource—for their individual performance. To the extent possible, each individual employee’s future was linked to the firm’s future, and the links were based on real stuff. There was no mystery about how performance was measured.
The third trait? The successful boss understood way ahead of his time that new businesses and major innovations are constantly being born in the back shops, offices, and coffee rooms of existing businesses. He encouraged trying out new ideas, was willing to risk capital on innovative ventures, and was happy to give creative employees a piece of action. Sometimes those ventures failed, big time, but more often than not, they succeeded. This suggests luck is part of a success story—and it is. But as Harold Geneen of ITT fame once said, If you work 60 hours a week, you’ll start getting lucky. On the other hand, making good choices may reflect having a certain kind of wisdom that goes with having a definiteness of purpose.
There is one more thing that should be added as the fourth business leadership trait that makes for prosperity: building a “do-the-right-thing” culture, and showing by example the meaning of “right thing.”
There are countless successful firms that form the engine of America’s economy, each with its own story of good and tough times. Many of these successful firms have leaders, owners, and bosses, who have a definiteness of purpose, who know that long-run outcomes have to trump short-term gains, and who give coworkers and employees freedom to act on their own in taking steps to improve the firm’s performance. They know, fundamentally, that their firm succeeds when their customers succeed. And they know that means remembering to try to do the right thing.
The State Spotlight: Michigan's Economic Situation
Patrick A. McLaughlin, Senior Research Fellow, Director of the Program for Economic Research on Regulation Mercatus Center at George Mason University
Jonathan Nelson, Program Associate, Mercatus Center at George Mason University
The State Spotlight is a newsletter regular feature. In June we focused on Oregon, one of the nation’s strongest manufacturing economies and a favored destination for families looking for a place to call home. We now put the spotlight on Michigan, a transition state with a strong heartbeat.
Michigan is known primarily as the cradle of the US auto industry, but also for strength in food and chemical manufacturing. Because of its specialization, the Michigan economy has experienced large employment swings in association with national recessions. In the midst of the 1982 recession, Michigan’s total employment stood at 3.1 million workers. As recovery took hold, the state’s strong manufacturing economy accelerated. By 2000, employment rose to an all-time high of 4.7 million. Recessions and losses of auto manufacturing jobs that followed took their toll on state payrolls. By 2010, employment had fallen to 3.8 million, but when the books were closed for 2016, total workers had risen to 4.4 million. The return trip from the year 2000 had taken 16 years.
The Current Picture
Current state data reflect a resilient, highly skilled workforce. The state of Michigan’s personal income grew by 3.6 percent from 2015 to 2016, equal to the nation’s growth rate. While the state is enjoying what could be considered a period of average economic growth, it has recovered very well since the recession. Even more impressive, the state has made a significant return following its automotive heyday. In the chart below, we can see the 20-year roller coaster that is Michigan’s real personal income. After stagnation throughout the first decade after 2000 and the recession in 2008–2009, Michigan’s real personal income per capita has greatly increased in the years since the recession.
Even after the shift of auto production to the south , Michigan is still among the nation’s strongest manufacturing states, ranking 5th nationwide in manufacturing’s share of GDP. In 2016, manufacturing accounted for 19.2 percent of the state’s GDP, as compared with the nation’s 11.8 percent. Manufacturing also employed 15.1 percent of the state’s workers. Despite its relatively strong manufacturing sector, Michigan has seen the share decline in the last 20 years. In 1997, manufacturing’s share of GDP was 24.4 percent, and in 2007 it was 19.5 percent. Unsurprisingly, the automotive manufacturing sector still leads the state’s manufacturing category. The automotive sector directly employs over 10 percent of the total workforce, which is more than 500,000 workers.
As in many other states, the healthcare and social assistance sector is a leading industry in Michigan. With 15.1 percent of the state’s workers, the sector is the state’s largest employer. Professional and business services is also a leading sector. Employment in both government and manufacturing have declined in the last 20 years, while healthcare and professional services have begun replacing them, as seen in the chart below.
The state ranks 20th among the 50 states in educational attainment, with 90.1 percent of the adult population having graduated from high school. The state ranks 31st in median household income. The state’s unemployment rate has continued to fall since the 2008 recession, having reached a 16-year low of 4.7 percent in April 2017. In terms of overall fiscal solvency, the state government of Michigan ranks 34th in the nation in 2017, according to the State Fiscal Rankings project by the Mercatus Center at George Mason University. It has one of the lowest government debt-to-personal-income ratios in the nation, at 1.7 percent.
What about the future economy? The Philadelphia Federal Reserve Bank’s state leading indicator, which assesses prospects for the next six months, assigns a strong positive outlook for the state. A deeper assessment of future prospects relates to the extent to which a transition is being made toward the emerging knowledge economy. The 2014 New Economy Index produced by the Information Technology and Innovation Foundation provides this broader assessment. The foundation’s most recent report shows Michigan ranks near the top of the 50 states with respect to innovation capacity and size of the digital economy. The state ranks in the middle with respect to knowledge jobs and globalization. Overall, Michigan ranks 18th among the 50 states in making the transition to the new economy. According to the Brookings Institution’s study of 2013–2015 employment in advanced manufacturing, Michigan takes first place.
Michigan’s Regulatory Outlook
Another key piece of the puzzle that is Michigan’s economic future is the state’s regulatory condition. The RegData project at the Mercatus Center at George Mason University, which initially focused on the quantification of federal regulations, has recently expanded in scope to include state regulations. The RegData project’s measurement of the restrictiveness of the regulatory text in the Michigan Administrative Code, which contains over 4.6 million words, revealed that 83,484 regulatory restrictions are currently on the books in the state. Michigan’s tally of restrictions falls below the median number of restrictions (131,335). In fact, Michigan has the second-fewest restrictions of the 12 states that have been analyzed so far. For the sake of comparison, New York weighs in the most restrictions in its administrative code of the 12 states covered so far, with 307,636 restrictions, while Arizona has the fewest, with 63,919.
The RegData inventory also identified the industries in Michigan to which those restrictions apply. The five industries with the greatest number of relevant restrictions are chemical manufacturing (2,631 restrictions), utilities (2,453 restrictions), animal production and aquaculture (1,852 restrictions), construction of buildings (1,546 restrictions), and food manufacturing (1,458 restrictions).
Of course, there is always interplay between state and federal regulations. For example, chemical manufacturing is highly regulated at both the federal and state level. There are 100,119 federal restrictions along with the 2,631 Michigan state-level restrictions. Although it is often the case that state regulations are required by federal agencies, a first step toward regulatory reform can be taken by pulling back the regulatory curtain, reexamining the full array of regulations, identifying all rules that can no longer be justified or are no longer needed, and updating accordingly.
Michigan’s economy rests on a solid human and physical capital foundation. Although regulation imposes a potentially heavy burden, the state’s future prospects are still positive.
From Yandle's Reading Table
If you are like me, you know there was a terrible agricultural catastrophe called the Dust Bowl that occurred in the late 1920s. You may know that it was most destructive in the Texas and Oklahoma panhandle, and that John Steinbeck’s The Grapes of Wrath was based on the plight of Okies who somehow escaped it all and made it to California. This was the Cliffs Notes version of what I knew about the dust bowl until I read Timothy Egan’s 2006 The Worst Hard Time (Boston: Houghton Mifflin, 2006). And what a story it is.
Egan organizes his masterfully told story into the three periods: “Promise: The Great Plowup, 1901–1930,” “Betrayal, 1931–1933,” and “Blowup, 1934–1939.” Here we learn about an amazing recruitment of settlers from as far away as Russia to take a section of high plains public grassland, make a home, plow the land, and plant wheat to feed World War I’s devastated nations. In some cases, the promoters were the railroads, in others the federal government, and in still others, local land developers.
The promoters showed European families pictures of cities that did not even exist, described to American farmers theories of rainfall that had never been tested, and successfully brought settlers who, collectively, in a matter of a few years, put millions of acres to the plow. As luck would have it, the rain came—at least initially—and enough to produce bumper wheat crops that were shipped to world markets. Rising wheat prices brought prosperity, tractors, cars, more families, and more plowing. Some of the make-believe towns in the earlier promotional brochures became real.
But when falling prices threatened all this, and rainfall simply was no more, the wheat farmers doubled down, plowed more land, and hoped that volume would make up for the losses. It just didn’t work out that way. But tens of millions of acres of top soil were exposed for the first time in thousands of years as the grassland was converted to wheat land and then to desert, all in a period of 30 years. The exposed soil became deadly, abrasive dust, captured by massive winds and black clouds that slowly destroyed farms, killed children, and darkened cities as far away as New York. It was the worst of hard times, and the scars that were formed can be seen to this day. The Worst Hard Times is a powerful read.
The Bureaucrat Kings: The Origins and Underpinnings of America’s Bureaucratic State (Santa Barbara, CA: Praeger, 2017) is an excellent book for those who seek a better understanding of the social forces that led to the development of the US government’s fourth branch—the administrative state—that regulates life in America. Paul Moreno also provides a boon for those who hold out hope for a strengthening of the constitutional order. Why do I call it excellent? First of all, it is well written and a pleasure to read. Second, it is creatively organized; it provides the reader with a combination of the historical and political-economic forces that produced three large waves of regulatory activity. Finally, the book is well researched and heavily documented. It is definitely not a polemic, but the author’s normative values do shine through. I note that the footnotes and references provide a network of avenues for further education on the topic.
After my first reading, it occurred to me that The Bureaucrat Kings is an excellent companion to Bruce Ackerman’s The Decline and Fall of the American Republic (Cambridge: Belknap Press of Harvard University Press, 2010). While Ackerman describes major institutional changes that have concentrated political power in the executive branch and thus have strengthened the hand of executive branch regulators, Moreno explains how regulatory power and reach have been enhanced. Both works are example of positive analysis motivated by normative concerns.
Along the way, the reader encounters literary gems that cause one to pause, maybe even to jot down notes, and certainly to read a second time. To illustrate, I offer a sample from Alexis de Tocqueville’s discussion of a form of “administrative despotism” that could be produced by a modern democracy. Taken to the extreme,
The sovereign power extends its arms over the entire society; it covers the surface of society with a network of small, complicated, minute and uniform rules, which the most original minds and the most vigorous souls cannot break through . . . ; it does not break wills, but it softens them, bends them and directs them; it rarely forces action, but it constantly opposes your acting; it does not destroy, it prevents birth; it does not tyrannize, it hinders, it represses, it enervates, it extinguishes, it stupefies, and finally it reduces each nation to being nothing more than a flock of timid and industrious animals, of which government is the shepherd.
Gasp! One wonders what Tocqueville would make of 80,000 annual Federal Register pages.
I suppose it is understandable that I would most appreciate Moreno’s treatment of the 1975–2010 fourth wave of regulation, the wave that involved most of my professional career. This chapter reminds us that the post-Watergate period began with congressional reshuffling of powers away from the executive branch. Attempts to obtain legislative veto power and formation of the Congressional Budget Office are two examples of this reshuffling. Stagflation and losses of consumer wellbeing then fed an executive branch effort to show how anticompetitive forces of regulation could contribute to the nation’s ills. Regulatory reform became the cause du jour during the Ford, Carter, and Reagan administrations. As a result, two of the older economic regulators—the Interstate Commerce Commission and Civil Aeronautics Board—went out of business. Other economic regulatory activities from banking, to natural gas, to telecommunications were sharply revised. For a rare time in modern history, liberal politicians joined with their more market-oriented political cousins in supporting regulatory reductions in the name of enhanced consumer well-being. But while economic regulation was fading fast, social regulation that covered actions focused on the environment and safety and health was exploding.
Is there an escape hatch, a way to refresh the constitutional republic and constrain the expanding regulatory state? In his final chapter, Moreno discusses several avenues that could lead to meaningful reform, but ultimately leaves the reader without a GPS that may guide one to a classical liberal’s paradise. Instead, he closes by calling on the Federalist No. 1 and reminding us that “the American people were the first people in history to be able to establish a government ‘from reflection and choice,’ and not to ‘depend for their political constitution on accident and force.’ The people need to reflect and choose—to think and vote—and I hope that this history will help them to do so.”
I recommend the book.
The recent White House leadership upheaval that dismissed Reince Priebus and brought General John Kelly to Mr. Trump’s chief of staff position causes Chris Whipple’s The Gatekeepers: How the White House Chiefs of Staff Define Every Presidency (New York: Crown, 2017) to become a hot property. Whipple’s fascinating book gives solid treatment to chiefs of staff from the time of Richard Nixon’s H. R. Halderman to Gerald Ford’s Donald Rumsfeld and Dick Cheney, and on to Barack Obama’s Rahm Emanuel, William Daley, Jacob Lew, and Denis McDonough.
The book begins with a December 2008 episode shortly after Barack Obama’s election that brought together 12 former presidential chiefs of staff. Mr. Obama initiated the gathering in an attempt to learn what he could from past successes and failures. With obvious sparks in the air and an expected amount of one-upsmanship, each former chief was invited to offer brief comments about his experience. Starting with Ronald Reagan’s Ken Duberstein, words of advice flowed smoothly. “Always remember,” Duberstein said, “that when you open your mouth, it is not you but the president who is speaking.” Jack Watson, who some credit with salvaging a failing Carter presidency, advised, “Never forget the extraordinary opportunity you’ve been given to serve, and the privilege and responsibility that it represents.” We might remember that Watson was a former Marine officer who took charge of chaos and organized a smoothly operating White House staff.
Leon Panetta, Bill Clinton’s second chief of staff, told the group that when speaking with the president, “Always tell him what he may not want to hear—because frankly, a lot people in the White House will always tell the president what he wants to hear.” While much of the talk that day was about as exciting as reading Poor Richard’s Almanac, Whipple uses the episode to launch insightful and critical comments about the javelin catchers who attempted to work successfully in perhaps the world’s hottest management pressure cooker.
Whipple’s account of some of the more dramatic While House moments helps the reader remember just how impressively President Reagan’s James Baker, also a former Marine officer, performed, as well as how unfortunate Baker’s successor, Donald Regan—another Marine officer—turned out to be. Nancy Reagan was Regan’s nemesis. It may be remembered that Regan made the mistake of hanging up on the First Lady when she called to question his judgment in a White House decision. The advice to all afterward was clear: never hang up on the First Lady.
Throughout the book, Whipple helps the reader grasp the multitude of pressures—political, professional, and personal—that play across a chief of staff’s desk, and also how the personal ambitions of some chiefs of staff loom so large that their presidents at times become their pawns.
It’s a good read.

