- | Healthcare Healthcare
- | Policy Briefs Policy Briefs
- |
Federal Medicaid Funding Needs an Overhaul: Evidence in 10 Graphs
THE FEDERAL ROLE IN MEDICAID FINANCING
Medicaid is the largest health insurer in the United States. Created in 1965, the program now covers about 85 million low-income Americans at an annual cost of more than $700 billion. [1] Although Medicaid is largely structured and operated by the states, the federal government contributes the majority of the program’s funding. State payments accounted for 31 percent of total Medicaid spending in 2021; the federal government paid 69 percent. Those proportions vary dramatically by state, however. Most federal Medicaid dollars are distributed to states on the basis of a formula that provides more (or less) assistance to states with low (or high) average personal income relative to the national average. The Federal Medical Assistance Percentage (FMAP), which is the share of Medicaid benefit spending covered by the federal government, generally ranges from 50 percent (the statutory minimum) to about 78 percent, depending on the state. Over the decades, however, federal rules governing Medicaid funding have grown complex, with special treatment given to certain groups and service categories. For example, states that expanded Medicaid under the Affordable Care Act (ACA) to cover all low-income, non-elderly adults receive a fixed FMAP for these enrollees that exceeds the FMAP for most other Medicaid-eligible populations. This policy brief considers whether the federal government’s involvement in Medicaid, which was meant to promote equitable funding between the states, has its intended effect.
Disparities in federal Medicaid allocations are not trivial. In 2016, Medicaid accounted for 28.7 percent of state government spending from all sources (including federal payments) and 19.6 percent of spending from state general funds. [2] In most states, the only budget category more costly than Medicaid is K–12 education. Consequently, even small shifts in federal Medicaid payments can affect other state spending priorities.
In devising the federal government’s role in Medicaid funding, Congress sought to address the fact that states have starkly different populations, health challenges, and revenue sources. Prior to the creation of Medicaid, healthcare services for the indigent were provided primarily through a patchwork of programs funded by state or local governments, charities, or community hospitals. [3] Eligibility standards and benefits packages varied greatly, determined as much by fiscal constraints as by cultural attitudes about helping the poor. In the 1960s, federal policymakers recognized that establishing a basic healthcare safety net throughout the nation, while equalizing the state tax burdens needed to support such a program, required financial intervention by the federal government. In excavating Medicaid’s legislative history, the Government Accountability Office (GAO) cites US Senate reports dating back to the 1940s that emphasize the need for variable rate funding formulas pegged to a measure of state need. A US Senate report from the 1940s noted the following:
Federal grants-in-aid for public assistance are intended to help in aiding the aged and blind persons and dependent children in all parts of the country and to some extent to equalize the financial burden throughout the Nation. The present [fixed level] of Federal participation does not recognize differences in the ability of States to finance public assistance, nor does it recognize the greater incidence of poverty in States with low economic resources. To assist their needy people, the low income States must make greater tax effort than States with larger resources where relatively fewer persons are in need. [4]
These efforts to adjust federal Medicaid aid on the basis of state needs have had profound effects. Even after controlling for the number of people in poverty, some states receive substantially more federal Medicaid funding than others. The histogram in figure 1 shows this distribution in 2019 for the 50 states and the District of Columbia. At the low end, Georgia received less than $5,000 in federal Medicaid funding for each person below the poverty line. At the other extreme, Alaska and the District of Columbia each received more than $20,000.
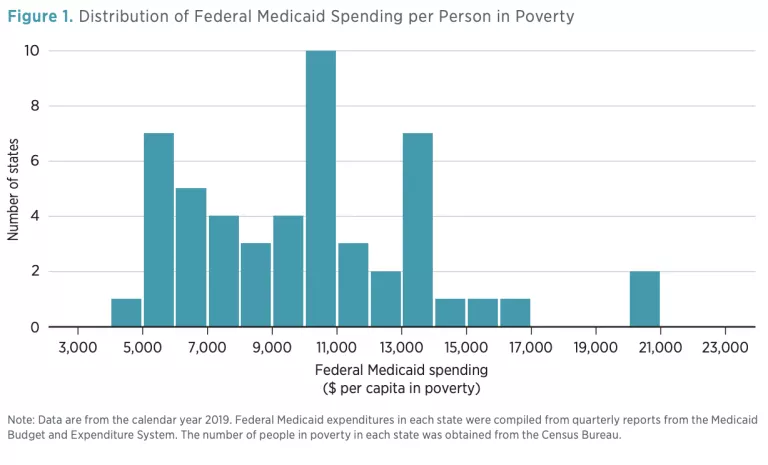
The vast differences between states, as shown in figure 1, could be desirable if larger federal subsidies were directed to states that have more severe health needs, higher costs for medical services, or more limited means of generating revenues. Each of these factors would increase the cost of a state’s Medicaid program and provide a rationale for the federal government to direct additional fiscal aid to that state. This brief provides simple descriptive evidence that casts doubt on these potential justifications. Across a wide range of measures, it concludes that Medicaid’s current financing structure often undermines Congress’s intent to use federal funds to equalize state contributions to Medicaid.
FEDERAL MEDICAID FUNDING DOES NOT GENERALLY FLOW TO THE NEEDIEST STATES
This section presents nine additional graphs to show that federal Medicaid assistance to states is often poorly targeted.
A Note on Methodology
The data presented are mostly in the form of scatter plots that show the relationship between federal Medicaid spending (per person in poverty) and some other variable of interest.
All data represent the calendar year 2019. Although more recent data are (in most cases) available, drawing on later years could contaminate the analysis with the effects of the COVID-19 pandemic and the government response to that crisis. In particular, Congress substantially increased federal Medicaid payments to states in 2020; many other measures—including mortality rates and state fiscal resources—were deeply affected by the pandemic. Medicaid’s future is more likely to look like 2019 than the 2020–22 era.
In this analysis, I define the independent variable (plotted on the y-axis) as the total amount of federal Medicaid money received by a state, divided by the number of residents of the state living below the federal poverty line. (In 2019, this income threshold corresponded to about $12,500/ year for a single adult and $25,800/year for a family of four.) Hereafter, I will refer to this variable as federal Medicaid assistance.
Each of the following three subsections focuses on one possible justification for providing substantially greater federal Medicaid subsidies to some states than to others, even after controlling for differences in the size of the poor population: (a) fiscal resources (i.e., perhaps the federal government provides additional support to states with small tax bases); (b) health needs (i.e., perhaps the federal government provides additional support to states with sicker low-income populations); and (c) healthcare prices (i.e., perhaps the federal government provides additional support to states with higher prices for healthcare services).
Fiscal Resources
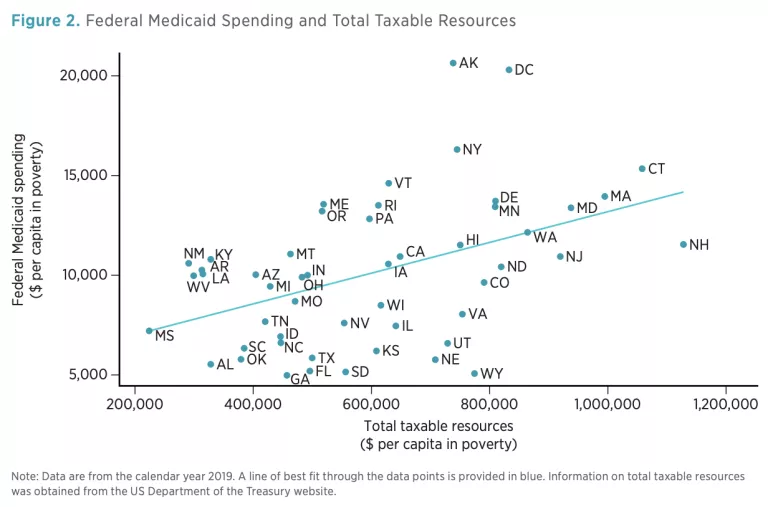
To assess whether the distribution of federal Medicaid dollars is related to state fiscal capacity, I begin by exploring the correlation between federal Medicaid assistance and total taxable resources (TTR) per person in poverty. TTR is a comprehensive measure of taxable income, including wages, dividends, capital gains, pensions, and corporate profits; it is compiled annually by the US Department of the Treasury. Importantly, TTR is unrelated to a state’s current tax regime; it captures all state income, regardless of whether the state imposes taxes on that income. Thus, TTR serves as an objective measure of the ability of a state to generate its own resources and finance its own social safety net without needing to appeal to the federal government.
Figure 2 plots the relationship between federal Medicaid assistance and TTR per person in poverty. Despite substantial variability, the trend is clear: federal aid consistently increases as TTR rises. Mississippi, with a TTR per person in poverty of only $224,000, received only $7,200 in federal Medicaid funds per person in poverty. By contrast, Connecticut ranked near the top of TTR per person in poverty, yet it received more than twice as much federal Medicaid funding per person in poverty as Mississippi received.
Although a useful measure of fiscal capacity, TTR admittedly does not reflect actual resources at the disposal of state policymakers. Jurisdictions across the country vary widely in their tax structures and rates; these variations have a substantial effect on state revenues. An alternative approach is to compare federal Medicaid assistance to states’ current own-source revenues (including taxes, fines, fees, and other levies) per person in poverty. This approach (depicted in figure 3) yields similar results. Albeit weaker than that seen in figure 2, a positive association is still found: states with higher revenues tend to receive higher levels of federal Medicaid assistance.

Instead of compensating for differences in state fiscal capacity, the allocation of federal Medicaid funds amplifies them, providing relatively wealthy states with far more resources per person in poverty than it provides to relatively needy states.
Health Needs
Differences in federal Medicaid assistance could reflect state differences in the demand for healthcare services. Such differences could arise if low-income populations in some states had more health problems than did analogous groups in other states. For example, if a state’s Medicaid beneficiaries had sharply higher rates of cancer than did Medicaid beneficiaries in the rest of the country, it would be defensible for the federal government to dispatch additional Medicaid funding to that state in an effort to spare the taxpayers of that state an undue burden. This section examines whether federal Medicaid assistance is related to health needs. Accurately measuring health needs is difficult, however, and no single variable is likely to be satisfactory. Moreover, since Medicaid is targeted at a subset of low-income people (in the average state, less than 25 percent of the population is on Medicaid), it could be misleading to use broad health measures—such as life expectancy—derived from a state’s entire population.
To mitigate these concerns, I present data on three different measures of health or access to care. First, I use data from the Behavioral Risk Factor Surveillance System (BRFSS) to compute the proportion of adults [5] in poverty who report their general health as being “good,” “very good,” or “excellent” (the other options being “fair” and “poor”). Self-reporting is a common measure widely used to track population health [6] and is robustly correlated with objective health outcomes, including risky behaviors, hospitalization, and mortality. Figure 4 plots this measure against federal Medicaid assistance.
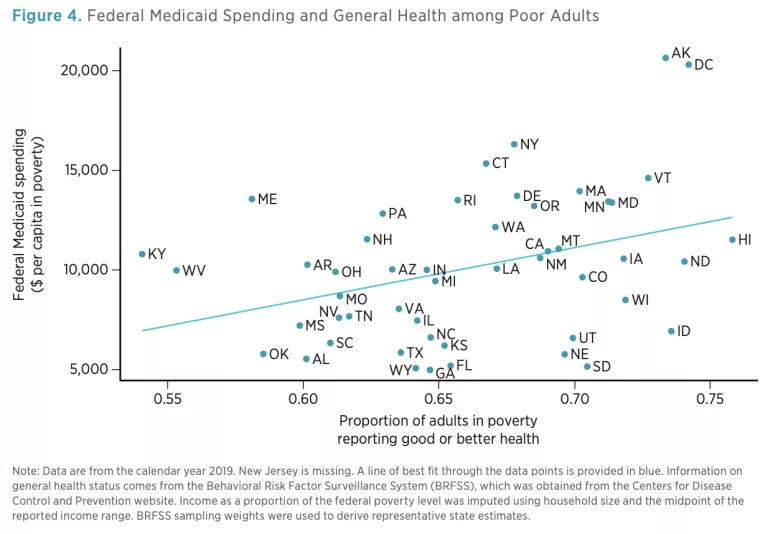
To the extent any relationship exists, states in which the poor adult population is in worse health tend to receive less federal support for Medicaid.
Second, I turn to an objective measure of health: rates of death. Mortality statistics in the United States do not include the income level, educational attainment, or other characteristics of the deceased that might be used to determine the likelihood that they were on Medicaid. To approximate the health of the low-income population, I focus on certain causes of death that tend to be highly concentrated among people with low socioeconomic status: (a) diabetes, (b) diseases of the circulatory system, (c) diseases of the digestive system, (d) stroke, (e) heart attack, and (f ) external factors (such as accidents). [7] Figure 5 plots the relationship between age-adjusted death rates from these causes and federal Medicaid assistance. Once again, we find that states with populations in worse health—in this case, characterized by high mortality rates—tend to receive less federal Medicaid funding.

Third, I consider the proportion of poor adults who report having a personal healthcare provider. This measure is commonly used to assess access to care. [8] Figure 6 shows that states in which a larger proportion of poor adults (in some cases as much as half ) report not having a personal healthcare provider tend to receive less federal Medicaid assistance.

Figures 4, 5, and 6 convey a consistent message: the correlation between a state’s health needs and federal Medicaid assistance is moderately strong, but in precisely the opposite direction than federal policymakers likely intended. States with relatively healthy low-income populations consistently receive more federal Medicaid assistance than states with less healthy low-income populations.
Healthcare Prices
Another reason the federal government might wish to provide more Medicaid funding to some states than to others is that healthcare prices vary substantially across geographic regions. Perhaps higher federal payments counteract these pricing differences, thus helping states to provide a similar bundle of goods and services to their Medicaid populations. Quantifying these differences is challenging, however, and reliable data are sparse. To my knowledge, there is no index of Medicaid price differences at the state level. To obtain a rough point of comparison, I instead use healthcare price information compiled by the Health Care Cost Institute (HCCI). This information is based on HCCI’s analysis of tens of millions of healthcare claims submitted on behalf of individuals under the age of 65 who received health insurance coverage through an employer. [9] HCCI publishes state-level price indices for four categories of healthcare: inpatient, outpatient, prescription drugs, and professional services.
Figure 7 plots each index against federal Medicaid assistance; each panel corresponds to a different category of healthcare. Each index is scaled so that a value of 1.00 represents the national average (e.g., a value of 1.20 indicates that prices are 20 percent higher than the national average). The price indices for outpatient services (panel B) and professional services (panel D) are virtually unrelated to federal Medicaid assistance; in both cases, the lines of best fit are essentially flat.

Prices for inpatient services (panel A) and prescription drugs (panel C) are positively correlated with the level of federal Medicaid assistance. In both cases, however, the data points take the shape of a cloud and are poorly modeled by a linear relationship. Moreover, average spending on inpatient services and prescription drugs accounts for less than 39 percent of total healthcare spending, according to HCCI’s estimates. Overall, higher healthcare prices are only weakly associated with enhanced federal Medicaid funding.
Effects of Uneven Adoption of Medicaid Expansion under the Affordable Care Act
Between 2014 and 2019, 33 states and the District of Columbia opted to expand their Medicaid programs under the ACA to cover all non-elderly adults with incomes below 138 percent of the federal poverty level. Medicaid enrollment subsequently grew rapidly in these states, with more than 19 million people—nearly one in four Medicaid enrollees nationwide—belonging to the expansion group in 2019. Seven additional states have expanded Medicaid since 2019.
The uneven adoption of Medicaid expansion has substantially widened the program’s federal funding gap between states. Expansion states receive an enhanced FMAP rate of at least 90 percent for medical expenses tied to the expansion group, compared to an average regular FMAP rate of about 60 percent for previously eligible enrollees. Moreover, the 10 states that have (thus far) declined to expand their Medicaid programs under the ACA tend to have higher poverty rates and greater health needs than do expansion states.
However, large disparities in federal Medicaid assistance exist even among the subset of states that expanded Medicaid under the ACA. For example, seven expansion states received less than $10,000 in federal Medicaid funding per person in poverty in 2019, while two states received more than $20,000. This unequal treatment is not well explained by differences in fiscal capacity or health needs or is only moderately related to differences in healthcare prices. Indeed, as with all states, the level of federal Medicaid assistance directed at expansion states is consistently inversely related to measures of taxable resources, own-source revenue, health status, and mortality.
Full adoption of Medicaid expansion across the country would likely narrow disparities in federal Medicaid assistance between states. However, large differences would remain, since holdout states tend to have higher regular FMAP rates than existing expansion states. Therefore, the relative increase in federal Medicaid funding that the holdout states would receive if they expanded is comparatively modest. In short, Medicaid expansion—even if implemented nationwide—would do little to realign federal Medicaid assistance with state needs.
Caveats
Simple bivariate relationships can sometimes be misleading, particularly when omitted factors exert influence over the measures being plotted. The comparisons in this brief necessarily ignore a great deal of nuance, including state variation in Medicaid eligibility rules and optional services covered by Medicaid. It is my hope that the preliminary evidence presented here will stimulate further, more rigorous inquiry.
Moreover, none of what I present should be given a causal interpretation. The purpose of this exercise is not to establish causality. Rather, its goal is to document that certain correlations between federal Medicaid funding and other relevant variables that one might wish to see (e.g., that states with sicker low-income populations receive more federal aid) do not exist in the data, suggesting that current funding mechanisms could be improved.
Finally, it is worth emphasizing that the evidence presented is agnostic about whether current total Medicaid spending levels are appropriate or desirable. It is impossible from these data to conclude that too much or too little federal money is being spent on Medicaid in the aggregate. Rather, my critique of the status quo is entirely about the allocation of existing federal Medicaid funds among the states.
HOW FEDERAL MEDICAID RESOURCES COULD BE BETTER TARGETED
Congress has many options for using federal Medicaid funds to promote the program’s aims more effectively:
- Revise the FMAP formula to include more accurate measures of state health needs, fiscal resources, and healthcare service prices. Currently, the FMAP formula is based entirely on average personal income, which does not adequately capture relevant state differences. Analysis by GAO, for example, suggests that substituting TTR for average personal income in the FMAP formula would substantially improve the targeting of federal funds. [10] Even further changes could be beneficial. An updated version of the FMAP formula could consist of a weighted average of several variables, each designed to measure one dimension of state need.
- Make costs associated with administering Medicaid—currently approximately 5 percent of total Medicaid expenditures—subject to the FMAP, instead of applying a flat federal match rate (usually 50 percent) on all states.
- Remove the arbitrary 50 percent minimum statutory FMAP level. Doing so would oblige wealthy states to shoulder a greater share of their Medicaid expenses. Other adjustments could be made to the FMAP formula to use these savings to enhance federal Medicaid assistance to states with higher needs.
- Gradually reduce the enhanced FMAP rate for expansion adults under the ACA to the regular FMAP rate. Since expansion states tend to be wealthier than non-expansion states, the enhanced expansion FMAP rate exacerbates existing funding inequalities.
NOTES
I thank Markus Bjoerkheim and Kofi Ampaabeng for helpful comments. All errors are my own.
- Congressional Research Service, “Medicaid: An Overview” (CRS Report 43357, Congressional Research Service, Washington, DC, February 8, 2023), https://crsreports.congress.gov/product/pdf/R/R43357.
- Medicaid and CHIP Payment and Access Commission (MACPAC), “Medicaid’s Share of State Budgets,” MACPAC, 2018, https://www.macpac.gov/subtopic/medicaids-share-of-state-budgets/.
- Christie Provost and Paul Hughes, “Medicaid: 35 Years of Service,” Health Care Financing Review 22, no. 1 (2000): 141.
- Kathryn G. Allen, Differences in Funding Ability among States Often Are Widened, Report GAO-03-620 (Washington, DC: US Government Accountability Office, 2003).
- A large proportion of Medicaid recipients are children, about whom the BRFSS does not collect health information. This is a limitation of the dataset. However, on average, children on Medicaid incur substantially lower healthcare expenses than adults do. Adults accounted for 84.5 percent of total Medicaid benefit spending in 2019. See exhibit 21 in Medicaid and CHIP Payment and Access Commission (MACPAC), MACStats: Medicaid and CHIP Data Book (Washington, DC: MACPAC, 2021), https://www.macpac.gov/wp-content/uploads/2021/12/MACStats-Medicaid-and -CHIP-Data-Book-December-2021.pdf.
- See, for example, Margaret H. Ochner et al., “Obesity and Self-Reported General Health, Hawaii BRFSS: Are Polynesians at Higher Risk?,” Obesity 16, no. 4 (2008): 923–26; Liam Sigaud et al., “The Effects of Recent Minimum Wage Increases on Self-Reported Health in the United States,” Social Science and Medicine 305 (2022): 115110.
- Otto Lenhart, “The Impact of Minimum Wages on Population Health: Evidence from 24 OECD Countries,” European Journal of Health Economics 18, no. 8 (2017): 1031–9.
- See, for example, Indu B. Ahluwalia, Julie Bolen, and Bill Garvin, “Health Insurance Coverage and Use of Selected Preventive Services by Working-Age Women, BRFSS, 2006,” Journal of Women’s Health 16, no. 7 (2007): 935–40; Roberto Cardarelli and Jennifer E. Thomas, “Having a Personal Health Care Provider and Receipt of Colorectal Cancer Testing,” Annals of Family Medicine 7, no. 1 (2009): 5–10.
- Some geographic pricing information is available for Medicare recipients, but their patterns of healthcare use are substantially different than those of Medicaid recipients. I reasoned that the population with employer-sponsored insurance was a more accurate, though far from perfect, proxy. Still, this exercise should be interpreted with caution.
- Allen, Differences in Funding Ability.

