- | Monetary Policy Monetary Policy
- | Policy Briefs Policy Briefs
- |
The Neutral Level of NGDP and the NGDP Gap: Q4 2023
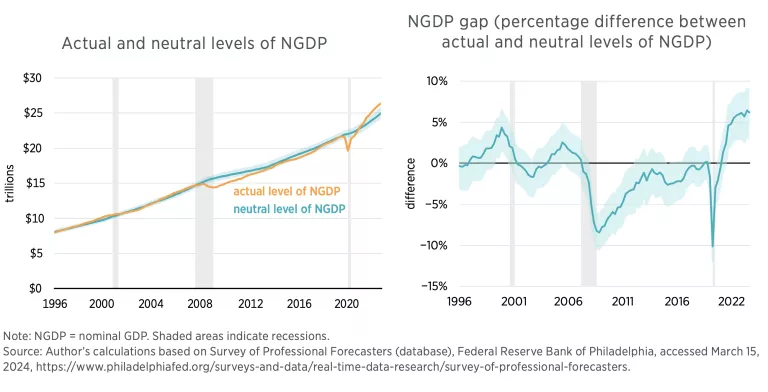
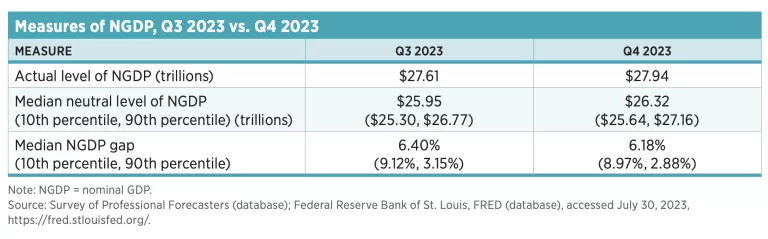
The nominal GDP (NGDP) gap, a measure of unexpected changes in the dollar size of the US economy, is calculated as the percentage difference between the actual and the neutral levels of NGDP. The neutral level of NGDP, in turn, is a sum of all dollar spending, or equivalently all dollar income, expected by households and businesses coming into a specific time period, and it is created using data from consensus forecasts. In the fourth quarter of 2023, the median NGDP gap fell to 6.18 percent, down from the previous quarter’s value of 6.40 percent.
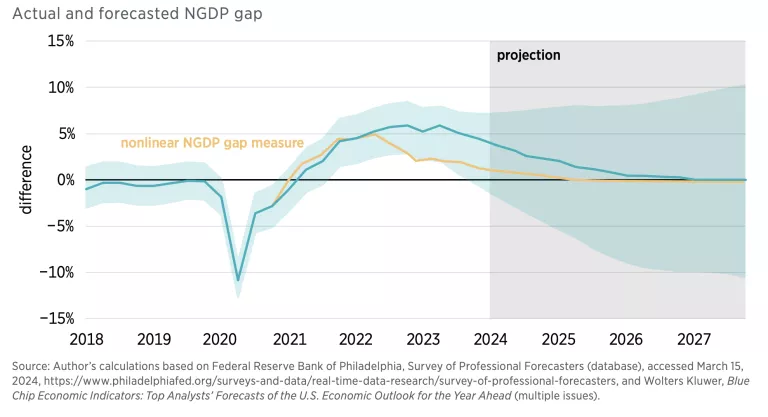
The 6.18 percent NGDP gap means that the dollar size of the economy, $27.94 trillion, was about $1.63 trillion greater than its expected size of $26.32 trillion. Moreover, NGDP was also greater than the 10th and 90th percentiles of the neutral level of NGDP, which shows that the gap was significantly different from zero during the fourth quarter of 2023.[1] That means aggregate spending and income in dollar terms were materially higher than their expected values and that macroeconomic conditions continued to be accommodative during that time. The NGDP gap appears to have plateaued near 6 percent and is forecasted to fall over the next few years, as seen in the figure below.
The figure also reports a new nonlinear estimate of the NGDP gap. This measure was created to capture the potential for changes in how the public forecasts NGDP. Specifically, the rapid run-up in NGDP growth over the past few years may have caused public expectations to cross a threshold where people reevaluate their NGDP forecasts and, as a result, shorten their forecast horizons when making economic decisions. This new measure, explained in more detail later, indicates that the NGDP gap fell rapidly from mid-2022 to mid-2023 but now is slowing down its descent. The NGDP gap hit 1.97 percent in the fourth quarter of 2023.
A Closer Look at the NGDP Gap
As noted, the NGDP gap requires an estimate of the neutral level of NGDP. The neutral level of NGDP is estimated by taking an average forecast of NGDP, or total nominal income, for a given quarter based on forecasts for that period from the preceding 20 quarters. The forecast data used here are taken from the Federal Reserve Bank of Philadelphia’s Survey of Professional Forecasters.
The NGDP gap measures the percentage difference between that average forecast and the actual level of NGDP. If actual NGDP is significantly less than the neutral level, then macroeconomic conditions are contractionary. If actual NGDP is significantly greater than the neutral level, then macroeconomic conditions are expansionary.
The rationale for this understanding is twofold. First, households make economic decisions, such as whether to take out a mortgage or a car loan, on the basis of forecasts of their nominal incomes. Similarly, firms may finance with debt and commit to long-term contracts on plants, raw materials, and labor given their outlook for nominal incomes. The financial contracts formalizing those economic decisions often commit household and firms to multiyear financial obligations even though their expectations of nominal income may change.
Second, if actual nominal incomes turn out to be very different from what was originally expected, then households and firms will find their existing financial contracts disruptive. For example, if nominal incomes are less than many people expected, then their existing financial obligations will become onerous and destabilizing. Such disruptions can be avoided by maintaining total nominal income or NGDP on the growth path expected by the public. In other words, the Federal Reserve should aim to close the NGDP gap to keep macroeconomic conditions neutral.
To ensure robustness, I create a data series using real-time actual NGDP data (which are revised later). This series is called the vintage NGDP gap, and it contains initial-release NGDP data for each quarter that can be used to construct an NGDP gap. In other words, it shows the NGDP gap policymakers would have seen in real time, given the initial NGDP data. In addition, I create a second version of the NGDP gap, the Blue Chip NGDP gap, using the Blue Chip Economic Indicators instead of the Survey of Professional Forecasters. This measure provides a cross-check on the use of the latter source as a main indicator.
The nonlinear NGDP gap, discussed earlier, is calculated the same as the regular NGDP gap, except that when the spread between the 90th and 10th percentile forecasts exceeds its mean plus two standard deviations for four consecutive quarters, then the forecast horizon is cut to two and one half years. That is, a large and sustained increase in the spread between 90th and 10th percentile forecasts causes the public to change its forecast horizon for making economic decisions. This measure reverts to the regular NGDP gap only if the 90th and 10th percentile spread is less than two standard deviations greater than the mean and stays that way for a year.
All of these series—the vintage NGDP gap, the Blue Chip NGDP gap, the forecasted NGDP gap, the nonlinear NGDP gap, and the regular NGDP gap—can be downloaded from the NGDP gap web page hosted by the Mercatus Center.[2]
Notes
1. The Survey of Professional Forecasters reports the mean and median (50th percentile) of forecasts made by all the individual forecasters who submit their projections. The 10th and 90th percentiles are constructed using the same underlying individual data in the survey.
2. David Beckworth, “Measuring Macroeconomic Policy: The NGDP Gap,” Mercatus Center at George Mason University, Arlington VA, last updated March 15, 2024, https://www.mercatus.org/research/policy-briefs/measuring-macroeconomic….

