The availability of data is critical in assessing the effects of government policy on the economy. A rich literature on the effects of government spending, taxes, and monetary policy exists in part because data are plentiful in these areas. Data pertaining to the extent of regulation are less available, even though the effects of regulation on the economy and people’s day-to-day lives are considerable.
Historically, researchers trying to measure regulation often had to rely on crude page counts or highly imperfect (and often politicized) cost-benefit reports produced by federal agencies. Fortunately, technology in recent years has helped overcome this challenge. For instance, researchers at the Mercatus Center at George Mason University developed QuantGov, an open-source machine learning and text analysis platform for analyzing regulatory text. QuantGov can process large quantities of regulatory documents (and other policy documents), and it allowed researchers to create RegData, a groundbreaking dataset that includes various dimensions of federal regulation, such as volume, applicability, and complexity.
RegData was created out of necessity. As of 2019, the US Code of Federal Regulations (CFR) was 185,984 pages long—too long for any individual to read in its entirety without literally spending years on the task, but entirely within the capabilities of modern computers to analyze. Following the success of RegData, which now covers the years 1970 to 2019, Mercatus researchers created numerous spin-off datasets and data products including RegData Canada, RegData Australia, the Federal Regulation and State Enterprise (FRASE) index, and State RegData, the focus of this policy brief.
By using the QuantGov platform to analyze state administrative codes, researchers created version 1.0 of State RegData in 2019. It was the first dataset to quantify aggregate regulatory volume as well as industry-specific regulatory volume across US states. State RegData 2.0 is an improvement over the previous iteration of the dataset, as it is built using an improved industry classifier and it includes additional estimates of complexity. These data should allow for much more rigorous academic research of state-level regulation and its impacts, in the same way that RegData permitted novel research on federal regulation’s impact. To date, state-level regulation has been understudied relative to federal regulation, likely, again, because of a dearth of high-quality data. With State RegData, that is changing.
About State RegData 2.0
State RegData 2.0 includes the cumulative volume of regulations found in the administrative codes of 44 states and the District of Columbia. Administrative codes contain rules written by administrative agencies, which are generally part of the executive branch of state governments and therefore under the direction of the governor, though they sometimes operate independently of gubernatorial oversight. Administrative laws written by these agencies have the force of law like any other law, but they are different from statutes written by elected representatives and signed into law by a governor in that they are primarily written by unelected, career civil servants (i.e., regulators). State RegData covers only administrative laws and does not contain data on statutes or the various policy documents, guidance documents, or memoranda that regulators issue—although it is worth keeping in mind that these other layers of law exist and that future versions of State RegData might be able to include them.
We collected state administrative codes between March and June of 2020. Several states could not be included in State RegData 2.0 because of limitations on data availability. First, four states that were not included in version 1.0 were also not included in version 2.0. These are Arkansas, Hawaii, New Jersey, and Vermont. Arkansas does not have a compiled administrative code, although the state passed a law in 2019 to create one. Once Arkansas’s administrative code is available online, the volume of regulation in Arkansas will be quantified in future iterations of State RegData. Hawaii’s online code simply links to the individual websites of specific state departments. Therefore, writing a program to analyze Hawaii’s code means writing a unique program for each department, which is unrealistic at this time. New Jersey and Vermont delegate control of their codes to a private company, LexisNexis. LexisNexis makes state rules freely available online for anyone to read. However, the company’s terms and conditions prohibit the downloading of text, which is necessary to analyze the state’s rules using the QuantGov technology. As a result of these policies, we do not include New Jersey and Vermont in version 2.0 of State RegData but leave open the possibility of their inclusion in future releases.
We included two states in State RegData 1.0 that we do not include in version 2.0, owing to new circumstances. These states are Alaska and Connecticut. Alaska was updating its website in mid-2020, so only an incomplete catalog of rules was available during the time we collected codes for State RegData 2.0. Connecticut’s website could not be scraped using traditional web-scraping techniques, as the website would block programs after a certain number of pages were downloaded.
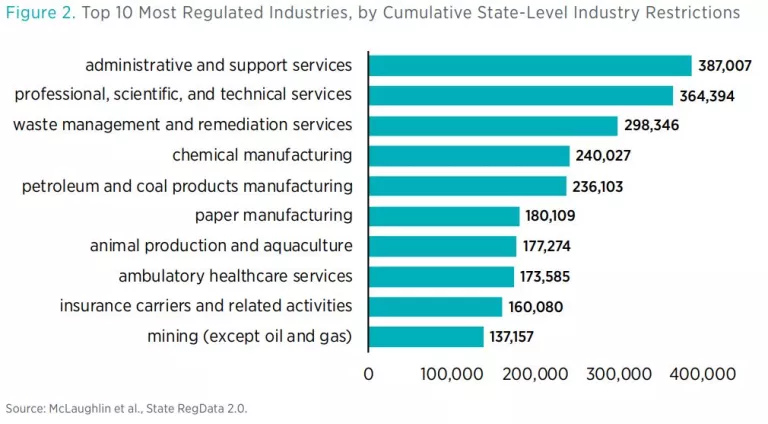
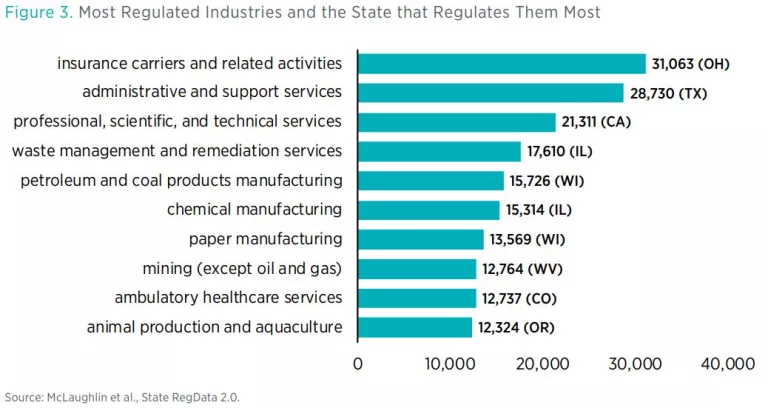
For each state, State RegData includes the following measures: word counts, restriction counts, complexity, and industry relevance. Regulatory restrictions are instances of the terms “shall,” “must,” “may not,” “prohibited,” and “required” in regulations. Industry relevance refers to the probability that a portion of regulatory text is relevant to a particular industry. When multiplied by the number of regulatory restrictions in that portion of text, industry-relevant restrictions can be estimated. Industries in State RegData are distinguished from one another using the North American Industry Classification System (NAICS) and are calculated at the three-digit NAICS level.
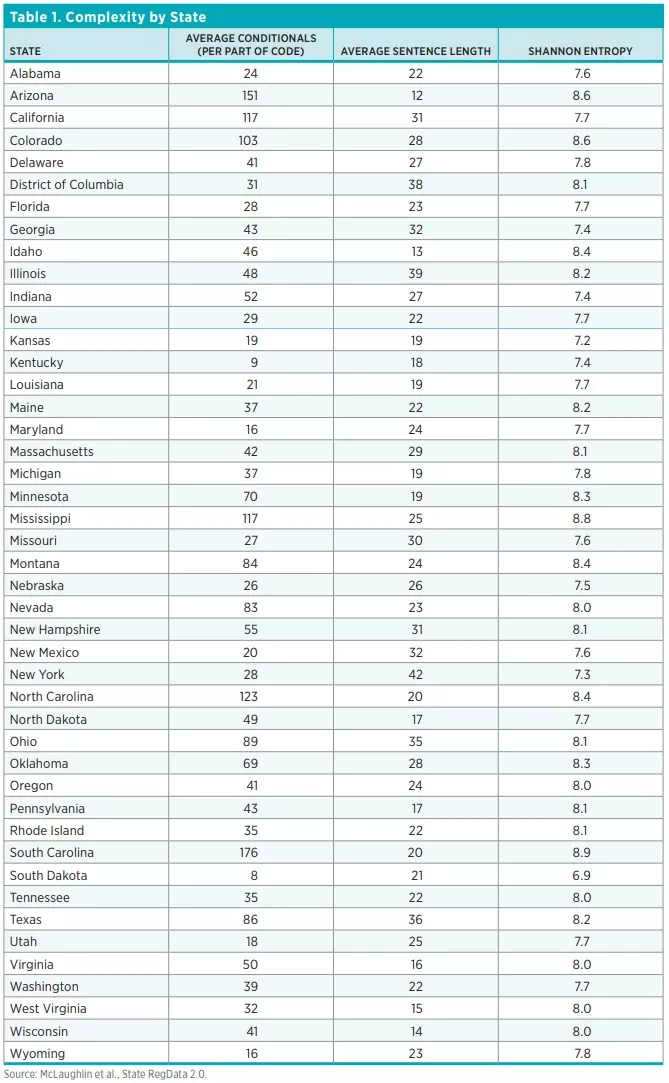
Regulatory restrictions and industry relevance were components of State RegData 1.0, but complexity metrics are a new addition to version 2.0. Complexity measures include the average sentence length (in number of words) in a code or section of code; Shannon Entropy, which is a measure of the amount of information contained in text; and the number of conditional terms.
The data in State RegData 2.0 have numerous advantages, especially when compared with other metrics, such as page counts. Whereas page counts are not comparable across states owing to states’ codes having different page and font sizes, counts of words or restrictive terms are comparable, as are numbers of industry-relevant restrictions or complexity metrics. Restriction and word counts are also more comprehensive in the sense that they can be gathered from all of the rules in place. Contrast this with, say, cost-benefit estimates, which are usually drawn from a handful of regulations that probably are not representative of the regulatory system as a whole. Moreover, regulatory restrictions, words, and industry-relevant restrictions have a clear, concrete meaning, unlike the net-benefit calculations in regulatory agency cost-benefit reports, which are open to various interpretations.
State RegData 2.0 is also an improvement over version 1.0, as it more clearly delineates the agencies that write particular regulations. Version 2.0 also took less time to collect data for. Because each state’s administrative code is structured differently, creating version 1.0 required writing a unique program for each state, so analyzing all the states’ codes took more than three years. By contrast, releasing version 2.0 did not require having to write the initial programs from scratch, so codes were collected and analyzed over the course of only a few months in mid-2020. In that sense, version 2.0 more precisely pinpoints the stock of state regulation that existed at a particular moment in time across the various states.
The data here are also likely to prove useful to policymakers. Policymakers have used State RegData 1.0, sometimes citing its metrics in official reports or government directives. For example, Missouri claims to have reduced its regulatory restrictions by about 20 percent, as measured by State RegData. Idaho’s Board of Pharmacy used RegData metrics to measure and track progress of its regulatory reforms. Finally, State RegData statistics (or statistics inspired by State RegData) were referenced in regulatory reform legislation and several executive orders around the country.
Overview of RegData 2.0 Statistics
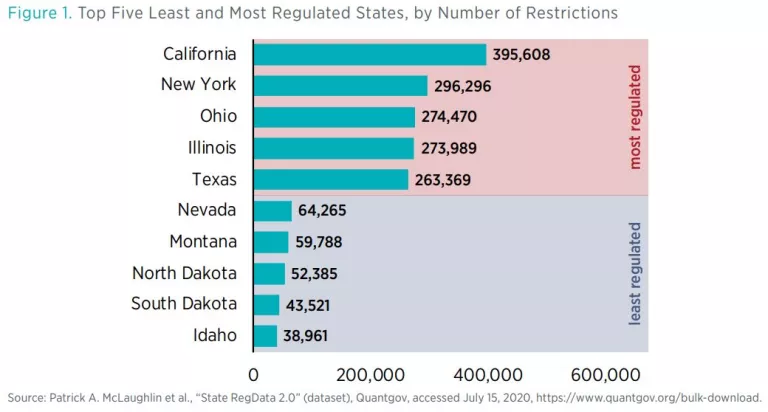
All told, there are 416 million words in state regulations, which contain 6.07 million regulatory restrictions. It would take about 23,000 hours, or more than 11.5 years, to read every word of every state regulatory code for the states analyzed. The average state has 135,000 regulatory restrictions in its administrative rules, but the states vary hugely. California is the most regulated state, with 395,608 regulatory restrictions; Idaho is the least regulated state, with just 38,961 regulatory restrictions.
For comparison, in 2019, Canadian provinces averaged about 29,400 restrictions, and the Australian states averaged about 27,000 restrictions. State regulatory codes combined are about four times the size of the CFR in word counts and five and a half times the size of the CFR in regulatory restrictions. This means there is considerably more state regulation than federal regulation. However, the federal code is still much larger than any individual state’s administrative code (and many businesses may have to comply with only one state’s rules).
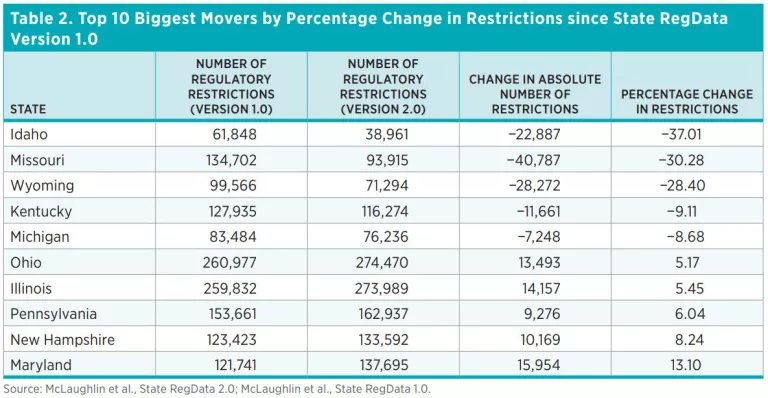
As figure 1 shows, the top five states in restrictiveness are California, New York, Ohio, Illinois, and Texas. Meanwhile, the bottom five states in restrictiveness are Idaho, South Dakota, North Dakota, Montana, and Nevada. These results are only slightly different from those of version 1.0. One notable change, which is consistent with recent claims from the governor of Idaho, is that Idaho has now become the least regulated state in the nation (previously it was the fourth least regulated state).
At the other end of the spectrum, Maryland saw a 13 percent increase in regulatory restrictions, and New Hampshire saw an 8 percent increase. Maryland has also reviewed its regulations as part of a red tape reduction effort in recent years, though Maryland’s review is notable for not including many of the elements identified as key to successful regulatory reduction efforts, such as having a concrete measure regulation, estimating a baseline level of regulation, and setting a reduction target. Ohio also shows up in the top five in percentage increase in regulatory restrictions. In 2019, Ohio passed regulatory reform legislation, although it may not have had enough time to implement reforms that would show up in these statistics.
Conclusion
State RegData 2.0 is a significant improvement over version 1.0. As such, the varying regulatory landscape across states is becoming much clearer. Future research can shed light on the causes and consequences of state regulation, as well as the ways regulations implemented by different levels of government interact with one another. Whereas at one time, empirical analysis of the consequences of state regulation seemed beyond reach, that is all beginning to change with the development of modern tools like State RegData.

