Using RegData, an innovative dataset from the Mercatus Center at George Mason University, this policy brief summarizes and contextualizes the volume of regulatory restrictions in seven states constituting the Plains region as classified by the Bureau of Economic Analysis (BEA). In 2012, the Mercatus Center created RegData in an effort to quantify regulation at the federal level in the United States. RegData was created using text analysis and machine learning algorithms to convert legal text into quantitative data. Using these data, one can quantify the regulations in a jurisdiction. The primary unit of measurement of regulation used in RegData is regulatory restrictions, or instances of the terms shall, must, may not, prohibited, and required appearing in laws. Regulations by nature impose restrictions on individuals and businesses, either by requiring or prohibiting activities. These terms approximate the restrictions that regulators impose on a jurisdiction.
In 2019, the Mercatus Center created State RegData, another dataset similar to RegData that quantifies regulations in state administrative codes. State RegData allows for aggregate levels of regulation across the various states to be compared to one another. This policy brief takes a deeper dive into the data contained in State RegData to better understand the regulatory landscape in the Plains region of the United States. Specifically, this brief summarizes data for seven states: Iowa, Kansas, Minnesota, Missouri, Nebraska, North Dakota, and South Dakota. Using data from State RegData, version 2.0, as well as other sources, the brief compares these states’ regulatory environments along a variety of dimensions, including overall word counts in state codes, restrictiveness of regulations in state administrative codes, complexity of regulatory text, restrictions across industries, federal regulation of the various states, and population-adjusted restrictions.
The analysis presented here provides new insights into the size and scope of regulation across the Plains region, which should prove useful to academics, policymakers, and even the regulators themselves as they seek to understand the consequences of the regulatory state in America.
Word and Restriction Counts and Complexity in State Regulations
Almost every state in the country has a regulatory code where its administrative laws are housed. Regulations are distinct from traditional laws written by legislators in that they are written mostly by unelected officials working at executive branch agencies that are delegated lawmaking powers from elected representatives in a legislature. Executive branch agencies are typically run by political appointees (although sometimes they are run by elected officials), and the staff who work at agencies are career civil servants. Thus, the administrative laws (i.e., regulations) written by these officials are different from statutes written by legislators in that there is generally no direct line of accountability from voters to the writers of these laws.
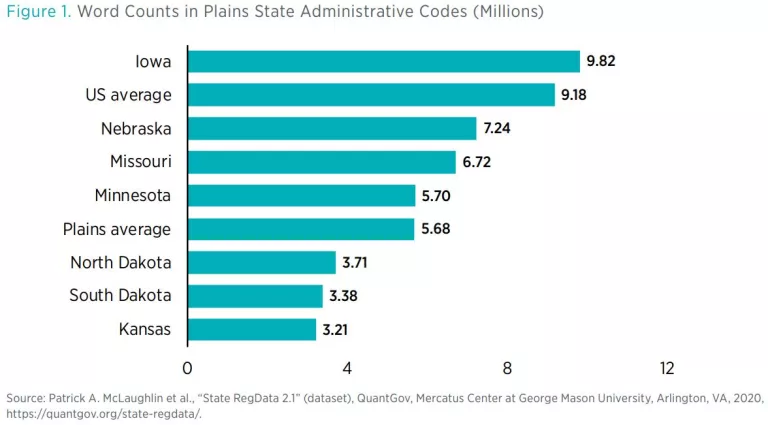
Perhaps the simplest way to compare states’ regulatory environments is to count the words in each states’ administrative code (figure 1). For example, the Iowa administrative code contains more than 9.8 million words, while Kansas’s administrative code contains just 3.2 million words. Other than Iowa, all states in the Plains region have fewer words in their administrative rules than the national average of 9.2 million words. In fact, by word count, Kansas is the least regulated state in the nation, followed by South Dakota and North Dakota.
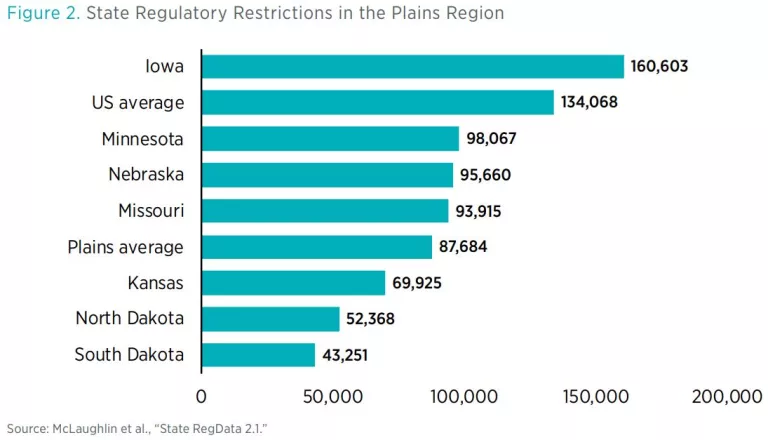
If one instead counts the restrictive terminology in administrative codes, then Iowa remains the most regulated Plains state with 160,603 restrictions. South Dakota has the fewest regulatory restrictions with 43,251 restrictions (see figure 2).
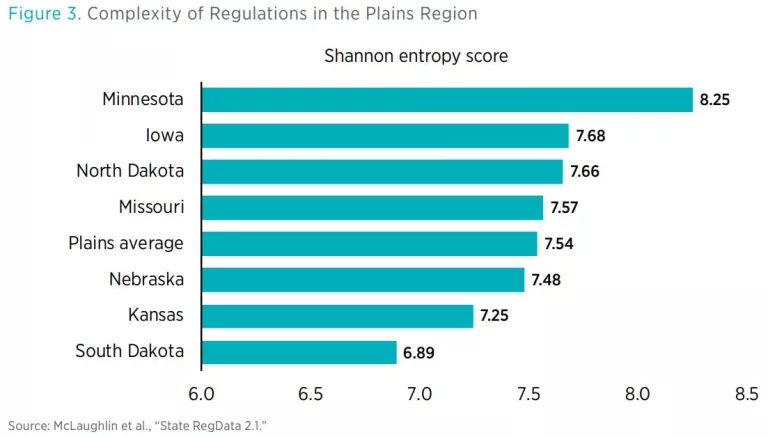
Using the Shannon Entropy score, we notice that the complexity of the regulatory text varies somewhat across most of the states in the Plains. Minnesota has the most complex regulations in the Plains region, whereas South Dakota has the least complex regulations (figure 3).
Regulation of Industry at the State and Federal Levels
Another way to analyze the regulatory systems in these states is to look at industries that are targeted by state and federal regulation. RegData was created using machine learning algorithms that are trained to identify text relevant to particular industries. When the probability that a certain piece of legal text applies to a particular industry is combined with regulatory restriction data, one can produce an estimate of the regulatory restrictions targeting particular sectors of the economy. Figure 4 provides state regulatory restriction information for select industries. It shows clearly that the number of regulatory restrictions varies widely both within and across states. In other words, for particular industries, some states impose far more regulation than others. And within particular states, some industries are far more regulated than others.
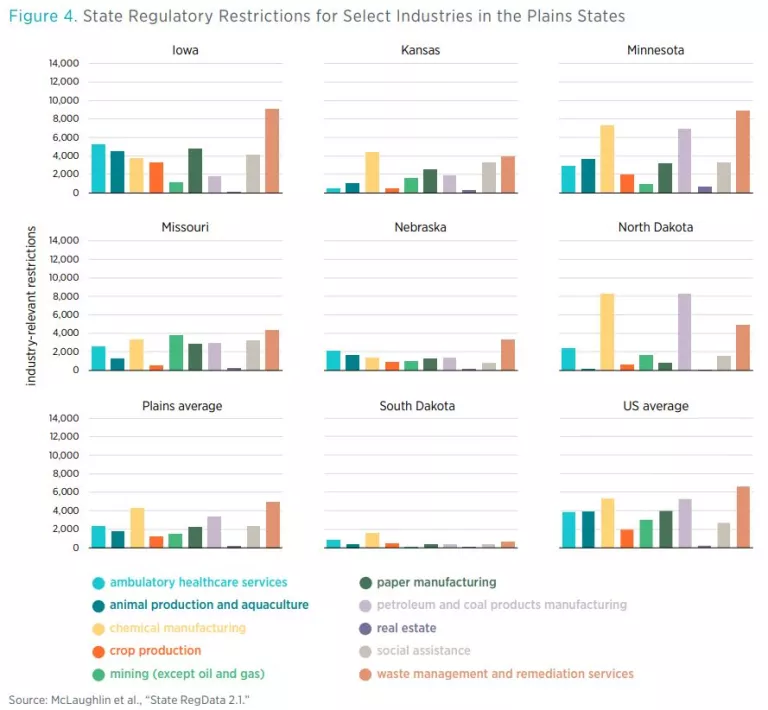
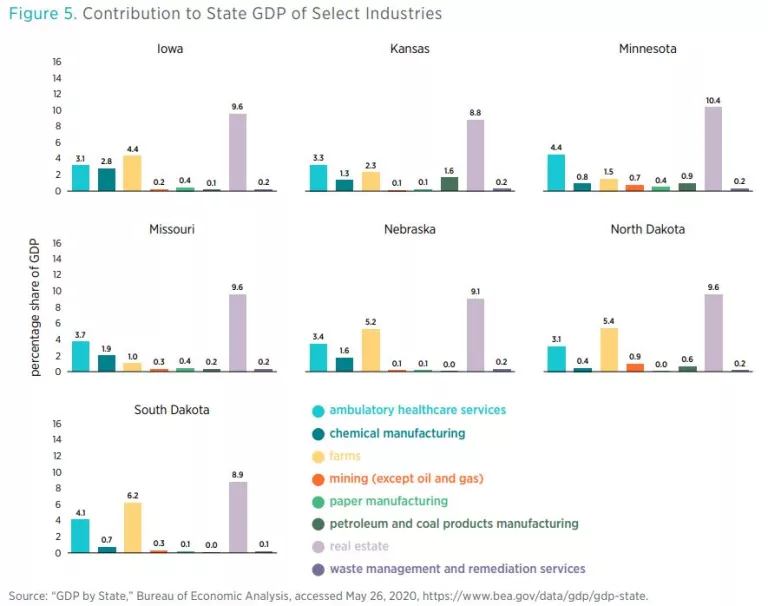
The variation in the number of restrictions on different industries across this region could be explained by the relative importance of each sector to each state’s economy, though this is not always the case. Without assuming any direct causal relationship between the volume of regulations that falls on an industry and that industry’s contribution to GDP, in figure 5 we present the percentage of state GDP contributed by each of these industries for the seven states. In North Dakota, waste management and petroleum and chemical manufacturing contribute a small portion of state GDP even though they are all highly regulated industries. Meanwhile, real estate is important in all the states’ economies and is lightly regulated in all states too.
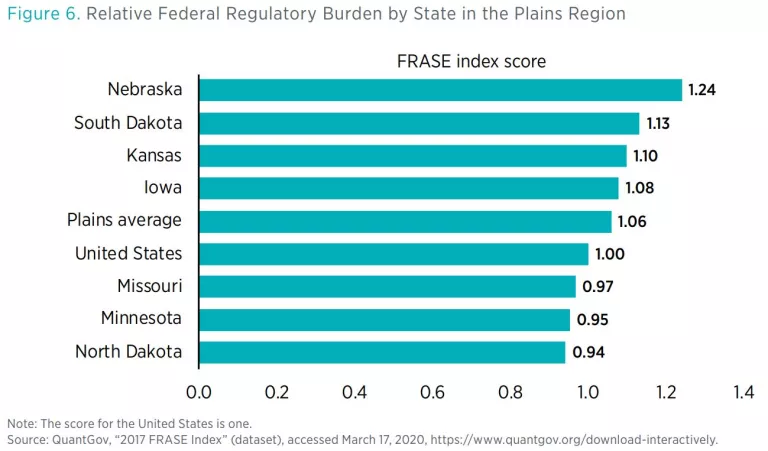
The Mercatus Center has also produced data to better understand the degree to which federal regulation targets states. By weighting estimates of industry-relevant federal restrictions according to how important various industries are to states’ gross state product, the Federal Regulation and State Enterprise (FRASE) index ranks the states in terms of how regulated they are by the federal government (figure 6). Nebraska receives a score of 1.24. This ranking is scaled relative to the nation as a whole, which receives a score of 1.00, so a score of 1.24 means that Nebraska’s industries are targeted by federal regulation 24 percent more than industries across the nation as a whole are.
Regulation and Population
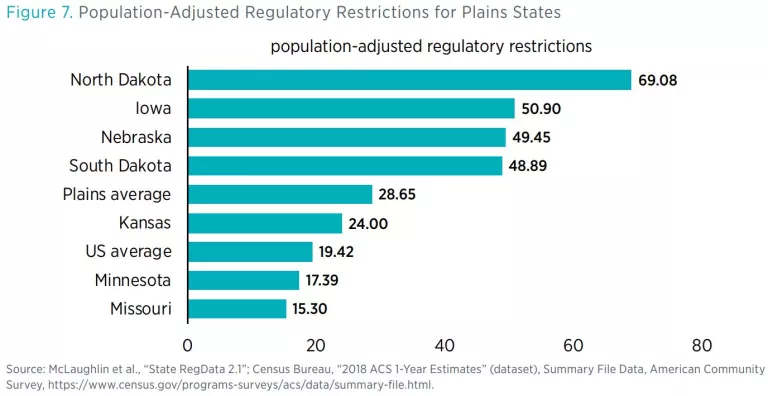
There are also reasons to believe that more populous states might tend to have more regulation than less populous states. For example, more populous states might have more industries, so some forms of regulation may not be necessary in less populous states. It may be that larger populations require more regulation. Finally, some scholars posit that there are fixed costs associated with regulating and that larger populations are able to absorb these fixed costs more easily by spreading them across a greater number of people. Therefore, more populous states could be expected to have more regulation because it is relatively cheaper for them to impose regulation compared with less populous states. For these reasons, it could make sense to adjust for population when reporting regulatory restrictions. Figure 7 shows the number of regulatory restrictions for each thousand residents in each of the Plains states. North Dakota (69.08 restrictions per 1,000 residents) is the most regulated state in the Plains region, adjusting for population. By this measure, Missouri (15.30) is the least regulated state in the Plains region. On average, states in the Plains region are more regulated (28.65) than the national average (19.42), controlling for population.
Conclusion
There are a variety of ways in which one can compare the regulatory environments across states, as this policy brief has done for states in the Plains region of the United States. We have looked at word counts in state administrative codes, regulatory restriction counts, complexity of regulations, restrictions targeting industries in these states, the extent to which federal regulation targets each state’s industries, and the population-adjusted volume of state regulation.
Each of these metrics has its own advantages and disadvantages. All told, the amount of regulation in the states is considerable. Further research will help gauge how levels of regulation are evolving in these states over time and what this evolution implies. This snapshot of state regulations, however, provides a glimpse into the reach of various kinds of regulation in the Plains region.

