- | Regulation Regulation
- | Policy Briefs Policy Briefs
- |
A Snapshot of Regulatory Restrictions in the Great Lakes Region
RegData is a project started by scholars at the Mercatus Center at George Mason University to introduce an objective, replicable, and transparent methodology for measuring regulation. It quantifies regulations based on the content of regulatory texts using a custom-made text analysis program that counts the number of binding constraints, or restrictions: terms that indicate an obligation to comply. These terms are shall, must, may not, required, and prohibited. RegData also uses machine-learning algorithms to map regulations to the sectors or industries of the economy that are most likely to be affected by the regulations.
The RegData project was launched in 2012 with the express purpose of facilitating research that was previously not feasible. Regulations have been an important and widely used policy tool for decades, but empirical analysis of regulations’ actual effects was historically hampered by a paucity of data. Historical data going back to 1970 are available for the US Code of Federal Regulations (CFR), and current data are available for most US states. More recently, RegData Canada, a new part of the RegData project, was launched, allowing for cross-border comparisons in regions such as the Great Lakes region.
Growth in the number of restrictions can serve as a first approximation to the measurement of the aggregate regulatory burden at the national or subnational level. Counting restrictions is also a considerable improvement on earlier research that relied on page counts. Also, restriction counts are associated with a number of economic variables, including economic growth, productivity, and consumer prices.
RegData datasets include statistics such as the number of individual restrictions, the industries that those restrictions are likely to affect, and the agencies responsible for the restrictions. RegData maps regulations to the sectors and industries most likely to be associated with them using the North American Industry Classification System (NAICS). It captures information in minutes that would take hours, weeks, or even years to obtain by reading and counting.
Comparisons of the Great Lakes States and Provinces
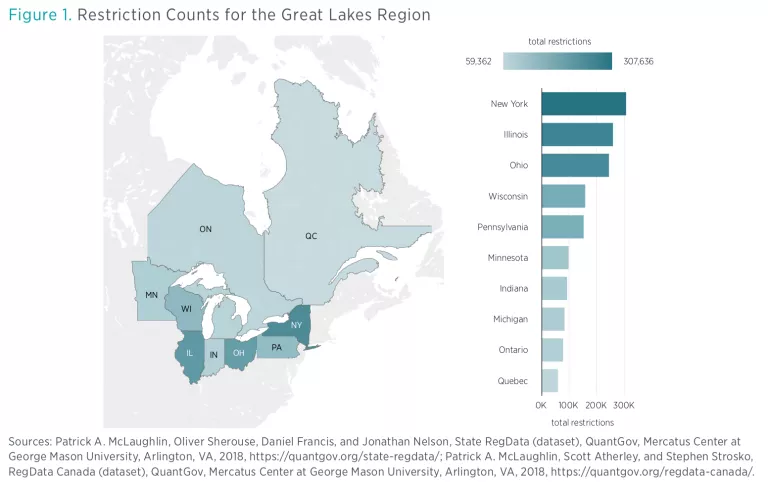
Figure 1 shows the restriction counts for the eight states and two provinces in the Great Lakes region. The range is wide. Michigan has the smallest number of restrictions of any state in the region at 83,484. At the other end of the spectrum, New York has more restrictions than any other state in the region at 307,636—more than three times the number of restrictions in Michigan. Ontario and Quebec, the Canadian provinces in the region, have fewer restrictions than any of the states at 77,139 and 59,362 restrictions respectively.
Caution should be used in reading the comparisons we present here. Canadian provinces and American states have different institutional environments and traditions for enacting and writing rules and regulations. Our estimates of regulatory burden (using restriction counts) may not reflect those differences. Also, complete sets of rules and regulations for each jurisdiction are not always available in the public domain or could be difficult to read for our data-scraping tools. When comparing any two jurisdictions, please consult our technical manual for details on how the respective sets were built.
Acknowledgment
The authors would like to thank Kofi Ampaabeng and Thurston Powers for their help with research and creating figure 1.

