- | Monetary Policy Monetary Policy
- | Policy Briefs Policy Briefs
- |
What Would Milton Friedman Say about Business Cycles? The Plucking Model View
This policy brief is part of a Mercatus Symposium titled “What Would Milton Friedman Say?” The symposium explores what the late Nobel laureate, economist Milton Friedman, might say about monetary policy today, as the Federal Reserve grapples with increasing inflation in the wake of the COVID-19 pandemic.
A building block of modern macroeconomic theory is that economic activity tends to bounce around above and below the sustainable speed limit of the economy. This understanding of a symmetric business cycle, where the economy moves around the so-called natural rate of output and unemployment, drives decision-making in many central banks today.
An alternative view of the business cycle is Milton Friedman’s plucking model. It sees the economy following the natural rate of output and unemployment during normal times and deviating only during recessions—that is, economic activity can only weaken below its full potential. There are no artificial booms but only shortfalls from full employment and natural output. Recent history and much empirical evidence increasingly favors the plucking model over the standard macroeconomic view. The plucking model also has huge implications for macroeconomic risk management and macroeconomic policy. It suggests that we need to aggressively counter recessions and minimize shortfalls from potential output, especially if there are scarring effects (known as hysteresis) that damage the economy’s capacity to produce goods and services in the long run.
This understanding appears to be one of the reasons for the Fed’s adoption of its new framework called average inflation targeting (AIT). The new target allows the central bank to make up for misses in its inflation target so that it maintains a 2 percent average inflation rate over time. Doing so allows the economy to temporarily run hot after a recession and make up for lost ground. Moreover, this desire to do “makeup” policy will be done in the context of minimizing shortfalls from maximum employment rather than worrying about fluctuations above it. The Fed’s new framework, therefore, can be seen as having accepted Friedman’s plucking model view of the business cycle as more plausible alternative to standard New Keynesian theory.
It is important, then, that we understand the theory and evidence for the plucking model and how it contrasts with the standard macroeconomic view of the business cycle. Moreover, I will discuss how Friedman would think about the Great Recession and the current economic downturn due to the COVID-19 pandemic. I believe we have enough evidence based on his former research output and writings to conclude that he would be among the first to support sufficiently bold central bank action to sustain an economic recovery.
THE STANDARD MACROECONOMIC VIEW OF BUSINESS CYCLES
Modern macroeconomic theory is built around three “stars”: y*, u*, and r*. They stand for the natural rate of output, unemployment, and interest rate, respectively. These three macroeconomic variables are unobservable to policymakers and can only be estimated with a great deal of imprecision in real time. According to conventional macroeconomic theory, the economy exhibits price stability and is close to full capacity when the actual unemployment and interest rate are close to their natural rates.
The natural rate paradigm has dominated macroeconomic thinking since the 1980s. Ironically, it was also Friedman who suggested the hypothesis initially. More specifically, he proposed that there is a natural rate of unemployment u*, which is independent from monetary policy. With the rational expectations hypothesis and the microfoundations revolution during the 1980s, macroeconomic theory took Friedman’s propositions one step further. Besides u*, two other stars, y* and r*, were added to complete what is now known as the New Keynesian benchmark model, usually within the framework of dynamic stochastic general equilibrium (DSGE).
There are two key ideas of New Keynesian macroeconomics that stand out. First, macroeconomic shocks are assumed to be temporary in nature. After a negative output shock, the economy is assumed to return to its natural rate within what macroeconomists consider to be the short run, typically not more than a couple of years. Second, macroeconomic fluctuations occur around potential y* and u*, meaning that booms and busts are assumed to be inherently symmetric. This assumption is also extremely problematic for a variety of reasons. There are several factors that lead to asymmetries in the labor market, search frictions being the most prominent of them. Barriers in the labor market can explain why symmetric fluctuations around u* are nothing more than a fairy tale.
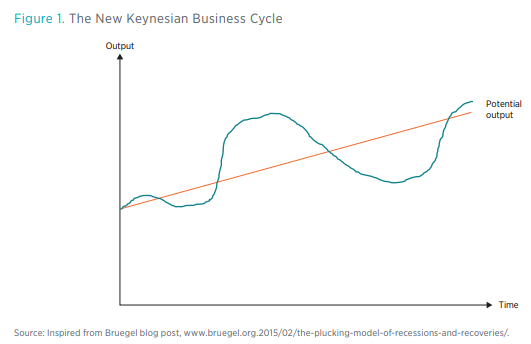
The benchmark New Keynesian model with the core assumptions cited above leads to a business cycle that supposedly looks like figure 1. Although GDP displays cyclical movements below and above potential, it follows potential output y* in the long run. More importantly, in the New Keynesian world, the size of the macroeconomic boom predicts the size of the downturn. Graphically, one can imagine the natural rate world as follows: the larger the initial economic boom with GDP being above potential, the larger the subsequent economic bust.
THE ALTERNATIVE VIEW OF THE BUSINESS CYCLE: THE PLUCKING MODEL
Friedman’s plucking model proposes a completely different dynamic for output and unemployment. In his version of the business cycle, output evolves along potential and is occasionally pulled down below as a result of aggregate demand shocks. Fluctuations of the ceiling itself are reflected by the economy’s potential capacity, meaning changes in the long-run supply. Standard examples are technological disruptions and productivity shocks, demographic changes, regulatory changes, and so forth.
The factors influencing the ceiling are therefore similar to the standard New Keynesian view, which also assumes a vertical long-run aggregate supply curve, meaning that potential output is independent of demand. Mainstream macroeconomics also assumes that labor, capital, and technology shocks are the main factors shifting long-run potential.
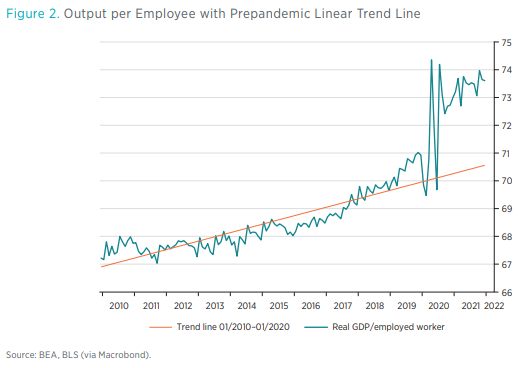
The effects of the COVID-19 pandemic on potential output are ambiguous. On the one hand, the pandemic is a series of negative supply shocks, given that health concerns are leading to interrupted supply chains and a stop-and-go economy with seasonal lockdowns. On the other hand, the introduction of remote work and other technological advances have led to an increase in worker productivity since the beginning of the pandemic. The United States is already producing a higher level of output with fewer workers than before the pandemic (see figure 2), suggesting that positive effects are currently outweighing negative distortions.
The main difference between mainstream models and Friedman’s hypothesis therefore concerns the demand side of the economy. Standard macroeconomics assumes fluctuations around the ceiling, whereas the plucking model exhibits only downward pulls below potential. Most importantly, deeper contractions are followed by stronger recoveries, at least in the absence of strong hysteresis effects, which could also lead to a downward pull of the ceiling itself. Graphically, one can imagine the plucking world as shown in figure 3, with the size of the recession predicting the size and speed of the subsequent recovery.
The Great Recession was followed by an extremely lackluster recovery after 2008, thus seemingly contradicting Friedman’s hypothesis. A large body of macroeconomic history research, however, suggests that financial crises behave differently than your garden-variety recession: economies tend to recover much more slowly when the financial system is impaired, meaning that the plucking property might be somewhat inhibited after a financial shock. However, other empirical studies show that the plucking property still seems to hold true in an international context—that is, cross-sectional regressions show a relatively high correlation between the size of the recession and the subsequent economic recovery.

TRADITIONAL OUTPUT MEASURES AND THEIR FLAWS
The Standard View of the Output Gap
The estimation of potential output and spare capacity in the economy became an important research topic again with the financial crisis of 2008 that plunged many advanced economies into a deep economic contraction. This led to a large debate, not only at various policymaking institutions like the International Monetary Fund (IMF) and central banks but also in academia, as to what extent the Great Recession has pushed economies below their potential, or whether it was potential output itself that has adjusted downward.
Traditional measures of the output gap are based on the standard view of a symmetric business cycle. The Phillips curve describes inflation dynamics and captures the supply curve of the economy. Current inflation is a function of expected future inflation, the output gap, and exogenous supply shocks. The so-called IS equation describes the intertemporal allocation of consumption of agents in the economy where the output gap is a function of future output gaps, the real interest rate, and exogenous demand shocks. In the dynamic New Keynesian model, the output gap is thus driven by demand shocks, supply shocks, and monetary policy shocks.
To empirically estimate output gaps, macroeconomists have relied on rather simple estimation techniques for decades, the Hodrick-Prescott (HP) filter being the most prominent of them. However, a more recent contribution by Hamilton outlines why the HP filter arguably should never be used to estimate the economy’s potential capacity, which I believe to be a correct proposition.
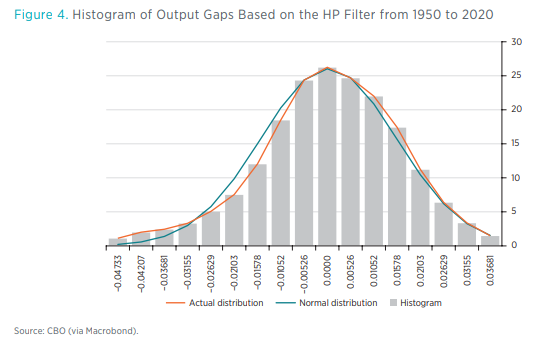
The main problem is that the HP filter is in the end nothing more than a sophisticated moving average. This produces the perverse effect that, in retrospect, one can observe large positive output gaps just before any economic downturn at the peak of the business cycle, such as in 2007 or 2019, even though there was little evidence for overheating in the economy at the time. In addition, the HP filter produces an output gap distribution that is entirely symmetric and follows the normal distribution with a mean of zero, which also rules out large outliers by design.
I have reproduced the US output gap based on the HP filter in figure 4. Although the distribution is seemingly in accordance with the New Keynesian model, it is simply the result of how the filter produces a long-run trend with symmetric oscillations around the underlying time series at hand, in this case US GDP. Other smoothing techniques like the Kalman filter suffer from similar problems.
Output Gap Measures Based on Production Functions
Some policymaking institutions like the IMF, the Federal Reserve, and the Congressional Budget Office (CBO) use alternative models, which produce a more realistic dynamic of the output gap measure than simple filtering techniques (figure A1 in the appendix).
Interestingly, country desk officers at the IMF are not forced to use a standardized methodology for output gap measures. IMF research has mainly focused on applying a production function approach to industrial countries. Output is modeled in terms of underlying factor inputs, which are the standard Solow inputs labor, capital, and total factor productivity (TFP). Potential output is then calculated as the level of production that corresponds to “normal” capacity utilization in terms of labor and capita and when TFP is at its trend level.
This approach is superior to filtering techniques or univariate forecasts since it allows economists to estimate the growth contributions from the various inputs. The drawback of such an approach is that one needs to rely on flawed estimates of the “normal” level of capacity utilization and the “trend” level of innovation, both of which are extremely uncertain.
The Fed uses both conventional New Keynesian DSGE models as well as several other approaches to estimate the economy’s potential capacity. The Fed’s FRB/US model is a large-scale semistructural model of the economy based on some 35 core equations that pay less emphasis on internal consistency than DSGE models and loses some of the microfoundations in favor of a more statistically rigorous approach for modeling time series.
As stated on the Fed’s website:
"Broadly speaking, the eclectic approach to the specification of FRB/US permits the historical patterns in macroeconomic data to influence its structure more substantially than is the case for the typical DSGE model, whose structure is more tightly imposed by economic theory."
Nevertheless, Brayton et al. argue that economic expectations by economic agents still play a big role:
"About half of the behavioral equations are based on formal specifications of optimizing behavior containing explicit estimates of the forward expectations of firms and households."
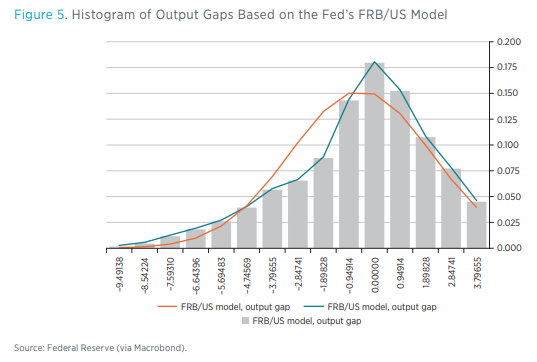
The FRB/US output gap displays a negative skew with a mean of –0.5% since 1968 while the median is closer to zero. The skew is even worse when considering output gaps since 1980 only (see figure A2 in the appendix). Whereas the distribution of the output gap on each side of zero has been similar according to this model, negative output gaps have been larger in size and outweighed positive output gaps in recent decades (figure 5).
Similarly, the CBO estimates potential output for the US economy based on a rather sophisticated Solow growth model. The model contains individual production functions for different sectors to obtain an estimate for the productive capacity of the US economy based on the capital stock and capital accumulation estimates.
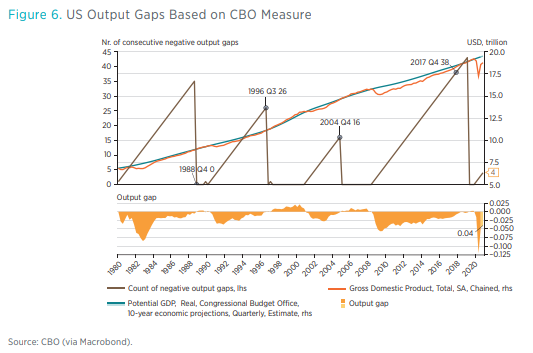
According to the CBO’s measure, the US economy has been operating below full capacity some 124 quarters out of 164 in total between 1980 and Q4 2020, or more than 75 percent of the time (figure 6). Moreover, the output gap distribution is highly skewed with a fat left tail, meaning that large negative output gaps are much more common than large positive ones, which barely seem to exist at all. Between 1980 and 2021, the median output gap has been 1.3 percent and the mean output gap 1.6 percent (figure A3 in the appendix).
Furthermore, there is some evidence that even the CBO’s measure is somewhat conservative when it comes to estimating the economy’s spare capacity. If true, this would suggest that the US economy has persistently operated below capacity for almost four decades now. Given the flattening of the Phillips curve, this spare capacity has not translated into severe deflationary pressure as standard New Keynesian theory would suggest. Instead, it has led to excess unemployment above the natural rate for prolonged periods, especially during the period that has been labeled the Great Moderation.
The figure displays the aggregate sum of consecutive negative output gaps, reaching a peak of 40 quarters for the period after the financial crisis.
It is important to emphasize that both the CBO methodology and the FRB/US model are also based on the standard view of the business cycle. The CBO’s measure relies on a Solow growth model that assumes binding capacity constraints and rising inflation rates once maximum sustainable output is exceeded. Similarly, the FRB/US model also uses a Cobb-Douglas production function to model the supply side of the economy.
In contrast to Friedman’s plucking model, both methodologies thus allow the economy to exceed potential during booms. Nevertheless, their respective output gap estimates suggest a more realistic dynamic for the US business cycle that comes closer to the plucking view in several aspects. First, output gaps are highly skewed to the negative side. Second and more importantly, the CBO measure suggests that the US economy has quite persistently operated below full capacity since the 1980s.
Plucking for Unemployment Dynamics
Modern macroeconomic theory also suggests symmetric fluctuations around the so-called natural rate of unemployment. More realistic measures, however, show that the US economy has endured excess unemployment rates for decades. Using the CBO’s measure for the natural rate, the unemployment gap has been close to 1 percent, on average, for each month since 1980 (figure A4 in the appendix). Moreover, there is a severe positive skew in the distribution, meaning that positive unemployment gaps are both more common and significantly larger in size than negative ones. This is only natural insofar as policymakers can only push unemployment marginally below potential whereas excess unemployment can potentially rise by 10 percent or more, as the recent coronavirus recession and the experience from the Great Depression have taught us.
Search theory can explain some of these asymmetries and how frictions can lead to suboptimal outcomes that can prevent labor markets from clearing at the equilibrium price. Both workers and firms need to allocate sometimes substantial resources to find each other. Workers spend time and effort to find a new job, whereas firms must allocate resources to screen applicants. Furthermore, there is also a spatial aspect to labor markets. Costs to migration, such as housing constraints, can also introduce an element of friction, which prevents an optimal allocation of resources, and negatively affects the economy’s long-run potential. Relationships between employers and employees take time and effort to build up but can easily disappear during a downturn, leading to a deterioration of the matching function. This, in turn, can explain the stickiness of excess unemployment after the occurrence of a negative demand shock.
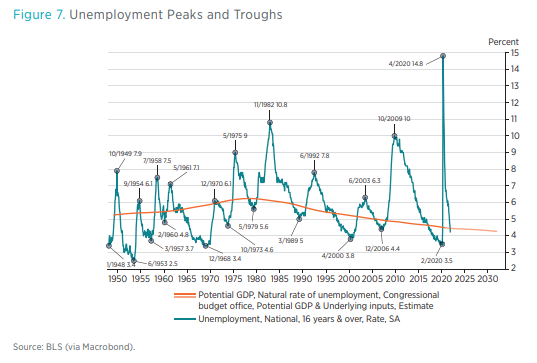
The inherent asymmetry in the labor market combined with evidence that we have found ourselves far more often in a persistently depressed economy is currently not captured by standard macroeconomic models. The CBO’s measure seems to reject the natural rate world where the unemployment rate fluctuates symmetrically around a common trend. Moreover, sharp increases in the unemployment rate tend to be associated with larger recoveries. Following the work by Dupraz, Nakamura, and Steinsson, I have identified the peaks and troughs in the unemployment rate since 1948 (figure 7).
One can see from figure 8 that the amplitude of a contraction, defined as a rise in the unemployment rate from trough to peak, is highly correlated with the amplitude of the subsequent recovery.
On the other hand, booms seem to have little predictive power on the size of the subsequent bust.

The plucking property is thus also firmly established in labor markets, with the size of the bust being predictive of the subsequent recovery. The symmetry assumption of New Keynesian models with fluctuations around a natural rate seems to be a doubtful proposition that can be rejected by empirical evidence.
International Evidence
It also worth asking whether international evidence speaks in favor of Friedman‘s plucking hypothesis. Conventional macroeconomic theory suggests that there is a relationship between the boom and the subsequent bust, whereas the plucking model predicts a relationship between the size of the downturn and the subsequent economic recovery. We can test these two hypotheses by estimating the following two regressions (1) and (2) below.
In the New Keynesian model, the size of the subsequent economic contraction should be predictive of the size of the previous economic boom:

We have conclusive evidence that Friedman’s plucking model comes closer to the true business cycle dynamics if we can reject hypothesis 1 in favor of hypothesis 2.
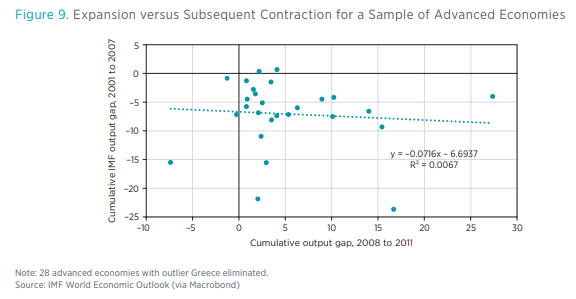
To test the New Keynesian theory, I use IMF output gap measures for 28 advanced economies to estimate the size of the boom pre-2008 and the size of the economic contraction after the global financial crisis.
Regressing the boom amplitude on the contraction amplitude leads to an R2 of about 10 percent. However, it turns out that the entire result is largely driven by one single outlier, Greece. When eliminating the country from the sample, the R2 of the regression goes down to zero (see figure 9). This evidence therefore rejects the conventional New Keynesian theory, according to which the boom amplitude should have a bearing on the subsequent economic downturn.
On the other hand, it is easy to detect a strong relationship between the size of the economic decline and the subsequent economic recovery.
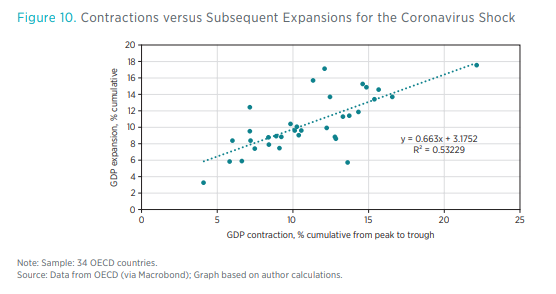
Although the coronavirus shock certainly has supply-side components, it is abundantly clear by now that the stop-and-go economy, with governments implementing temporary shutdowns and/ or people deciding not to leave their homes because of the risk of getting infected, is mainly negatively affecting aggregate demand. A more recent paper shows that a multisector economy can exhibit “Keynesian supply shocks”—that is, a supply shock can trigger changes in aggregate demand that are larger than the initial shock itself. We can thus use the recent coronavirus recession to test the plucking hypothesis.
Using data for 34 Organisation for Economic Co-operation and Development (OECD) countries, I measure the contraction and the subsequent boom as the cumulative GDP decline from peak to trough and the cumulative GDP expansion from trough to the most recent observation in Q1 2021, respectively. The R2 of this regression is above 50 percent, meaning that there is a relatively tight correlation between the size of the bust and the size of the subsequent recovery. Moreover, most economies had only experienced a partial recovery from the coronavirus recession at that point, meaning that the regression in figure 10 potentially underestimates the strength of the plucking relationship.
For the coronavirus economic shock, we thus find significant evidence that the contraction amplitude can predict the subsequent economic recovery.
The preliminary evidence therefore rejects hypothesis 1 while confirming hypothesis 2. This is also in line with Hartley who finds evidence in favor of the plucking model using long-run international macroeconomic history data.28 More specifically, the plucking property seems to have become stronger with industrialization and is, in general, associated with high-income countries. At least for industrialized economies, the data show that current business cycle dynamics contradict the standard New Keynesian interpretation while supportive of Friedman’s plucking model.
POLICY IMPLICATIONS AND THE FED’S NEW AIT FRAMEWORK
There are big implications for monetary policy that come out of the plucking model of the business cycle. The evidence that advanced economies have spent most of their time well-below full potential for many years is increasing. For the United States, the CBO measure suggests that the economy has operated with sometimes substantial slack since the 1980s (figure 1 in the appendix). It also implies that monetary policy has mostly been tight in recent decades.
Moreover, policymakers have put far too much emphasis on inflation, and given the flatness of the Phillips curve, these mistakes have been costly in terms of output stabilization. In 2008, for example, the Fed was extremely worried about rising commodity prices as oil prices were spiking. As a result, monetary policymakers were reluctant to provide additional easing between April and October 2008 out of fear for too much inflation even as the economy was already contracting. Later, in the 2015–2018 period, the Fed started to “normalize” interest rates because monetary authorities thought the economy was getting closer to full employment and would overheat if interest rates were not raised.
We know now that the interest rate tightening cycle during this time was premature. Fed officials had overestimated the natural rate of unemployment and the prospects of inflation. This led to a sharp appreciation of the dollar in 2015, which caused a decline in industrial production and economic activity in the Midwest. Neil Irwin even argues that manufacturing recession in the rust belt had substantial consequences as it went largely unnoticed in the rest of the country at the time. There is evidence that voting for Trump was correlated with economic anxiety. The premature Fed tightening, which caused the strong dollar and a regional recession, might just have delivered the 70,000 votes that Trump needed 1 year later to pull off his electoral college win in 2016.
Over the course of the Trump presidency, the unemployment rate fell even further to about 3.5 percent at the end of 2019, thus defeating even some of the more optimistic forecasts from a few years earlier based on the natural rate estimate. Although the substantial fiscal impulse that resulted from the Trump tax cuts did allow the Fed to hike rates at a somewhat faster pace, the economy did not show signs of overheating at the peak of the cycle even as the federal funds rate reached only 2.5 percent amid a global economic environment of super-low interest rates.
As the result of the coronavirus pandemic, millions of people lost their jobs again within a very short time frame. It is therefore encouraging that the Fed has recently introduced a new monetary policy framework, AIT.
With the new AIT framework, the Fed recently delayed planning to tighten monetary policy even as inflation substantially exceeded 2 percent throughout 2021 until it became convinced that inflation was becoming excessive and the labor market was approaching full employment. This loose monetary policy stance led to a very quick recovery following the severe economic contraction in 2020, with nominal GDP now already exceeding its pre-coronavirus trend.
This new policy framework builds directly on the work of some prominent New Keynesians from the Princeton school of macroeconomics like Paul Krugman, Ben Bernanke, and Lars Svensson who made the case for makeup policies through the use of level targets, which can be seen as a commitment to make up for past shortfalls. Similarly, market monetarists like Scott Sumner and David Beckworth have also repeatedly emphasized that level targets would be superior, especially if the Fed focuses on nominal GDP instead of the price level, since it is deviations from nominal income growth that matter more for macroeconomic fluctuations instead of inflation deviations.
AIT is a step in the direction of a nominal GDP target without actually implementing one. It allows the economy to temporarily run hot after a recession and recover lost ground. The makeup component includes aggregate nominal income and therefore better stabilizes household and business incomes. Moreover, the Fed is doing this from the perspective of minimizing shortfalls from maximum employment rather than worrying about symmetric fluctuations around it. Therefore, the Fed’s new framework can be seen as implementing something close to a nominal GDP target in the context of a plucking model view of the business cycle.
And we already have evidence that it is working. The US economy recently entered a period of rapid expansion. As of the last quarter of 2021, nominal GDP was exceeding its prepandemic growth path and growing at a rate of more than 10 percent.
WHAT WOULD FRIEDMAN THINK?
It is always dangerous to assume that one would know how a certain famous dead economist would respond to current events. However, in the case of Friedman, we certainly have some records from the recent past that can give us some indication.
Friedman’s Nobel lecture goes into great length to discuss the relationship between inflation and unemployment. He argues against a long-run tradeoff between those two variables based on the framework of the natural rate hypothesis. Although the short-run Phillips curve might be downward sloping, policymakers cannot exploit the relationship because the long-run aggregate supply curve is vertical. In a sense, it is therefore ironic that Friedman was a founding father of the neoclassical synthesis while at the same time suggesting the plucking model as an alternative earlier on during his long career. His work and writings show, however, that he was married to the natural rate hypothesis and maybe to a fault. His views are well summarized in the conclusion of his Noble Prize lecture:
"There is a “natural rate of unemployment” at any time determined by real factors. This natural rate will tend to be attained when expectations are on the average realized. The same real situation is consistent with any absolute level of prices or of price change, provided allowance is made for the effect of price change on the real cost of holding money balances. In this respect, money is neutral. On the other hand, unanticipated changes in aggregate nominal demand and in inflation will cause systematic errors of perception on the part of employers and employees alike that will initially lead unemployment to deviate in the opposite direction from its natural rate. In this respect, money is not neutral. However, such deviations are transitory, though it may take a long chronological time before they are reversed and finally eliminated as anticipations adjust."
At the same time, we know from Friedman’s work on the Great Depression that he was also an empiricist and econometrician. Given the empirical evidence presented above, it is very conceivable that Friedman could have reconsidered his view concerning the natural rate hypothesis and shifting back toward the plucking view of the business cycle.
Friedman’s original work on the plucking model suggests that the data do not speak in favor of the Austrian/New Keynesian business cycle theory, according to which the size of the boom is predicting the size of the subsequent crash:
"It would cast grave doubt on those theories that see as the source of a deep depression the excesses of the prior expansion (the Mises cycle theory is a clear example)."
Friedman’s exposition of the plucking model preceded his later work on the natural rate model but unfortunately never gained much traction until more recently. More than half a century later, it looks like policymakers at the Fed and academic economists are reconsidering plucking as a plausible alternative to the New Keynesian business cycle theory. It is therefore quite likely that Friedman would have favorably reconsidered his earlier work in light of recent events.
CONCLUSION
The key takeaway from this essay is that mainstream macroeconomics might have operated under a faulty framework for decades. We have increasing evidence that economies behave more like what Friedman’s plucking model suggests instead of following standard New Keynesian business cycle dynamics.
The natural rate assumption of output and employment fluctuations seems to be faulty. According to the CBO measure, the US economy has operated below full capacity for most of the time since the 1980s. Furthermore, there is very little evidence that the US economy has been experiencing a strong boom at any time in recent decades. This should call into question the assumption of symmetric fluctuations around a natural rate and should be a big concern for policymaking institutions. Policy mistakes like the ones that were made post-2008 can negatively affect the entire economy beyond the short run and therefore impact the lives of millions, given that employment shortfalls can persist for years.
More recently, policymakers at the Fed have shifted away from the mainstream consensus and embraced different models of how the economy actually works. The adoption of the new AIT regime makes it abundantly clear that they want to minimize shortfalls from full employment before even considering a tightening process or “normalization” of interest rates, thus openly embracing a plucking view of the business cycle, as argued by Tyler Powell and David Wessel. We have also seen a large shift in monetary policy and unconventional thinking at the European Central Bank where many policymakers have recently embraced aspects of the secular stagnation hypothesis.
Macroeconomics has therefore but one way forward, and that is to embrace Friedman’s plucking model together with components of Lawrence Summers’s secular stagnation theory, both of which arguably describe the dynamics of current business cycles much better than the New Keynesian paradigm. Central banks certainly have made some progress with the Fed now openly embracing the idea of minimizing shortfalls from full employment.
This also implies that the Great Moderation should carry a different label. Since output gaps have been negative some 80 percent of the time since the 1980s, “Great Stagnation” or “Long Stagnation” would certainly be a more fitting name. Let us hope that the bold policy measures undertaken by central banks due to the current coronavirus shock and the novel reconsideration of macroeconomic policies by policymakers this time will allow us to hit full employment and get closer to a high-pressure economy sooner rather than later.
Citations and endnotes are not included in the web version of this product. For complete citations and endnotes, please refer to the downloadable PDF at the top of the webpage.

