- | Financial Markets Financial Markets
- | Public Interest Comments Public Interest Comments
- |
Bank Instability Concerns Asset Risk and Leverage Rather Than Size
I appreciate the opportunity to submit comments to the US Department of Justice (DOJ) Antitrust Division’s request for input concerning revisions to the 1995 banking guidelines or to the competitive analysis of bank mergers. As a senior research fellow at the Mercatus Center at George Mason University, my comments reflect my own views and do not represent those of any particular affected party or special interest group. My comments specifically reflect concerns I have about recent commentary during the 2020 Antitrust Division banking guidelines review about the alleged relationship between the declining number of banks and financial instability.
I recommend that any revisions to the DOJ’s merger guidelines take into account the following:
- The unusually large number of small banks in the United States before the establishment of the Federal Deposit Insurance Corporation (FDIC) as well as the large number of bank failures
- The ways that the unusually large number of pre-FDIC banks contributed to the large number of bank failures during the many banking crises before the establishment of the FDIC
- Alternative market structures with fewer, highly capitalized banks and the potential of high bank capital to serve as the primary entry requirement
- The fact that the 1800 Hirschman Herfindahl Index (HHI) threshold, as well as the view that banking is primarily a local enterprise, likely arose from the historical bias toward small banks
Failing to account for what happened before the creation of the FDIC will result in misleading analyses about the decline in the number of banks arising from mergers on the US banking landscape and financial stability risks.
Historically, The United States Has Had Many Banks (and Many Bank Failures)
Research in banking history suggests that the United States has had a large number of banks. A key reason for that lies with the US Constitution, which (a) prohibits states from issuing their own currency and (b) prohibits the taxation of interstate commerce. The prohibition of state-issued currencies has resulted in states turning to other means to finance expenditures such as the granting of state banking charters. And because having out-of-state banks that cannot not be taxed operate in states’ jurisdictions would mean a reduction in state tax revenues, until the late 1970s, interstate banking was virtually nonexistent. Not only was interstate banking prohibited for much of US history, but also many states prohibited branch banking, such that most banks throughout the United States were unit banks. By contrast, bank charters in Canada were granted at the federal level, and as a result Canada has had a comparatively small number of banks that can have branches operating from coast to coast.
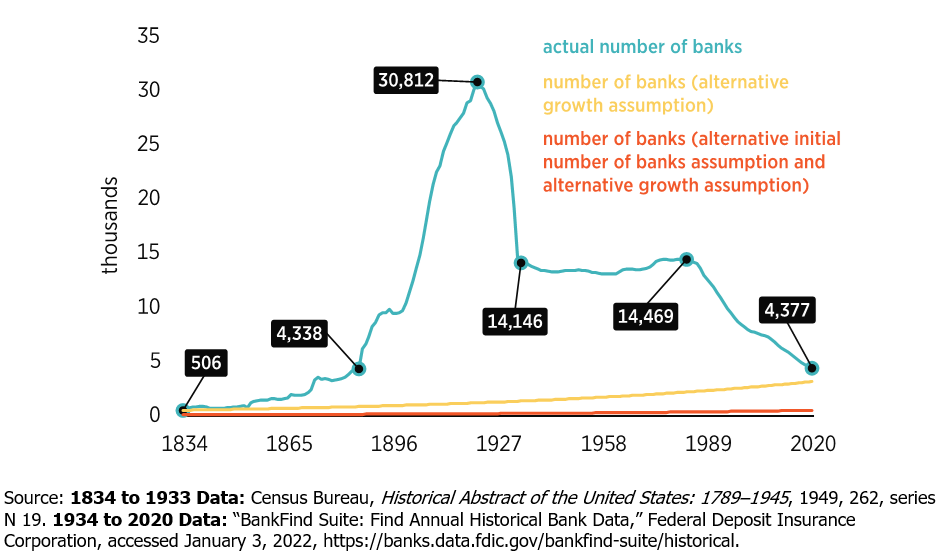
Figure 1 depicts the number of banks in the United States from 1834 to 2020 in actuality as well as in two hypothetical scenarios. The first hypothetical scenario assumes that there were 506 banks in 1834 and that the number of banks grew in line with the population, about 0.9 percent per year. The second hypothetical scenario assumes that there were only 80 banks (the number in existence in Canada today) in 1834 and that the number grew in line with the population, about 0.9 percent per year. In the first hypothetical case, the number of banks at the end of 2020 is 3,149; in the second hypothetical case, the number of banks at the end of 2020 is 498; and the actual number of banks at the end of 2020 was 4,377. Economic analysis does not provide a definitive answer concerning what the optimal number of banks is, and as a result neither the actual nor hypothetical paths indicate a correct number of banks. However, the numerical exercise illustrates the path dependence of the number of banks arising from the “rules of the game” concerning bank chartering in the United States. Therefore, the question to ask now is not “Why is America losing so many banks,” as some recent antitrust commentary seems to ask, but rather, “Why did America have so many banks in the past?”
Figure 1 shows that the actual number of banks in 1834 was 506, owing to the prohibition of banks from operating across state lines. But from 1834 to 1921, the number of banks grew from 506 to 30,812. By 1934, the number of banks had fallen to 14,146, less than half of the 1921 peak, owing to the five minor banking panics in the 1920s and the major banking crises from 1930 to 1933. From 1934 to 1983, the number of banks remained within a historically narrow range of 13,114–14,469. Since 1983, the number of banks has declined to 4,377, which is roughly the same as the number in 1886, when there were 4,338.
Figure 1. Number of Banks in the United States, 1834–2020
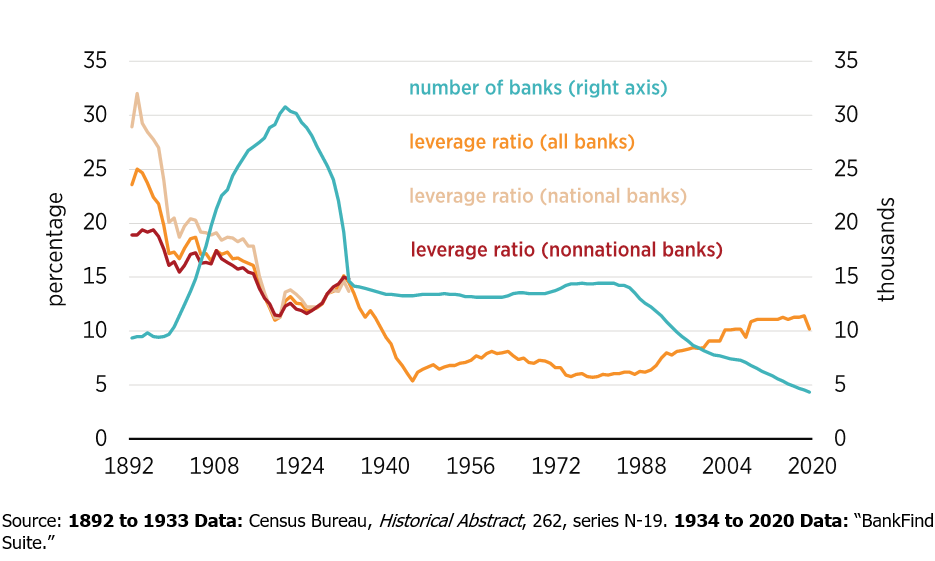
The rise in the number of banks through 1921 was in large part a result of the reduction in bank capital requirements, with national banks tending to have more capital than other banks and thereby tending to be more resilient. Bank capital for the industry declined by nearly 15 percentage points before 1921, and the number of banks increased by more than 22,000. Demonstrating this change, figure 2 depicts the book equity to asset “leverage” ratio for all banks, for national banks regulated by the Office of the Comptroller of the Currency, and for other banks regulated by states; it also depicts the number of banks for each category. I will return to the role of bank capital in fostering financial stability later.
Using all available FDIC data, I further break down what contributed to changes in the number of banks from 1935 to 2020, assuming that the population at the end of the year equals the population at the beginning of the year plus births minus deaths. Applying this view to banks gives the following equation:
number of banks at end of year = number of banks at start of year + de novo banks − banks eliminated through mergers, acquisitions, failures, or liquidations
Figure 2. Number of and Leverage Ratio for All Banks, National Banks, and Other Banks, 1892–2020
Using FDIC historical statistics, figure 3 shows that, since 1935, the change in the number of banks has come largely from bank exits, primarily unassisted mergers that reflect mergers, acquisitions, and, to a lesser extent, failures arising from supervisory actions or insolvencies.
In total, since 1935, there have been an estimated 19,668 unassisted mergers and 2,880 failures arising from supervisory actions or insolvencies, offset by 10,673 new bank charters, which on net means a reduction of nearly 12,000 from these sources. Bank exits arising from unassisted mergers reached a peak of 682 in 1997 (about 7.5 percent of all banks), but the trend in the annual number of mergers has been declining since then, such that in 2020 there were only 149 (about 3.4 percent of all banks). Bank exits arising from failures peaked in 1990 at 345 (about 2.8 percent of all banks) during the savings and loan crisis. Bank entry in a given year during the same period has never exceeded 3.0 percent and was limited during the early years of the FDIC and over the past decade.
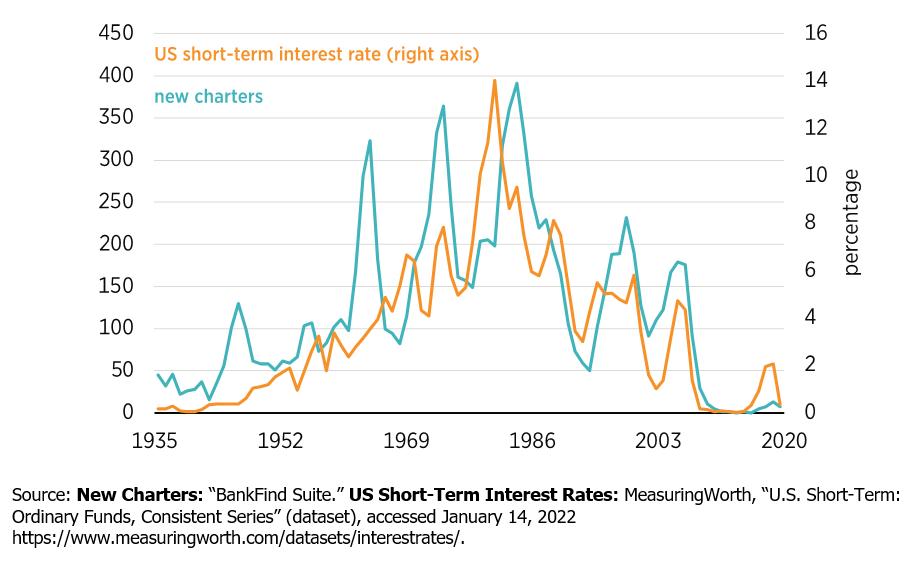
Interest rates determine net interest margins, which play a key role in determining bank entry. Figure 4 shows that when interest rates rise/fall, bank entry has tended to rise/fall. The current low interest rate environment creates disincentives for entrepreneurs to enter the banking sector. As long as interest rates remain low, bank entry will likely remain low.
Figure 3. Bank Entry and Exit 1935–2020
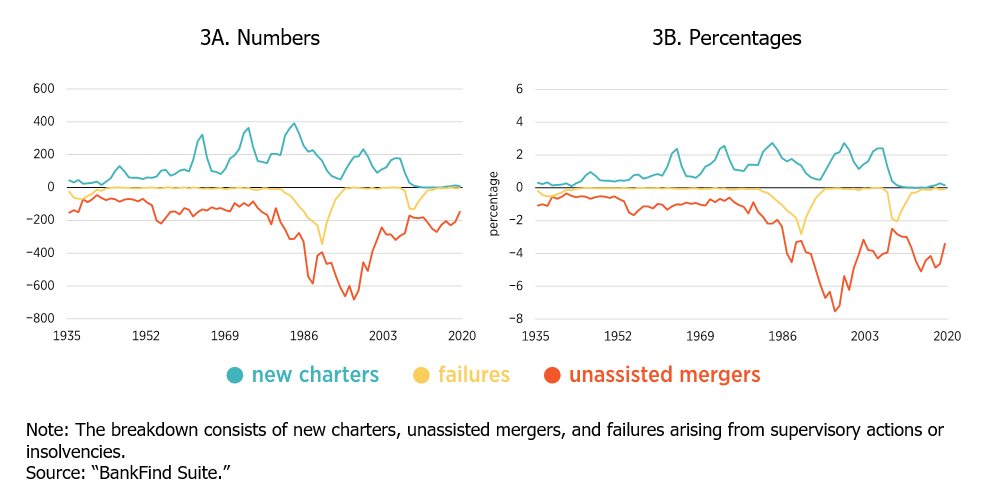
Figure 4. Interest Rates and Bank Entry, 1935–2020
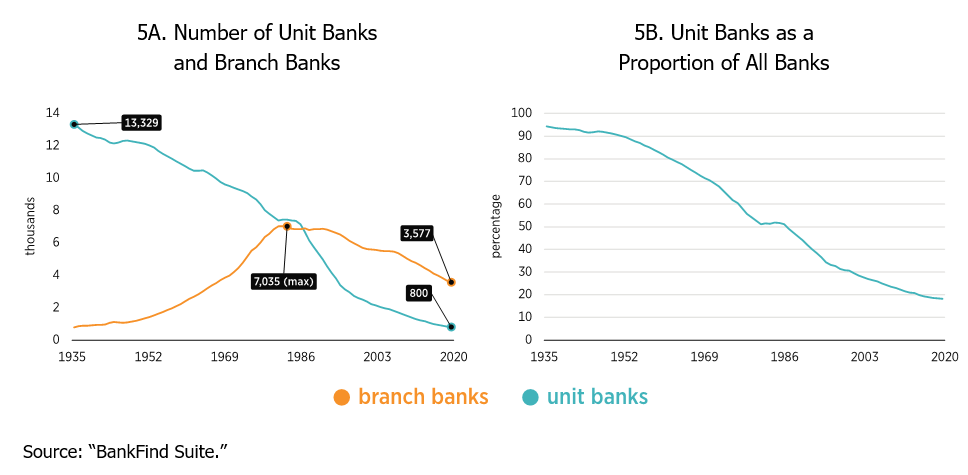
Overall, the large number of banks in the United States has been caused by events that occurred before the establishment of the FDIC, including and by the historical prevalence of unit banks. Figure 5 depicts the fraction of banks that are unit banks since the establishment of the FDIC. In 1935, of the 14,125 banks, 13,329 (over 94 percent) were unit banks, and fewer than 800 banks had branches. Although the number of unit banks has declined significantly, even at the end of 2020, 800 of the 4,377 banks in the United States (about 18 percent) were unit banks. The large number of small banks predates the existence of the FDIC and contributes to frequent crises in the United States.
Figure 5. Unit Banks, 1935–2020
Historically, Many Small Banks Has Meant Many Panics
With state prohibitions on branching and interstate banking in effect, between 1819 and 1929, the United States experienced 8 major crises (1819, 1833, 1837, 1839, 1857, 1873, 1893, 1907) and 20 minor ones (1841, 2 in 1842, 1851, 1854–1855, 1860, 1861, 1884, 1890, 1896, 1899, 1901, 1903, 1905, 1908, 1920, 1920–1921, 1926, 1927, 1929). Then came the banking crises during the Great Depression, from 1930 to 1933. The banks that failed were small and often unit banks. Even the savings and loan crisis (1980–1992 and especially 1987–1992) happened in what was still a small-bank era. By contrast, since confederation in 1867, Canada has experienced recessions and bank failures but no system-wide banking crises because its larger banks have operated coast to coast, diversified assets across regions, and attracted deposit funding across regions. This has occurred even though Canada experienced a period in which banks consolidated, did not establish a central bank until 1935, and did not create deposit insurance until 1967. It is therefore misleading to draw a link between banking industry concentration and financial instability, as some did during the comment period of the 2020 Antitrust Division banking guidelines review.
In table 1, I report updated results from a previous publication, using slightly different specifications to estimate the determinants of the probability of a major banking crises from 1892 through 2020. I use probit, logit, and complementary log-log estimators to show robustness across assumed distributions for the outcome variable.
As a dependent variable, I use a dummy variable that equals one if a banking crisis occurs in a given year, as in 1893, 1907 (coded as 1908 because it happened at the end of the year, as Andrew Jalil suggests), 1930–1933, 1987–1992, 2007–2009. I exclude 2020 as a banking crisis year because the turmoil arising from the COVID-19 pandemic affected primarily the real sector and there were only three bank failures—however, I get similar results if I include 2020 as a crisis year. The regression specifications in columns 2–4 include the following as independent variables: (a) the one-year lagged total banking sector equity-to-assets ratio minus 15 percent (to show what happens when that ratio is less or greater than 15 percent), (b) the one-year lagged natural log of the cyclical component of the number of US banks extracted from the filter proposed by Lawrence Christiano and Terry Fitzgerald from 1891 to 2019 as a measure of the effect of the above- or below-trend number of banks on the probability of banking crises, (c) one-year lagged inflation, and (d) one-year lagged returns on the S&P 500.
Table 1. Probit, Logit, and Complementary Log-Log Estimates of Banking Crises, 1892–2020
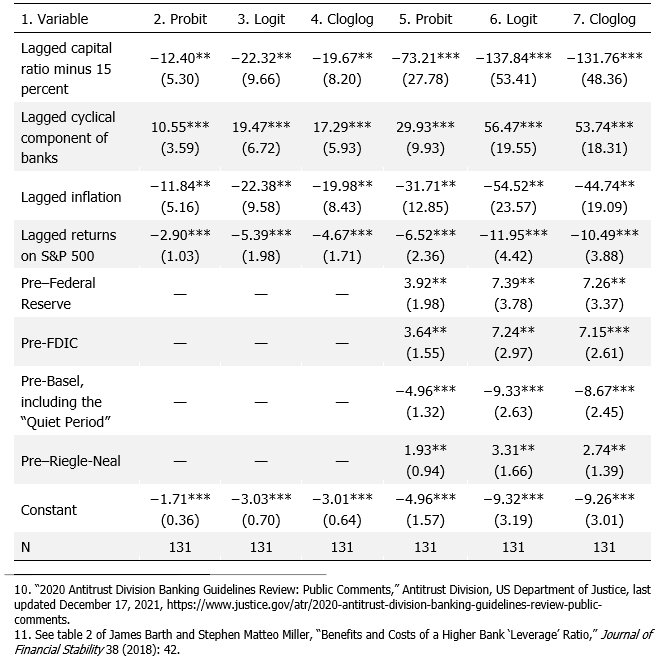
In columns 5–7, the regressions also include dummy variables for (a) the pre–Federal Reserve (Fed) period 1892–1912, which reflects the post–National Bank Act period, when national banks were subject to double liability and supervision was done by the Office of the Comptroller of the Currency and the states; (b) the pre-FDIC period (1892–1933) after the creation of the Fed; (c) the pre-Basel period (1892–1987), which includes the “Quiet Period,” a name garnered by having no major banking crises; and (d) the pre–Riegle Neal Act period (1892–1994), which occurred before initiatives to begin full-scale interstate banking began.
The number of banks exceeding the trend number of banks in a given year is associated with a higher probability of a banking crisis the following year. This result is consistent with the fact that having an unusually large number of (small) banks enter the market in the United States has historically preceded banking crises. A key reason is that before the establishment of the FDIC, capital was a key barrier to entry, but the competition between the Office of the Comptroller of the Currency and the states to create charters often resulted in bank capital requirements declining to attract banks to the charters with the lowest requirements. New banks entered when bank capital requirements were reduced. In addition, higher inflation is associated with a lower probability of a banking crisis the following year. Lastly, greater stock returns are also associated with a lower probability of a banking crisis the following year.
The “regime” dummy coefficient estimates for “Pre-Basel, including the ‘Quiet Period’” suggest that that period had the lowest association with banking crises. Furthermore, the period following the passage of the Riegle Neal Act is associated with a lower probability of a banking crisis compared with the “Pre–Federal Reserve” and “Pre-FDIC” periods.
Consistent with many studies in the banking literature, I find that, across specifications, higher capital is associated with a lower probability of a banking crisis the following year. To visualize the relationship between the leverage ratio and the probability of banking crises, drawing from the probit specification in column 2, figure 6A depicts the predictive margins of the relationship between the probability of a banking crisis and the gap between the actual leverage ratio and 15 percent. Figure 6B depicts the marginal effects at representative values of the relationship between changes in the probability of a banking crisis and changes in the leverage ratio. The other estimators yield similar schedules.
Figure 6. Bank Capital and the Probability of a Banking Crisis
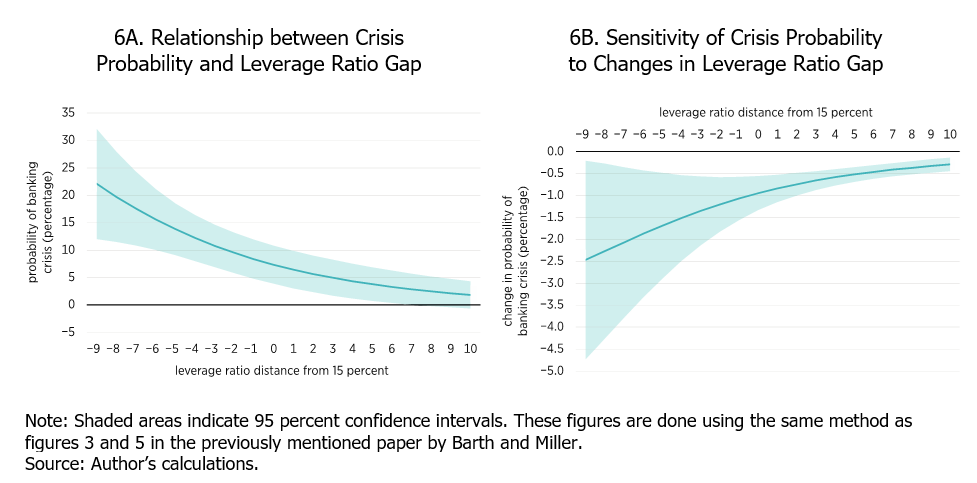
At the 2020 value of the leverage ratio of approximately 10 percent (5 percentage points below the 15 percent reference threshold in figure 6A), the probability of a banking crisis equals 13.8 percent. As the leverage ratio falls to 6 percent (9 percentage points below the 15 percent reference threshold in figure 6A), the probability of a banking crisis increases to 22 percent. However, if the leverage ratio increases to 15, 20, or 25 percent, the probability of a banking crisis falls to 7.4, 3.8, and 1.8 percent, respectively. Figure 6B shows that, as the leverage ratio increases, the probability of a banking crisis decreases at a decreasing rate.
Leverage and bank asset risk are key factors in bank failures, given that greater leverage (as reflected by a lower leverage ratio) means that a bank is closer to default and that riskier assets have greater likelihood of experiencing distress. Figure 7 compares the average ratios of total equity to total assets measured using estimated market values and book values for the so-called advanced approaches banks, which are the largest in the United States and the focus of Basel III capital regulations, as well as all other banks from Q1 2000 through Q4 2020 using the approach used by Alistair Milne. The results show that, on average, by the end of the sample, the market and book equity leverage ratios for advanced approaches banks were less than 10 percent, whereas for other banks the average was 15 percent.
Figure 7. Average Market and Book Leverage Ratios for Advanced Approaches Banks and Non-Advanced-Approaches Banks, Q1 2001–Q4 2020
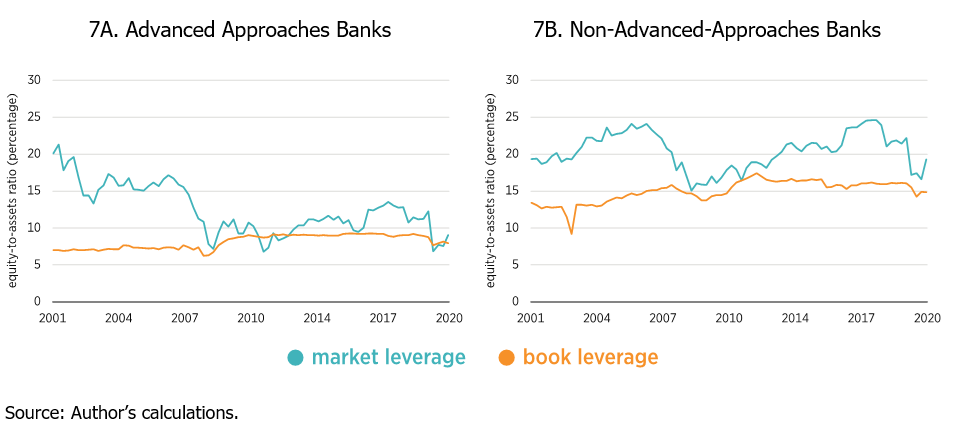
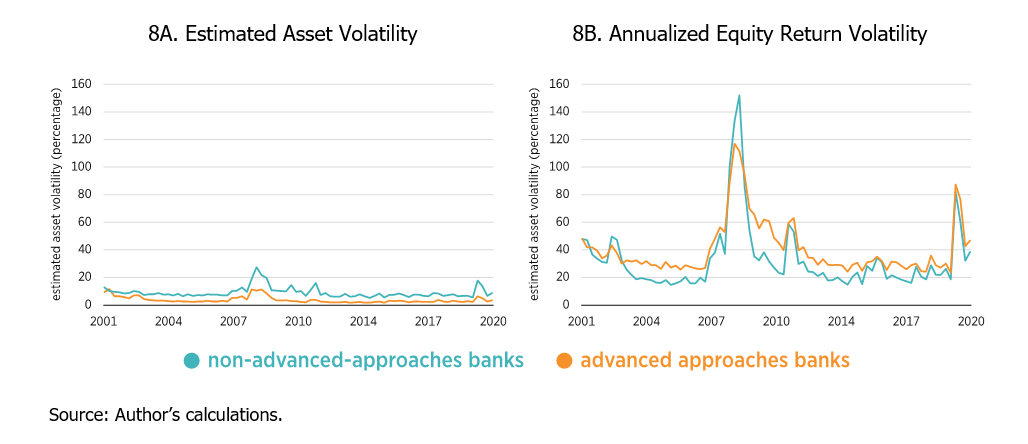
Figure 8 shows that, in estimated asset risk, advanced approaches banks on average have lower estimated asset risk than other banks; these estimates are based on on-balance sheet assets. Similarly, the equity return volatility for advanced approaches banks on average lies below that of other banks, although in 2008 that was not the case.
Figure 8. Average Asset Volatility and Equity Volatility for Advanced Approaches Banks and Non-Advanced-Approaches Banks, Q1 2001–Q4 2020
Among the implications of the empirical exercises summarized in table 1 and figures 6A and 6B are the following:
- During periods with a greater-than-trend number of banks—owing to, for instance, easy entry—the probability of a banking crisis has historically been higher.
- During periods with lower bank capital, the probability of a banking crisis has historically been higher.
- No major banking crises occurred during the “Quiet Period” after the creation of the FDIC. However, the “Quiet Period” arose not just because regulators restricted entry, but also because banks held many federal government liabilities (making their portfolios safer), the Fed stood ready to intervene as a lender of last resort, and inflation was low, although the stability was undermined once inflation began to rise in the 1970s. Unfortunately, regulators cannot recreate the “Quiet Period.”
Other implications of the literature-based discussion are as follows:
- Having larger banks that are not well capitalized, as the United States did during the 2007–2009 crisis, contributed to that crisis.
- Having fewer and larger banks, as in Canada, where banks have historically operated with more capital and extensive branch networks, contributes to financial stability.
Alternative Market Structures
The foregoing analysis suggests that the largest banks are more leveraged but do not necessarily have riskier assets, although the measures of asset risk exclude some potentially risky activities found off balance sheet. The question is: Should those assets be held by thousands of banks, as in the United States, or by a small number of banks, as in Canada (which has about 50 domestic and 30 foreign banks)? Or is the answer somewhere in between? Although I am not suggesting that US regulators adopt the Canadian approach, the US-Canada comparison offers useful perspectives on alternative market structures for banking systems. For instance, after inferring what the US banking landscape might look like if the United States were to have something like the system in Canada in 1990, David Mengle offers California in 1990 as a possible alternative.
In September 2020, the United States had about $20.0 trillion in total banking assets, and today those assets continue to grow in line with the economy (see table 2). In Canada, there were about $5.6 trillion (based on $7.0 trillion and a USD-CAD exchange rate of 0.8) in total banking assets as of September 2020.
Table 2. Comparing Average Total Asset Sizes
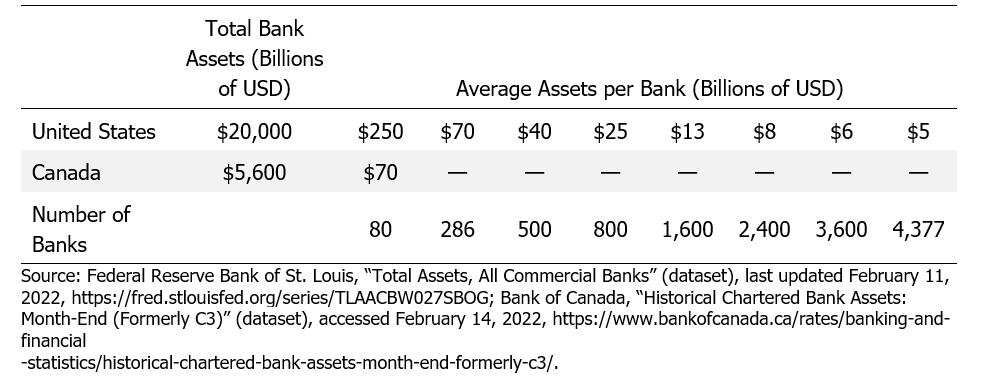
By comparison, the average total assets per bank in the United States is about $5 billion, roughly one-fourteenth of the total in Canada. If the United States were to have 286 banks, average total assets per bank would be roughly the same as in Canada. If the United States were to have virtually no unit banks, reducing the total number of banks to about 3,600, then the average bank size would increase to $6 billion. This figure of 3,600 banks is, incidentally, close to the 3,700 banks that Mengle suggests might exist if the United States were to adopt the “California” model instead of the “Canadian” one. Even if the number of banks were to fall to 500, roughly the number in 1834, that event would still only imply average total assets per (equal-sized) bank of $40 billion.
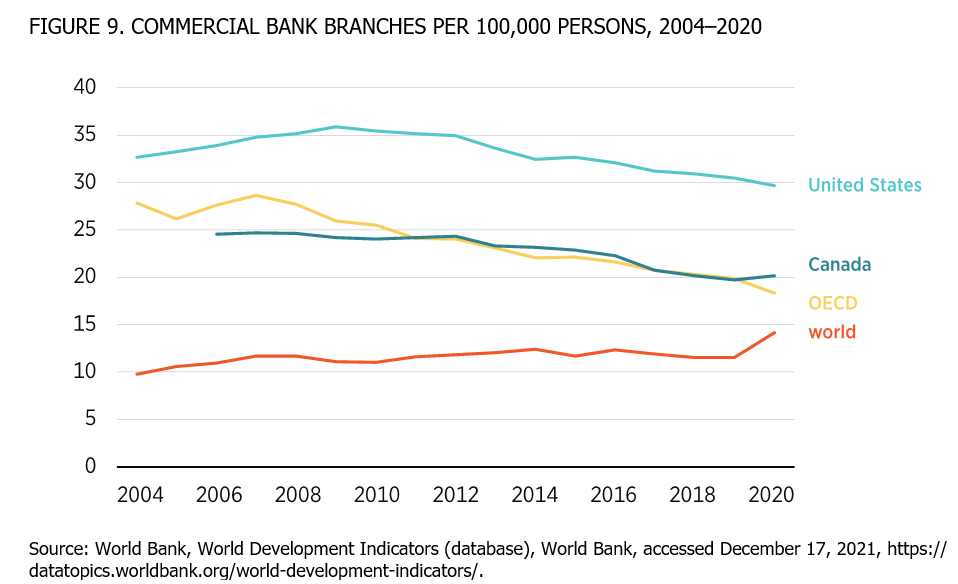
A related issue is the number of branches (see figure 9). The number of commercial bank branches per 100,000 people has been increasing worldwide. However, that change primarily reflects what has occurred among lower-income countries. In higher-income countries, such as members of the Organisation for Economic Co-operation and Development (OECD)—and not just the United States—the number of commercial bank branches per 100,000 people has been declining over the past decade. The number of branches in the United States, though lower than the numbers observed in some European countries (not shown in figure 9), is greater than the number of branches in Canada or those across the OECD.
Figure 9. Commercial Bank Branches per 100,000 Persons, 2004–2020
US Banks, Small or Large, Have Always Had Political Power, But Merger Guidelines Still Reflect the Small-Bank Era
A popular view today is that small banks historically have been politically weak and that it is only today’s large banks that have too much power. This view has inspired recent interest in antitrust enforcement and other measures to limit political power. In fact, small banking interests had formed a powerful political alliance with agrarian interests and dominated banking politics from the early years of the United States until the 1980s. It does not stand to reason that simply legislating or regulating away banks of a certain size will affect political power.
With that in mind, I have discussed throughout this comment how the United States historically has had many small banks, often unit banks, that were not allowed to operate across state lines, and the beginning of the end of the small-bank era occurred in the late 1970s. The reference to concentration in bank merger guidelines arose during the 1960s, and although the guidelines intend to guard against local monopolies, they may actually hurt so-called stuck areas: primarily rural areas with community banks where the HHI may exceed the merger guideline thresholds.
Therefore, although local competition is important to consider in merger guidelines, by focusing on local economic concentration, the agency risks potentially understating the financial stability benefits of branching across state lines and regions that can arise from mergers.
Conclusion
From a historical perspective, higher capital seems an important tool at policymakers’ disposal to address concerns about financial instability. Although a bank merger creates a larger bank, the “fail” in “too big to fail” primarily concerns leverage and activity or asset risks. Concerns about mergers creating larger banks that might fail should be counterbalanced by the recognition that larger banks can better diversify across regions than smaller banks. These concerns may also conflate the size of institutions with the fact that larger banks tend to operate with less capital than smaller banks. Accordingly, the financial stability concerns arising from mergers should focus on how small capital is for the combined bank, not just the size of the institution.

