- | Housing Housing
- | Research Papers Research Papers
- |
Ranking the States by Fiscal Condition | 2016 Edition
A new study for the Mercatus Center at George Mason University ranks each US state’s financial health based on short- and long-term debt and other key fiscal obligations, such as unfunded pensions and healthcare benefits.
This 2016 edition updates the version the Mercatus Center published in 2015. Using the approach pioneered in 2015, the 2016 edition presents information from each state’s audited financial report in an easily accessible format, this time including Puerto Rico to provide a benchmark of poor fiscal performance.
Growing long-term obligations for pensions and healthcare benefits continue to strain the finances of state governments, highlighting the fact that state policymakers must be vigilant to consider both the short-term and the long-term consequences of their decisions. Understanding how each state is performing in regard to a variety of fiscal indicators can help policymakers as they consider the consequences of policy decisions.
The study also highlights some of the limits of the financial data reported by state governments. States release these data years after they are most relevant, and because the information is highly aggregated, analysts and the public have difficulty discerning the true fiscal position of any state.
Summary and key findings
The financial health of each state can be analyzed through the states’ own audited financial reports. By looking at states’ basic financial statistics on revenues, expenditures, cash, assets, liabilities, and debt, states may be ranked according to how easily they will be able to cover short-term and long-term bills, including pension obligations.
This ranking of the 50 states and Puerto Rico is based on their fiscal solvency in five separate categories:
- Cash solvency. Does a state have enough cash on hand to cover its short-term bills?
- Budget solvency. Can a state cover its fiscal year spending with current revenues, or does it have a budget shortfall?
- Long-run solvency. Can a state meet its long-term spending commitments? Will there be enough money to cushion it from economic shocks or other long-term fiscal risks?
- Service-level solvency. How much “fiscal slack” does a state have to increase spending if citizens demand more services?
- Trust fund solvency. How much debt does a state have? How large are its unfunded pension and healthcare liabilities?
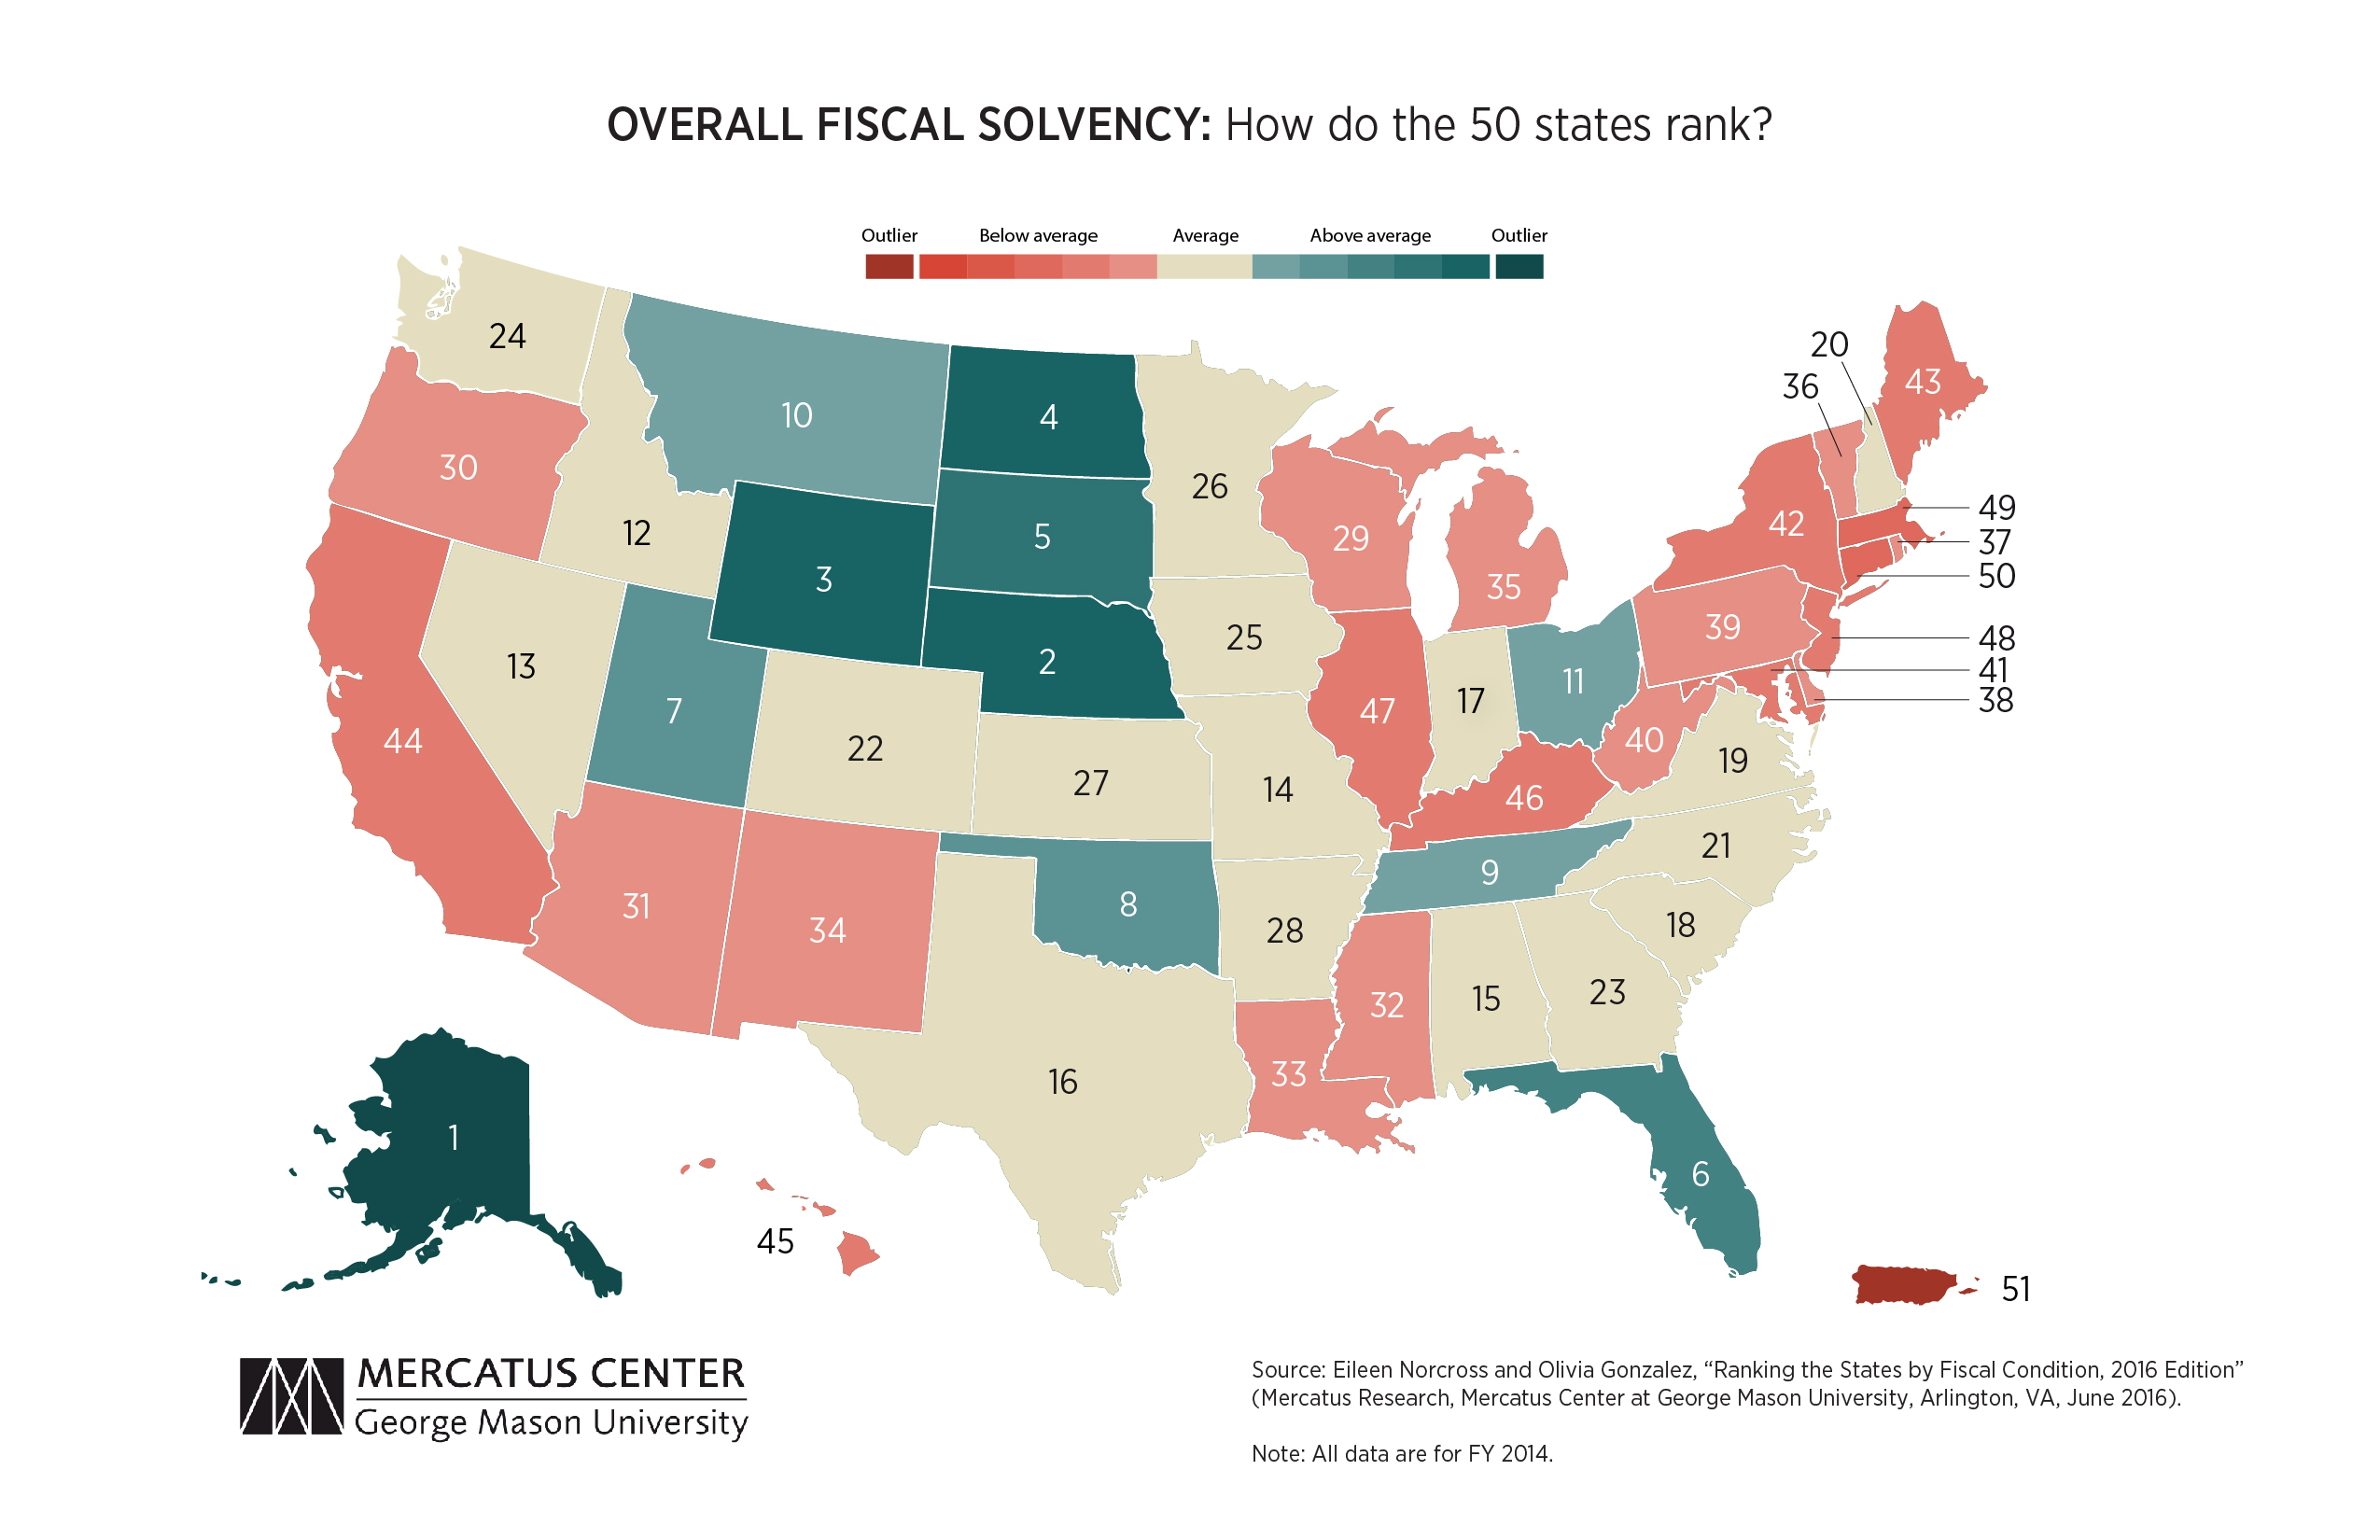
Top five states
Alaska, Nebraska, Wyoming, North Dakota, and South Dakota rank in the top five states.
- Pensions and health care will continue to be long-term challenges. While these states are considered fiscally healthy relative to other states because they have significant amounts of cash on hand and relatively low short-term debt obligations, each state faces substantial long-term challenges related to its pension and healthcare benefits systems.
- Unpredictable revenue sources may play a role in short-term fiscal health. The top-performing states owe some of their success to unpredictable revenue sources. Since the most recent data is from fiscal year 2014, it appears as though these states are very well off, but declining oil prices and the budget crises that are currently unfolding in Alaska and other oil-producing states highlight the danger of expanding revenue based on volatile revenue sources.
- The top five states have changed since last year. Wyoming moved from sixth place last year to third place this year, pushing Florida out of the top five. The four remaining states were in the top five last year, but this year Nebraska moved to second place, demoting North Dakota and South Dakota.
Bottom five states
Kentucky, Illinois, New Jersey, Massachusetts, and Connecticut rank in the bottom five states, largely owing to the low amounts of cash they have on hand and their large debt obligations.
- Each state has massive debt obligations. Each of the bottom five states exhibits serious signs of fiscal distress. Though their economies may be stronger than Puerto Rico’s, allowing them to better navigate fiscal crises, their large liabilities still raise serious concerns.
- Unfunded liabilities continue to be a problem. High deficits and debt obligations in the forms of unfunded pensions and healthcare benefits continue to drive each state into fiscal peril. Each holds tens, if not hundreds, of billions of dollars in unfunded liabilities—constituting a significant risk to taxpayers in both the short and the long term.
- The bottom five states have changed since last year. Kentucky’s position has declined, placing it in the bottom five this year. New York is no longer in the bottom five. New Jersey and Illinois improved slightly, but remain in the bottom five. Connecticut and Massachusetts also remain in the bottom five, in slightly worse positions than last year.
Big Movers
To be considered a “big mover,” a state must have shifted position by more than five spots between the 2015 and 2016 editions (which use the latest available data, from fiscal years 2013 and 2014, respectively). A change in ranking of five or fewer places is not considered a significant change in the underlying metrics.
For the most part, states’ overall fiscal performance remained relatively constant. Only Delaware and Iowa dropped significantly in the overall ranking of fiscal condition. But there were big movers in each of the five categories that make up the overall ranking:
- Colorado, Delaware, New Mexico, and Iowa all moved down in the ranking of cash solvency, while Maine and Minnesota both improved.
- Sixteen states changed their ranking within the budget solvency category; six improved significantly and ten worsened. (Budget solvency is more prone to large changes in ranking than the other categories because of the fluctuation in surpluses or deficits from year to year.)
- Two states—Maine and North Carolina—experienced a significant shift in their long-run solvency ranking. Maine fell by eight spots and North Carolina improved by seven spots.
- There was little movement in the service-solvency ranking, except in the case of North Carolina, which improved its position by six places.
- Colorado and Arizona both improved their trust fund solvency ranking. Montana, New Jersey, and Washington moved down in this ranking.
Conclusion
Updating the fiscal condition of the states with another year of data shows that most states’ fiscal performance remains relatively constant, but the signs of fiscal stress persist. Underfunded pensions and healthcare benefits continue to put pressure on state finances. Even states that appear to be fiscally robust—perhaps owing to large amounts of cash on hand or revenue streams from natural resources—must take stock of their long-term fiscal health before making future public policy decisions. These fiscal pressures point to areas for policymakers to direct their efforts. They also highlight areas where improved financial reporting could give the public a clearer picture of states’ fiscal health.

