- | Government Spending Government Spending
- | State Testimonies State Testimonies
- |
Pennsylvania's Fiscal Health: Current Status and Recommendations for Improvement
Testimony before the York County, Pennsylvania Legislative Delegation
Good morning, Representative Grove and members of the York County Legislative Delegation.
My name is Eileen Norcross. I am vice president for policy research and a senior research fellow at the Mercatus Center at George Mason University. My research focuses on state and local fiscal institutions and policies with an emphasis on the solvency of state pension plans and the comparative fiscal performance of the states. Thank you for inviting me today to provide testimony on the current fiscal condition of Pennsylvania.
In my testimony today I will focus on our most recent 10-year study of fiscal condition as it pertains to the Commonwealth of Pennsylvania’s finances. First, I provide basic data on Pennsylvania’s performance for these indicators over a decade (since our study extends only to FY 2016, I have updated three key metrics using FY 2018 Comprehensive Annual Financial Reports [CAFRs] for today’s discussion). I will put these measures in the context of recent fiscal reforms and make three recommendations related to these reforms and ongoing challenges the state is facing:
- Continue to rebuild the state’s Budget Stabilization Fund (the “Rainy Day Fund”) with a view toward reaching a threshold that will enable the state to weather a moderate to severe recession.
- Ensure transparent budgeting practices. Avoid “fiscally evasive” budgeting practices that give the appearance of lower spending.
- Continue to commit to pension reform. Conduct and make publicly available regular stress testing and sensitivity analyses of the state’s pension plans that take into account the effect of economic shocks, investment performance, and the market value of plan liabilities.
Ranking the States’ Fiscal Condition: How does Pennsylvania perform?
Between 2014 and 2018 the Mercatus Center produced an annual ranking of state fiscal condition based on the CAFR of the states. In our most recent report, published October 2018, my coauthor, Olivia Gonzalez, and I applied the metrics to states’ most recently available CAFR (FY 2016) and also to historical CAFRs, producing a 10-year trend line of each state’s fiscal health for FY 2006 to FY 2016.
The purpose of these studies was to create basic and intuitive fiscal metrics for policymakers and the public to easily assess state fiscal condition and direction, based on states’ audited financials. The 13 indicators used in the study are broad and blunt. No single metric or group of metrics can provide sufficient information on a state’s fiscal health. Metrics can help identify patterns and flag possible risks, but they are only as meaningful as the data upon which they are based. Indicators should be used in conjunction with deeper analysis of a state’s fiscal institutions, policies, and overall economy.
Measuring Fiscal Condition
Our approach to measuring fiscal condition is to consider five “dimensions” of solvency: cash, budget, long run, service level, and trust fund. Each dimension of solvency consists of two or three indicators, or basic financial ratios, that capture whether a government has enough resources to cover short-term and long-term commitments. The indicators are based on data taken from each state’s Comprehensive Annual Financial Report (CAFR) for FY 2006–FY 2016.
It should be noted that for 10-year fiscal rankings, which I will highlight in my testimony, we removed the weights we had previously assigned in calculating states’ overall ranks. This had the effect of slightly modifying Pennsylvania’s ranking from previous annual editions of the study.
Pennsylvania’s overall fiscal condition deteriorated over the period we evaluated (see table 1). In FY 2006, Pennsylvania was ranked 28th among the states, climbing to 23rd in 2008, and dropping each year thereafter to a rank of 35th.

Pennsylvania’s drop in the overall rankings is driven largely by declining cash solvency, weak budgetary solvency, and increasing long-term liabilities. The ranking of state fiscal condition is a relative measure and does not carry as much meaning as the state’s absolute fiscal performance.
I now highlight four key metrics for Pennsylvania’s fiscal performance, each representing a different type of solvency: the quick ratio, the operating ratio, the long-term liability ratio, and the ratio of unfunded pension liabilities to state personal income.
Cash Solvency: The Quick Ratio
Between FY 2006 and FY 2016, Pennsylvania’s cash metrics declined steadily. Cash solvency measures whether a state has enough cash on hand to cover short-term bills, which include accounts payable, vouchers, warrants, and short-term debt. Cash solvency consists of three metrics: the cash ratio, the quick ratio, and the current ratio. The quick ratio measures liquid forms of cash, including cash, cash equivalents, investments, and receivables as a percentage of current liabilities. Generally, a healthy quick ratio should be greater than one. While Pennsylvania has only once fallen beneath the threshold for the minimum amount of cash needed to cover short-term liabilities, the trend line points to the risk that the state may not have much of a buffer, should a recession occur. Pennsylvania’s quick ratio fell from 1.74 in FY 2006 to a low of 0.93 in FY 2012, indicating that short-term liabilities exceeded cash by 7 percent in that year. The quick ratio climbed slightly, reaching 1.08 in FY 2016. Updating this metric for FY 2018 shows continued improvement, with a quick ratio of 1.24. As table 2 shows, over the period, Pennsylvania’s ranking for cash solvency dropped from 33rd to 47th.

Budget Solvency: The Operating Ratio
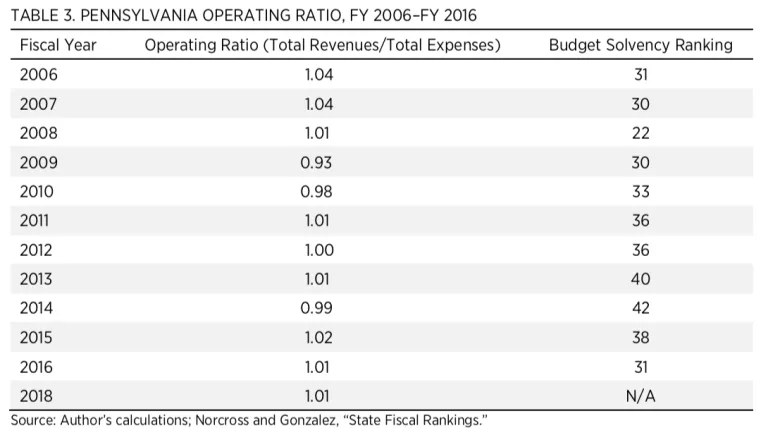
In FY 2016, Pennsylvania ranked 31st in budget solvency. Budget solvency measures if a state can cover current-year spending with current-year revenues, and uses two metrics. First, the operating ratio, which measures the ratio of total revenues to total expenses. The second metric for budgetary solvency measures the direction of the state’s fiscal position, or the surplus or deficit per capita. As table 3 shows, Pennsylvania’s operating ratio has declined over the period, with a low point reached during the 2008–2009 recession. In FY 2006, revenues exceeded expenses by 4 percent. In FY 2016, revenues exceed expenses by 1 percent. In FY 2018, Pennsylvania maintained an operating ratio of 1.01, a factor that has enabled the state to make contributions to the Rainy Day Fund. This metric’s value is to flag sustained structural deficits, or when revenues continually fall short of expenses. The operating ratio has a limitation, as it takes into account only information in the financial statement and does not include an assessment of budgeting practices, spending decisions, and tax policies. The operating ratio should be considered alongside the overall trend in spending, revenue volatility, the state’s tax system, and the extent to which spending growth will necessitate an increase in taxes.
Long Term Solvency: Long-Term Liability Ratio
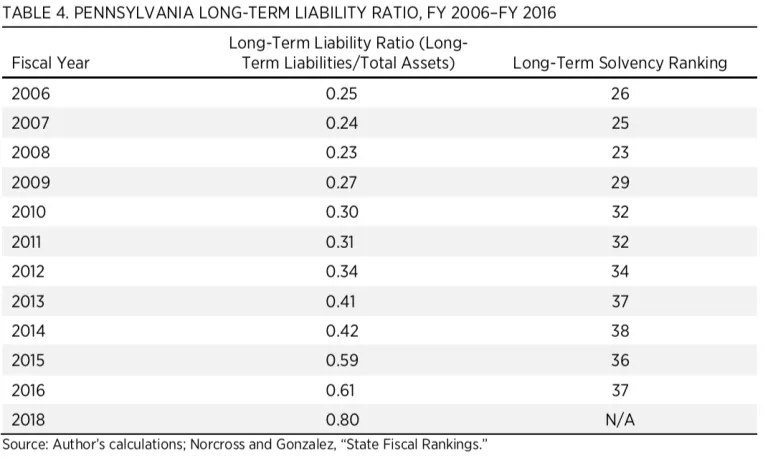
In FY 2016, Pennsylvania ranked 37th for long-run solvency, a decline from FY 2006 when the state was ranked 26th. On an absolute basis, the state’s proportion of long-term liabilities has increased relative to total assets. A low ratio of long-term liabilities to total assets signals good fiscal health.
Long-term liabilities include outstanding bonds, loans, claims and judgments (rendered against the government in a lawsuit), liabilities for pension and post-employment benefits other than pensions (OPEB), and compensated employee absences.
In FY 2006, long-term liabilities were 25 percent of total assets. In FY 2016 they were 61 percent of total assets. This increase is attributable to a change in how states are required to report pension liabilities. In FY 2015 states began to comply with Governmental Accounting Standards Board (GASB) Statement 68, which requires states to report unfunded pension liabilities on their balance sheet. As table 4 shows, Pennsylvania’s long-term liability-to-asset ratio rose from 42 percent in FY 2014 to 53 percent in FY 2015, and again to 61 percent in FY 2016, owing to the fuller recognition of unfunded pension liabilities in the financial statement.
A similar jump in the long-term liability ratio is observed for FY 2018. In FY 2018, GASB Statement 75 came into effect. Statement 75 requires that states report the full unfunded liability for OPEB on the balance sheet. In FY 2016 OPEB liabilities totaled $3.6 billion. In FY 2018, Pennsylvania’s OPEB liabilities are reported as $26 billion. As a result of this change in reporting for OPEB liabilities, Pennsylvania’s long-term liability ratio increased from 0.61 in FY 2016 to 0.80 in FY 2018. With a fuller reporting of both unfunded pension liabilities and unfunded OPEB liabilities, in FY 2018 the commonwealth’s long-term liabilities were 80 percent of total assets.
Trust Fund Solvency: Unfunded Pension Liabilities as Percentage of State Income
Pennsylvania’s overall ranking for trust fund solvency has remained relatively steady over the period (see table 5). In FY 2006 the state ranked 26th; in FY 2016 it ranked 24th. Looking more closely at the metrics shows that unfunded pension liabilities have increased over the period. In FY 2006 unfunded pension liabilities were 15 percent of total state income; in FY 2016 they were 24 percent of total state income. In our study we include the unfunded pension liabilities for the SERS, the PSERS, and the MERS plans by applying a risk-free discount rate to measure the value of pensions on a guaranteed-to-be-paid basis.
The overall picture that these metrics provide for Pennsylvania’s fiscal health points to a few areas of weakness: low levels of cash to meet short-term liabilities, revenues that only barely cover expenses, and increasing long-term liabilities relative to the income of state residents. Long-term liability growth is driven in part by states more fully recognizing unfunded pension and OPEB obligations in their financial reports. These metrics suggest areas for improvement and should be put in context of recent and ongoing reforms to Pennsylvania’s fiscal institutions and policies.
I will now provide three recommendations based on these metrics, additional research on the relevant fiscal policies and institutions, and recent reforms in Pennsylvania.

Recommendations
Cash Solvency and the Pennsylvania’s Commitment to Building and Improving Its Rainy Day Fund
Pennsylvania’s cash metrics underscore the risk that the state will be unable to weather a downturn or recession. The state’s Budget Stabilization Fund balance was depleted during the last recession, leaving Pennsylvania with only $231,000 in the fund as of FY 2015. According to Mercatus research by Erick Elder, Pennsylvania would need $1.3 billion to weather a moderate recession and $3.62 billion to weather a severe recession.
Fortunately, Governor Wolf and state legislators have committed to restoring the state’s Rainy Day Fund, contributing $22 million in 2018, and a further $317 million is to be contributed in FY 2019 for a total balance of $340 million. In a recent analysis, State Treasurer Joe Torsella notes that this amount covers only 3.5 days of General Fund spending. The current target for the fund is 6 percent of the general fund, with 25 percent of the budget surplus transferred to the Rainy Day Fund at the end of the year. Treasurer Torsella recommends two areas of improvement to Pennsylvania’s Rainy Day Fund rules that would increase both total balances and contribution discipline. The first is to consider conducting a revenue volatility analysis to determine how much money Pennsylvania would require to weather a recession and to establish a Rainy Day Fund target based on the analysis. The current threshold of 6 percent of general fund balances is somewhat arbitrary and is not based on the state’s experiences with recessions, presenting the risk that the state has too small of a cushion to get through an economic downturn. Secondly, the state should consider tightening deposit rules: instead of waiting until the end of the budget process to transfer excess funds to the Rainy Day Fund, automatically transfer those excess funds at the beginning of the process. These measures will help to put Pennsylvania’s Rainy Day Fund on much sounder footing.
Commit to Transparent Budgeting Practices
Since FY 2006 Pennsylvania’s operating budget has increased from $56 billion to $84 billion. Analysis by the Commonwealth Foundation shows that while the general fund grew by 65 percent between 2000 and 2018, “Other Funds” grew faster, by 237 percent. This jump in spending in Other Funds owes in part to the shifting of general fund spending into less visible categories and earmarks. In FY 2017 the general fund budget totaled $31.9 billion, or 63 percent of the total operating budget, and Other Funds totaled $18.8 billion, or 37 percent of the total operating budget. In a recent analysis conducted by the Independent Fiscal Office in FY 2018–FY 2019, 43 special funds totaled $9.5 billion.
In previous research I have labelled the habitual shifting of funds as a form of “fiscal evasion,” which I define as, “an accounting tactic, budgeting rule, or intergovernmental arrangement that conceals the full cost of public spending.” Such practices are not unique to Pennsylvania, but their proliferation or rapid increase in use may be a sign of weak spending discipline. The effect is to diminish budget transparency and to give both policymakers and the public a false sense of the true amount of spending, public policy priorities, and the taxes necessary to support those programs.
Continued Commitment to Managing Long-Term Liabilities and Pension Reform
In 2017 Pennsylvania undertook a significant pension reform. As of 2019, new employees may choose between a defined contribution plan or a hybrid defined benefit/defined contribution plan. The reform has the effect of stopping the growth of current liabilities while providing new hires with options for retirement. In addition, Pennsylvania lawmakers and the governor have indicated their committed to making the full required contribution to the pension plans, a necessary measure to ensure that funds are available to provide retirees with the benefits they have earned.
Recently, The Pennsylvania Public Pension Management and Asset Investment Review Commission provided an assessment of areas where savings might be achieved in the SERS and PSERS plans. Its recommendations include moving plan investments from actively managed funds to passively managed risk-adjusted index funds and consolidating the investment management of the two plans. The commission underscored the importance of making the full annual actuarially determined contribution, noting that failure to do so is a key driver in plan underfunding. The commission further endorsed mandatory stress testing and more transparency in pension reporting. These recommendations will help the state to anticipate and manage ongoing pension contributions.
A commitment to funding discipline is key. Pennsylvania has a long road ahead. Years of under contributions, poorer-than-expected investment returns, and the effect of flawed actuarial assumptions means that the annual contributions required to fund benefits will continue to grow over the decades, if expected investment returns are not met. Recent research by Greg Mennis, Susan Banta, and David Draine indicates that if investment returns are less than 5 percent annually, contributions would need to increase from 32 percent of payroll to 41 percent of payroll before dropping off in 2035. The study points to the need for regular stress testing of the pension system to prepare for the effects of economic shocks and how actuarial assumptions affect the measurement of plan liabilities and required contributions.
Conclusion
The fiscal condition of Pennsylvania is marked by ongoing challenges including weak cash reserves, spending growth, and large unfunded pension liabilities. Yet there is reason for optimism.
In recent years the legislature and executive have confronted massive and growing pension liabilities and cooperated to undertake pension reform that stops the growth of unfunded liabilities. Policymakers continue to seek additional reforms: requiring regular stress testing of the system, reducing investment fees, and committing to making the full annual contribution to the plans. These measures will help to ensure that the benefits are funded and available for retirees when they leave the workforce. Pennsylvania lawmakers have also committed to rebuilding the state’s Rainy Day Fund while improving the rules to ensure that sufficient funds are set aside to weather a recession and that deposits to the fund are automatic.
One area for improvement is in the current budgeting practices of the state. The growing tendency to shift spending from the general fund to special funds may obscure total spending and the amount of revenues needed to fund those activities and services. Budgeting should follow principles of simplicity and transparency. One reason many state pension plans have run into trouble is the systematic misvaluation of plan liabilities, a problem that became apparent during the last recession. The treasurer’s recommendation that revenue volatility analysis be employed to ensure a healthy Rainy Day Fund, as well as lawmakers’ and the governor’s interest in adopting regular pension stress testing, indicates that Pennsylvania’s policymakers are very much aware of the importance that clear financial and budgetary data and reporting play in ensuring the state’s fiscal sustainability.
Thank you, and I look forward to your questions.

