- | Working Papers Working Papers
- |
Can Freedom and Knowledge Economy Indexes Explain Go-Getter Migration Patterns?
What explains the migration decisions of young adults in the prime years of their working lives, people 25-39 years old, the builders of future economies, those people historian Daniel Boorstin (1974)
Introduction
What explains the migration decisions of young adults in the prime years of their working lives, people 25-39 years old, the builders of future economies, those people historian Daniel Boorstin (1974) called the Go-Getters? Are they driven to find emerging knowledge economies where returns to their investment in human capital may be highest? Or are they more oriented toward avoiding high taxes and onerous regulation and finding greater personal freedom? Do people migrating within the United States behave like foreigners migrating to the United States? Does protection of personal freedom matter? In short, what are the knowledge and freedom determinants of migration?
In this article we focus on one age group for domestic migration within and then foreign migration to the United States. [2]We use a knowledge economy index we developed (Watkins, 2008) and a freedom index developed at George Mason University’s Mercatus Center (Ruger and Sorens, 2009). The Mercatus freedom index has components that address economic freedom, personal freedom, and overall freedom. We include other variables to explain statistically migration patterns across the U.S. 50 states. Our project concentrates on the movements of people in the 25-39 age group. We see this prime work-age group as forming critical human capital bedrock for building future economic growth, and we borrow from Boorstin (1974) to call these individuals the Go-Getters. Within this age-group we compare the domestic and foreign migration patterns.
Our statistical results enable us to 1) determine how knowledge and freedom indexes perform as arguments in statistical models for explaining migration patterns, 2) compare the results for statistical models applied to foreign and domestic migration across the 50 states, which enables us to make inferences as to how the two index arguments may be important in determining the different migration patterns, and 3) to assess the relative importance of limited government as measured by personal freedom in determining migration decisions. At the outset, we advise the reader that there are striking differences between the apparent determinants of domestic and international migration for Go-Getters as revealed by the indexes we use in our analysis.
Our article is organized as follows: The next section provides a review of related literature and background on the indexes we will use. We pay special attention to the knowledge economy index and how it was constructed, since this is the first publication on the use of the index. We also provide detail on the Mercatus freedom index we selected for the project. This is followed by a section that presents our statistical models and results. The last section provides brief final comments.
Using Knowledge and Freedom Indexes to Explain Migration
In recent years much has been said about the rise of a new knowledge economy that may provide a strong engine for economic growth across the U.S. and the world (Atkinson and Correa, 2007, Carlino, 2001, Nakamura, 2000, The Best of All Worlds, 2006, The Information, Technology, and Innovation Foundation, 2008, World Bank, 2007). Along with analyses and forecasts have come a series of indicators for ranking cities and states, as well as countries, as to how they stand as evolving knowledge economies (Florida, 2002, Hill, 2009, Knowledge Based Economy Index, 2001, Koutout, 2009, Suete, 2005, Watkins, 2008). [3]Almost simultaneously, though having started earlier, the economic study of freedom and building of freedom indexes for cities, states and nations has become a burgeoning enterprise (Berggen, 2003, Gwartney, 2009, Gwartney and Lawson, 2009, Hanke and Walters, 1998, Holmes, Feulner and O’Grady, 2008, McQuillan, Daniels, Maloney, et al., 2008, Ruger and Surens, 2009). [4]
In work that blends freedom with knowledge indicators, Eastwood’s (2009) empirical research focuses on the relationship between economic freedom, Florida’s (2002) creativity index, a social capital index and employment and income growth across 242 U.S. cities and the 48 contiguous U.S. states. Eastwood finds that economic freedom and Florida’s indexes are strong predictors of economic growth; however, the social capital index does not perform as well. Examination of how people vote with their feet forms another category of research that indirectly speaks to economic growth and change. The work generally dates to Tiebout (1962). Ashby (2007) examined net migration among the 50 U.S. states, including both domestic and international migration components for the years 2001 through 2005 using a multivariable gravity flow model that included the Fraser Institute economic freedom index. Economic freedom was found to be a significant and positive determinant of migration when income and employment growth were not included in the model.
Volumes have been written on the determinants of migration patterns, but so far no one has used freedom and knowledge economy indicators as principal determinants of migration patterns across the U.S. states. [5]Nor has anyone assessed the role of personal freedom in determining those patterns. With a raft of information-packed freedom indexes and several emerging knowledge economy indexes available for panels of U.S. cities and states it is now possible to see how the paired indexes perform in explaining migration patterns across the 50 states.
Following Cebula and Alexander (2006) and others we assume that migrating individuals weigh the relative merits of alternate state locations and compare the expected outcomes against their current position. Migrating individuals seek to improve their wellbeing. This includes narrow economic benefits, such as income, as well as more nuanced benefits, such as access to the performing arts, vibrant cities and entertainment and cultural activities. Individuals also weigh living costs, taxes and the cost of making errors. Foreign migrants face legal constraints not faced by domestic movers. These can include visa requirements and other filters that limit movement. We argue that international migrants face a higher cost of error and are therefore likely to be more focused when making a migration decision; they also face a more severe knowledge problem and higher costs in gaining information. In general, we argue it is much easier for a domestic migrant to make a return to Atlanta if things in Dallas do not turn out well than for an international mover to Dallas to recover to Istanbul, Cairo or Monterrey. And since the foreign migrant’s “ticket price” for movement to a state is higher on average than that of a domestic mover, the foreign migrant is less sensitive to cost of living differences once in the domestic market. Those costs are a smaller share of the relative total cost of choosing one location versus another and can be offset by the relative gain in income and other benefits, which we argue are larger comparatively for foreign than domestic movers. Foreign movers also may face more restrictive cultural constraints than domestic movers. First, the foreign immigrant is more “on his own” than the domestic mover when arriving in a new location. Language and culture also force the immigrant to make his own way and to be less influenced in making a location decision by the presence of American music, food and local performing arts. In this sense, the foreign mover is more footloose.
We use primarily two indexes and other variables to explain migration patterns. The indexes are the Knowledge Economy Index (KEI), which we developed (Watkins, 2008) and the Mercatus Overall Freedom Index (OFI) and Mercatus Personal Freedom Index (PFI) (Ruger and Sorens, 2009). The KEI assesses the relative effectiveness of each state’s knowledge economy, the sector of the economy in which value lies increasingly in ideas, services, information, technological innovation and relationships. Included in the index are information on educational attainment, research and development and entrepreneurship. The OFI has two underlying components. These are economic freedom, which measures items such as government size and spending, regulation and tax burden, and personal freedom, which is based on state paternalism that restricts activities like alcohol consumption and Sunday retail sales. The personal freedom component forms the basis for the PFI we use at the end of our analysis. We explain each index in further detail before examining migration patterns with statistical models.
The KEI was developed as a low-cost vehicle to compare the performances of the states’ knowledge economies. By low-cost we mean that our model can be replicated with a small amount of information relative to other indexes that rely on a large number of variables and tables to calculate rankings. The KEI is based on three components of the knowledge economy: knowledge, innovation, and entrepreneurship. A robust knowledge base, generally measured quantitatively as educational attainment, leads to valuable innovation and invention. Furthermore, the bridge between innovation and commercialization must be traversed in order to deliver value to consumers, provide producers with revenue, and render innovation productive. This bridge is commonly referred to as entrepreneurship. Our selection of KEI components was based on regression analysis that used per capita income as the dependent variable. We assumed income improvement to be the implicit, if not explicit, goal of the knowledge economy. Median age was included as a highly significant control variable in order to account for differences in incomes resulting solely from age differences.
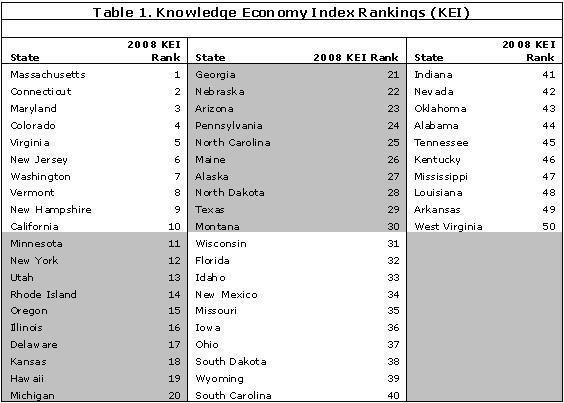
The first of three indicators selected was the weighted educational attainment of a state’s workforce. Education levels for the share below a bachelor’s degree are weighted less than those with bachelor’s degrees and even less than the share with advanced and professional degrees. The second component was dollar expenditures on industry research and development weighted by states’ total worker earnings. The entrepreneurial component was the relative number of fast-growth firms based on Inc. 500 and Deloitte Technology Fast 500 reports. [6]This indicator is a “marker species” of the knowledge economy that signals productive growth within the knowledge sector. These three drivers were selected through rigorous statistical testing of over twenty indicators, which survived the original pool of approximately 150 variables that were considered on a theoretical basis. The resulting 2008 KEI quintiles are mapped in Figure 1, and Table 1 gives the complete rankings.

The OFI measures freedom across the 50 states using variables in separate indexes for economic freedom and personal freedom. Ruger and Sorens broadly define their notion of freedom as follows: “We explicitly ground our conception of freedom on an individual rights framework. In our view, individuals should be allowed to dispose of their lives, liberties, and property as they see fit, so long as they do not infringe on the rights of others” (Ruger and Sorens, 2009, 5). In other words, their work is based on constitutional bedrock that celebrates classical liberal values.
The underlying study used 20 indicators grouped into three policy sectors: fiscal, regulatory, and paternalism. Example indicators for the three sectors are tax rates, state spending, land-use regulations, right-to-work laws, access to internet gambling, laws restricting the consumption of alcohol, campaign finance laws, rules requiring certain kinds of insurance and motorcycle helmet laws. Within each indicator, the authors developed weights and statistical treatments to arrive at a final score for the indicator. The authors tested the indicators statistically and weighted them finally on the basis of size of the population affected by them. They then developed three indexes, one for economic freedom, a second for personal freedom, which is based on the paternalism sector, and an overall freedom index, OFI. Rankings for the 2008 OFI are displayed in Table 2.

Mapping Index Rankings to the 50 States
A scatter plot of rankings for the KEI and OFI is shown in the accompanying chart, Figure 2, which is divided into four quadrants. The southwest quadrant is the most interesting of the four for economic development purposes. The states in this quadrant have the highest freedom and knowledge economy rankings. On the basis of the rankings, these states are predicted to rank higher in future economic growth. We call attention to the fact that Michigan, a state currently in deep industrial decline, is in the southwest quadrant. The northeastern quadrant contains states with weaker growth prospects. These are the states with low knowledge and freedom rankings.


Statistical Models
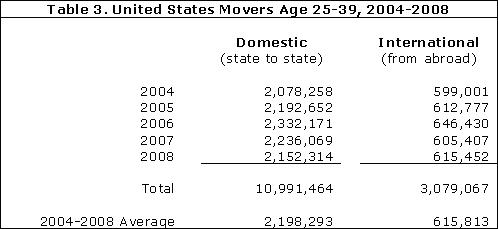
We used regression models to estimate the count of average domestic migration for people 25-39 years old and for migration of the same age group to the 50 states from foreign locations for the years 2004-2008. [7]We used data from the U.S. Census Bureau American Community Survey for the migration and population variables. The migration data are displayed in Table 3.
Many foreign movers, and a portion of the movers measured in this study, come into the U.S. under non-immigrant (i.e. temporary) visa programs, of which the most publicized and polarizing is the H-1B visa. The H-1B visa allows highly skilled internationals to work in science and technology sectors in the U.S. for up to six years. There is an annual cap on the number of laborers allowed to enter the U.S. under the program. The H-1B quota was 140,000 in the 1990s and increased to 195,000 for 2001-2003 (Matthews, 2008). The cap then fell to 65,000 in 2004 and remains at that level; this is more than 10 percent of the annual foreign migration that occurred in the years of our study. Notably, workers sponsored by or employed at academic institutions, non-profit research organizations or government research organizations do not count against the cap. [8]
Domestic labor interests seeking to protect American workers from additional competition and those concerned that the restrictions encourage highly skilled foreign workers to seek employment outside the U.S have widely and fiercely debated the H-1B program. There is the additional concern that the best and brightest international students will come to the U.S. to study at top research universities only to return home upon graduation, a so-called “reverse brain drain” (Wadhwa, 2009). Our analysis of international in-migration to the 50 states may reveal which states are most successful at stemming or countering this phenomenon.
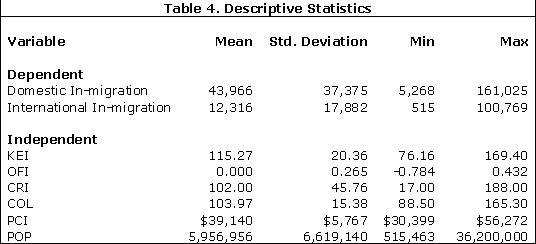
We turn now to discuss the independent variables used in our estimates. Our models included the KEI and OFI, with an updated version of Richard Florida’s State Creativity Index (CRI), per capita income (PCI), and a Council for Community and Economic Research cost of living index published in 2009 by the Missouri Economic Research and Information Center (2009) (COL), along with 2004-2008 average population (POP) (We note that we are not aware of a regularly published, publicly available state cost of living index). The per capita income data comes from the Bureau of Economic Analysis. The creativity index is based on data from four categories: Creative class concentration, high-tech industry concentration, patents per capita data and a diversity index based on the percentage of a population that is gay. Descriptive statistics for all variables are found in Table 4.
The general form of our regression model is written:
MIGRATION = f(KEI, OFI, CRI, COL, PCI , POP)
We expected the KEI and OFI to have a positive impact on migration for both domestic and foreign migrants. [9](We later substitute personal freedom, PFI, for OFI in the model. The forecasted effect is the same). We argue that both groups will be attracted to communities with higher educational attainment, more vibrant entrepreneurial economies and more freedom. We predicted that the CRI is positively associated with domestic migration but that foreign migrants are less sensitive to cultural elements of the CRI since these, we believe, are less relevant to them. We expected migration to be negatively associated with COL but that the association might be insignificant for foreign migrants because of the relatively small share of COL to the total “ticket price” and since higher income and other benefits relative to their point of origin could be offsetting. POP was included in the model to adjust for scale. We expected the coefficient to be positive. When evaluating coefficients, it should be noted that a higher index score for the KEI, OFI, and Creativity Indexes indicates a higher performance and index ranking; therefore, a positive sign in the regression models indicates a positive relationship between the indexes and migration.
Regression Results for Domestic Migration
The regression results for domestic in-migration are found in Table 5.
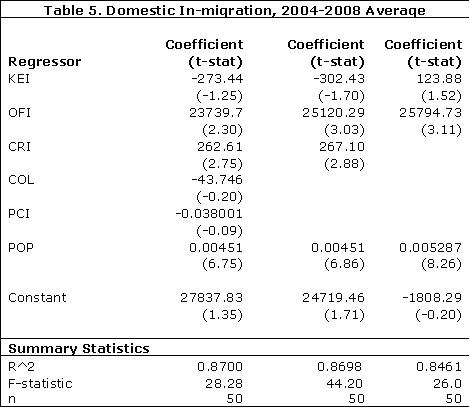
In each of the three estimates the model explains a large amount of the variance in Go-Getter migration. We now call attention to the data in the first column. The coefficient on KEI is not significant at conventional levels and is negative (a coefficient is significant when t-statistics show at least a 10% level of significance). CRI seems closely related to domestic in-migration; the coefficient is highly significant and positive. According to the coefficient on CRI a one-unit change leads to plus 262 migrants. A one-unit change in KEI is associated with a loss of 273 migrants. The two effects are offsetting. The coefficient on OFI is significant and positive, suggesting that higher freedom attracts more migrants. Neither COL nor PCI are significant. We infer that the effects of COL and PCI are captured in the three index variables. POP, as expected, is positive and significant in association with migration.
We delete the insignificant variables and report a second estimation in the second column of Table 5. Here we see significant coefficients on all variables. The coefficient on KEI is still negative and is smaller. A one-point OFI score improvement is estimated to increase domestic migration of Go-Getters by 25,120. Overall freedom seems clearly to be an important determinant of Go-Getter movement across states. Similarly, according to the model, a Creativity Index score increase of one point will attract 267 Go-Getters from other states, possibly reinforcing Richard Florida’s assertion that young people weigh factors like cultural environment and diversity rather highly (2002). The negative relationship between the KEI and domestic migration is interesting in that high KEI states with larger knowledge economy sectors are thought to be most attractive to young, highly educated workers. But some, such as California, New York and Massachusetts, are also generally losing population to newly emerging knowledge economy states. The model implies that, all else equal, an increase of one point on the KEI will result in 302 Go-Getters leaving a state. We note that KEI is negative and highly significant with CRI in the model. Population is again significant as a control variable.
Finally, we reduce the model to three foundation variables, the KEI, OFI and POP and report our results in the table’s third column. We see that KEI without CRI in the model is no longer significant. OFI and POP are highly significant and with the same signs and about the same size coefficients as in column 2.
Regression Results for International Migration
We now turn to examine the results for international migration. The dependent variable of this model is the number of international in-migration of 25-39 year olds, defined in the American Community Survey as those who moved to a given state from abroad. We note that results are strikingly different from the domestic migration estimate. The results for the international in-migration model are provided in Table 6.
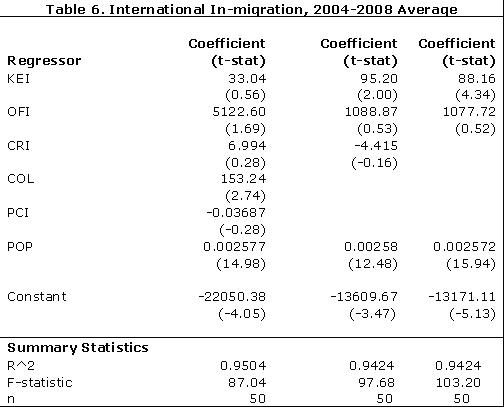
We note that the coefficient of determination indicates that the three models explain 94 percent or more of the variation in migration. The estimate for the full model reported in column one indicates that OFI, COL and POP are the three significant variables, the coefficient on OFI barely so, and their coefficients carry the expected signs. Recall that CRI was highly significant and positive in the domestic model. Apparently the cultural elements that move domestic migrants have no effect on their international counterparts. To make a head-to-head comparison, we report results for a reduced model in column two that is identical to the second domestic model reported in Table 5. Here we see that KEI is significant and with the predicted sign. Where OFI is the magnet for domestic migration, KEI is the main attractor for international movers. Creativity continues to be insignificant and POP continues be significant. When the coefficients on KEI, OFI and POP are compared for the domestic and international estimates, one finds the coefficients to be much smaller for the international movers. This is likely to be due to the fact that total number of people moving is much smaller for the international set.
Table 6’s column three shows the fundamental, three-variable model. Here we see the highly significant KEI coefficient with the expected sign. The results are dramatically different from the same model for domestic migration. Apparently, the variables contained in the KEI matter far more for international migrants than domestic movers. The overall ability of the reduced models to predict migration is about the same as the larger models. [10]
Probing deeper into what might explain the apparent differences in migration determinants for domestic versus foreign migration decisions, we replaced the Mercatus OFI with the Mercatus Personal Freedom Index (PFI) and re-estimated the three models. [11]The PFI accounts for roughly one-third of the OFI. The results for international migration were strikingly different from those for domestic movers, but in a different way. We report the final three variable estimates in Table 7.
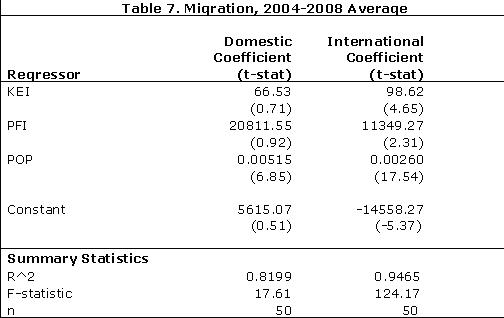
These results seem to explain another major difference in domestic versus international migration. The statistics in column one tell us that domestic movers assign little importance to cross-state differences in personal freedom restrictions. The data in column two tell us that international movers assign great importance to avoiding such restrictions; they opt for higher personal freedom. Once again, we see the strong KEI results. We note that the international estimate has very strong overall statistical characteristics. Apparently, the United States can still beckon as a land of opportunity for foreign immigrants, both in terms of the new knowledge economy and high personal freedom, at least as indicated by the indexes in our model.
Final Thoughts
Our research on the determinants of domestic and international migration for people 25-39 years old has focused on the use of two state indexes based on large amounts of information. We have described in detail the development of our knowledge economy index and reviewed the construction of the freedom indexes chosen for this project. We included these indexes in regression models that also contained variables for creativity, cost of living, income and population. The indexes claim to capture important information on the emerging knowledge economy and economic and personal freedom.
We find the focal point indexes behave in predictable ways for the international set; they respond positively to the knowledge index and to overall freedom. Domestic movers are unaffected by the knowledge index but are attracted to higher overall freedom. Unlike international movers, the domestic set seems to be strongly affected by the creativity index. We attribute this difference to dissimilar cultural preferences of the two groups. As we probed deeper into the determination of migration decisions, we focused on personal freedom, which is a component of the overall freedom index used in our main estimates. Here we found that international movers seem to be sensitive to personal freedom whereas domestic movers are not. Apparently domestic movers are sensitive to the other components of the overall freedom index: economic and regulatory freedom. Our work suggests that composite indexes can be useful in predicting migration patterns for work-age adults but that their strongest performance will be related to explaining international migration.
References
Ashby, N. J. 2007. Economic freedom and Migration Flows between U.S. States. Southern Economic Journal, 73: 677–697.
Atkinson, Robert D. and Daniel K. Correa. 2007. The 2007 State New Economy Index, (February 27). http://papers.ssrn.com/sol3/papers.cfm?abstract_id=965869. Visited January 15, 2010.
Berggren, Niclas. 2003. The benefits of economic freedom. The Independent Review, 8(Fall): 193-211.
The Best of All Worlds. 2006. Federal Reserve Bank of Dallas, Annual Report.
Boorstin, Daniel. 1974. The Americans: The Democratic Experience. New York: Random House Publishers.
Bureau of Labor Statistics, http://www.bls.gov/iag/profbusservices.htm/ accessed December 27, 2006.
Byars, John, Robert McCormick, and Bruce Yandle. 1999. Economic Freedom in America’s 50 States. Indianapolis, IN: State Policy Network.
Campbell, Noel D. and Tammy M. Rogers. 2004. Economic Freedom of the U.S. States and Net Business Formation. Paper presented at the Association of Private Enterprise Education 2004 meeting.
Carlino, Gerald A.2001. Knowledge Spillovers: Cities Roles in the New Economy. Federal Reserve Bank of Philsdelphia, Business Review (Q42001): 17-26.
Cebula, R.J. and Gigi M. Alexander. 2006. Determinants of Net Interstate Migration, 2000-2004. Regional Analysis & Policy 36(2): 116-123.
Cebula, R.J. and J.E. Payne. 2005. Net migration, economic opportunity and the quality of life, 1999-2000. International Review of Economics and Business 52(2): 245-254.
Clark, J.R., and Dwight R. Lee. 2006. Freedom, Entrepreneurship, and Economic Progress, Journal of Entrepreneurship, 15: 1-17.
Davies, P.S., M.J. Greenwood, M.J., and H. Li. 2001. Aconditional logit approach to U.S. state-to-state migration. Journal of Regional Science 41(2): 337-357.
Donegan, Mary, Joshua Drucker, Harvey Goldstein, et al. 2008. Which Indicators Explain Metropolitan Economic Performance Best? Traditional or Creative Class, Journal of the American Planning Association, 74, (March ): 180 - 195
Easton, Steven T., and Michael A. Walker (1997). Income, Growth, and Economic Freedom. American Economic Review 87 (May): 328-32.
Eastwood, Brent M. 2009. Creative Class vs. Social Capital vs. Economic Freedom: U.S. Economic Growth, Applied Research in Economic Development, 6: 14-24.
Florida, Richard. 2002. The Rise of the Creative Class. New York: Basic Books.
Gwartney, James. 2009.. Institutions, Economic Freedom, and Cross-Country Differences in Performance. Southern Economic Journal 75, 4 (April): 937-956.
Gwartney, James and Robert Lawson. 2009. Economic Freedom of the World. Vancouver, BC: Fraser Institute.
Hanke, Steve H., and Stephen J.K. Walters (1997). Economic Freedom, Prosperity, and Equality: A Survey. Cato Journal 17 (2) (Fall): 117-46.
Heckelman, Jac C. and Michael D. Stroup. 2000. Which economic freedoms contribute to growth? Kyklos, 53:4, 527-545.
Hill, Jeremy. 2009. Applied Research in Economic Development. Volume 6, Number 1, 3-13
Holmes, Kim R., Edwin J. Feulner and Mary A. O’Grady. 2008. “2008 Index of Economic Freedom: The Link Between Economic Opportunity and Prosperity.” The Heritage Foundation. Washington. <http://www.heritage.org/Index/>. Accessed 15 Apr 2008.
The Information, Technology and Innovation Foundation. 2008. 2008 State New Economy Index Kansas City, MO: Kauffman Foundation.
Knowledge Based Economy Index. 2001. Research. Milliken Institute (November 6). http//www.milkeninstitute.org/research.taf?cat=index&function=detail&ID=19&ty…;. Visited October 18, 2007.
Koutout, Kristine, 2009. Building a Knowledge Economy Index for Metropolitan Areas. M.A. Thesis. Department of Economics, Clemson University, Clemson, SC.
Kreft, Steven F. and Russell S. Sobel. 2005. Public policy, Entrepreneurship, and Economic Freedom, Cato Journal, 25:3, 595-616.
Matthews, Christine M. 2008. Congressional Research Service Report for Congress 97-746 “Foreign Science and Engineering Presence in U.S. Institutions and the Labor Force.”
McQuillan, Lawrence J., Eric Daniels, Michael T. Maloney, and Brent M. Eastwood. 2008. U.S. Economic Freedom Index: 2008 Report. San Francisco: Pacific Research Institute.
Missouri Economic Research and Information Center. 2009. Cost of Living Data Series, Third Quarter 2009. http://www.missourieconomy.org/indicators/cost_of_living/index.stm . Visited January 13, 2009.
Nakamura, Leonard I. 2000. Economics and the New Economy: The Invisible Hand MeetsCreative Destruction, Federal Reserve Bank of Philadelphia Business Review (July/August): 15-30.
Ruger, William P. and Jason Sorens. 2009. Freedom in the 50 States. Fairfax, VA: Mercatus Center at George Mason University (February).
Suete, Luc. 2005. A Knowledge Economy Paradigm and its Consequences, A paper presented to Policy-Network of the EU, United Nations University, UNU Merit (November 26).
Tiebout, Charles M. 1956. "A Pure Theory of Local Public Expenditures," Journal of Political Economy, 64: 416-24.
Wadhwa, Vivek. 2009. Business Week. “Why Skilled Immigrants Are Leaving the U.S.: New research shows that highly skilled workers are returning home for brighter career prospects and a better quality of life.” http://www.businessweek.com/technology/content/feb2009/tc20090228_990934.htm Accessed December 21, 2009.
Watkins, Tate. 2008. Building a Knowledge Economy Index for Fifty States with a Focus on South Carolina. M.A. Thesis, Department of Economics, Clemson University, Clemson, SC.
World Bank. 2007. Building Knowledge Economies: Advanced Strategies for Development, Washington: The World Bank.
[1]The authors are, respectively, former Clemson University graduate student and Professor of Economics Emeritus, Clemson University, Distinguished Adjunct Professor of Economics, Mercatus Center at George Mason University. We express appreciation to Vien Nguyen who led the way on this project and to Craig Lundgren and Roger E. Meiners for helpful comments and criticisms.
[2]The definition of foreign migrant used by the U.S. Bureau of Census in the American Community Survey, which relates to the data we use, is as follows: Anyone who was not a U.S. citizen or U.S. national at birth. This includes those who have become U.S. citizens through naturalization and those who are not U.S. citizens. The American Community Survey questionnaires do not ask about immigrant status. People who are not U.S. citizens may be legal permanent residents (immigrants), temporary migrants (e.g., foreign students), humanitarian migrants (e.g., refugees), and unauthorized migrants (people present in the United States without legal documentation). (U.S. Bureau of Census, http://www.census.gov/prod/2009pubs/acs-10.pdf. Visited January 15, 2010.)
[3]Jeremy Hill (2009) surveys and evaluates various knowledge economy indicators.
[4]Hill has surveyed and evaluated various economic freedom indicators, and there is now empirical work that shows a significant positive relationship between economic freedom and entrepreneurial and other kinds of economic activity across regions (Ashby, 2007, Campbell and Rogers, 2004, Clark and Lee, 2006, Heckleman and Stroup, 2000, Kreft and Sobel, 2005). There is also published research that uses knowledge economy variables, such as Richard Florida’s (2002) creativity index, in explaining economic growth and change (Donegan, Drucker, Goldstein, et al., 2008). That research indicates the relative superiority of traditional economic variables over the new economy indicators for explaining regional growth.
[5]We provide a small sample of recent migration studies that relate broadly to our project. These are Cebula and Alexander (2006), Cebula and Payne (2005), and Davies, Greenwood and Li (2001). There are no published studies to our knowledge that focus on knowledge economy and freedom determinants of migration patterns.
[6]Inc. 500: http://www.inc.com/inc5000/2009/index.html, Deloitte Technology Fast 500: http://www.deloitte.com/view/en_US/us/Industries/Technology/technologyfast500/index.htm
[7]We recognize that the years chosen for analysis contain a severe economic recession. To test for the reliability of final estimated models, we performed separate one-year estimates for migration for each of the years. The results were basically the same as for the average migration across the years.
[8]United States Citizenship and Immigration Services. http://www.uscis.gov/portal/site/uscis/menuitem.eb1d4c2a3e5b9ac89243c6a7543f6d1a/?vgnextoid=73566811264a3210VgnVCM100000b92ca60aRCRD&vgnextchannel=73566811264a3210VgnVCM100000b92ca60aRCRD. Accessed January 23, 2010.
[9]We recognize that KEI was built using regression analysis with per capita income as the dependent variable for the purpose of producing weights to be assigned to the variables included in KEI. We note that all of the regression coefficients were not used in the KEI, but that there is still some collinearity between KEI and per capita income. We will let the data speak for themselves in the next section.
[10]In our diagnostic work, we examined residuals for the final three-variable model, which is written: MIGRATION = f(KEI, OFI, POP). California is an outlier by more than two standard deviations for both the domestic and international models but with differing signs, negative for the domestic model, which means the model over-predicts, and positive for the international one, which indicates the model under-predicts. This reinforces what we believe is true about recent net migration trends for the state – domestic residents are fleeing due to the high cost of living and tax burden, while internationals are flocking to the state because of the growth of its valuable high-tech sectors. North Carolina and Florida are positive outliers in the domestic model; the model under-predicts migration to those two states. Additionally, the residuals’ data point to the insulation of the Midwest from foreign immigration as Ohio, Pennsylvania, and Michigan appear as negative outliers in the international model. The region's economy is struggling to survive as declining old-line industries, high taxes and low economic freedom continue to drive away human capital, and assets continue to depreciate. In additional tests, we made a complete set of estimates using the Pacific Research Institute’s state economic freedom index in place of the Mercatus OFI. The results were much the same for the domestic models, but the alternate economic freedom index was significant in the international mover estimates. The outlier states for this estimate were about the same as those discussed above.
[11]We also made an estimate using the Mercatus Economic Freedom Index in place of the OFI. The results for the three variable model for international movers found the KEI to be highly significant and the EFI not significant, which was the same as in the OFI model. The results for domestic movers indicated the EFI as significant and the KEI as insignificant, which also was the same as the OFI models. These estimates will be provided to readers upon request of the authors.

