- | Regulation Regulation
- | Working Papers Working Papers
- |
RegData
A Numerical Database on Industry-specific Regulations for All U.S. Industries and Federal Regulations, 1997-2012
RegData is a new database that quantifies federal regulation. It analyzes the text of federal regulations to create novel and objective measures of the accumulation of regulations in the economy overall and across different industries in the United States. In addition, RegData measures the degree to which different groups of regulations, such as those from a particular agency, target specific industries.
RegData is a new database that quantifies federal regulation. It analyzes the text of federal regulations to create novel and objective measures of the accumulation of regulations in the economy overall and across different industries in the United States. In addition, RegData measures the degree to which different groups of regulations, such as those from a particular agency, target specific industries.
For a more detailed explanation of RegData and its methodology, see “RegData: A Numerical Database on Industry-Specific Regulations for All US Industries and Federal Regulations, 1997–2012” by Omar Al-Ubaydli and Patrick A. McLaughlin.
WHY QUANTIFY REGULATION?
In Moneyball, Oakland A’s general manager, Billy Beane, used an improved set of analytical metrics to create a better baseball team. He was able to do so only because Bill James and other pioneers of baseball statistics had created new gauges of player performance, such as the on-base plus slugging statistic, that improved on the traditional measures, such as batting average and subjective assessments by old-school scouts.
Regulations are similar to baseball players in the sense that some fail while others succeed. However, while baseball generates a profusion of statistics, there are not many objective measures of regulations. RegData represents the first step toward a Moneyball approach to studying regulation: if researchers can objectively measure regulations, policymakers can use this information to help determine whether regulations efficiently achieve their intended goals.
QUANTIFYING REGULATIONS WITH TEXT ANALYSIS
Previous efforts to assess the extent of regulation in the United States have used proxy variables designed to measure the quantity of federal regulation. For example, several studies count the number of pages published in the Federal Register, while others count the number of new rules promulgated annually. RegData improves on these studies in two principal ways:
- It provides novel metrics of regulation that are based on the actual content of the Code of Federal Regulations (CFR).
- It assesses the applicability of regulatory text to each industry. It uses the same industry classes as the North American Industrial Classification System (NAICS), which categorizes and describes each industry in the US economy.
The resulting database—RegData—is the first industry-specific quantification of federal regulation, permitting within-industry and between-industry analyses of the causes and effects of federal regulations.
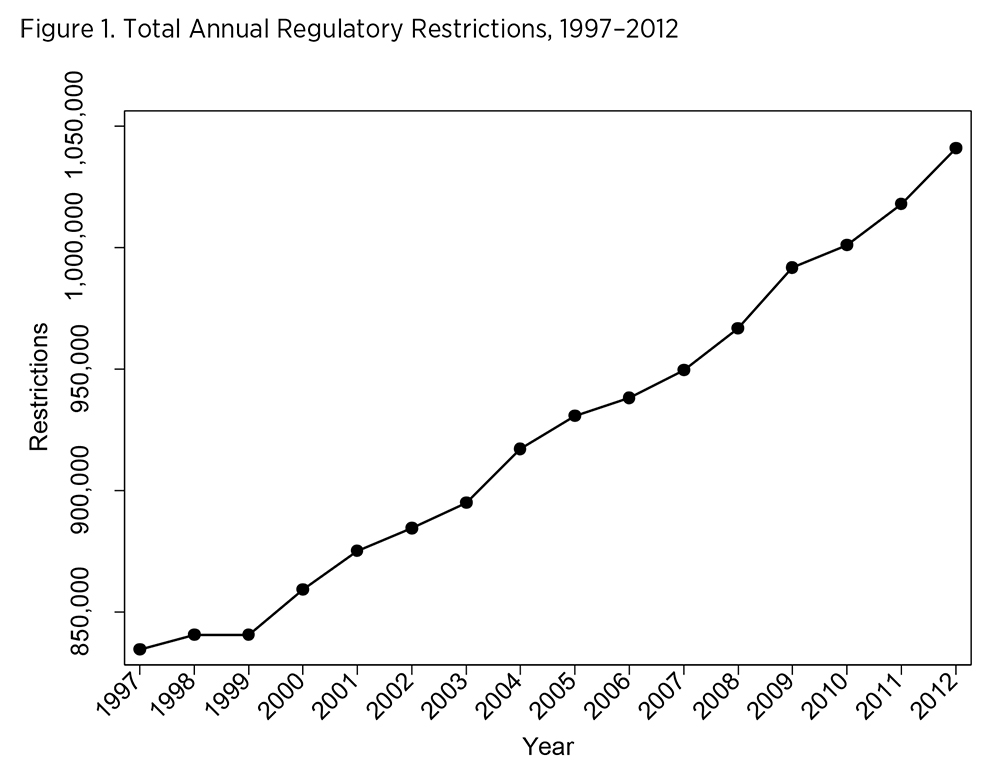
Not all regulations are equal in their effect on the economy. Similarly, one page of regulatory text is often quite different from another page in content and consequence. For these reasons, RegData relies on the content of the regulatory text itself as a data source. RegData parses the CFR to count the number of restrictions—binding constraints marked by words that create an obligation to comply, such as “shall” or “must”—published annually from 1997 to 2012. This is important because the actual code of requirements of some regulations is hundreds of pages long, while other regulations have only a few paragraphs of requirements. Figure 1 shows that the total number of restrictions in the entire CFR rose from about 835,000 in 1997 to over 1 million in 2012.
QUANTIFYING BY REGULATOR
The newly released RegData 2.0 permits users to view multiple metrics of regulatory text according to the regulatory unit (e.g., a regulatory agency, commission, or administration) that created the text.
- While the previous version of RegData relied on CFR titles to permit the examination of regulatory trends across broad subject areas, RegData 2.0 instead collects all text attributable to each regulator, regardless of which CFR title the text is in, and creates statistics based on regulator-specific text.
- By relying on the content of the regulatory text as a data source, RegData can separately parse each regulator’s text and see how the growth of regulatory text differs across regulators. One way to do this is to look at restrictions by agency.
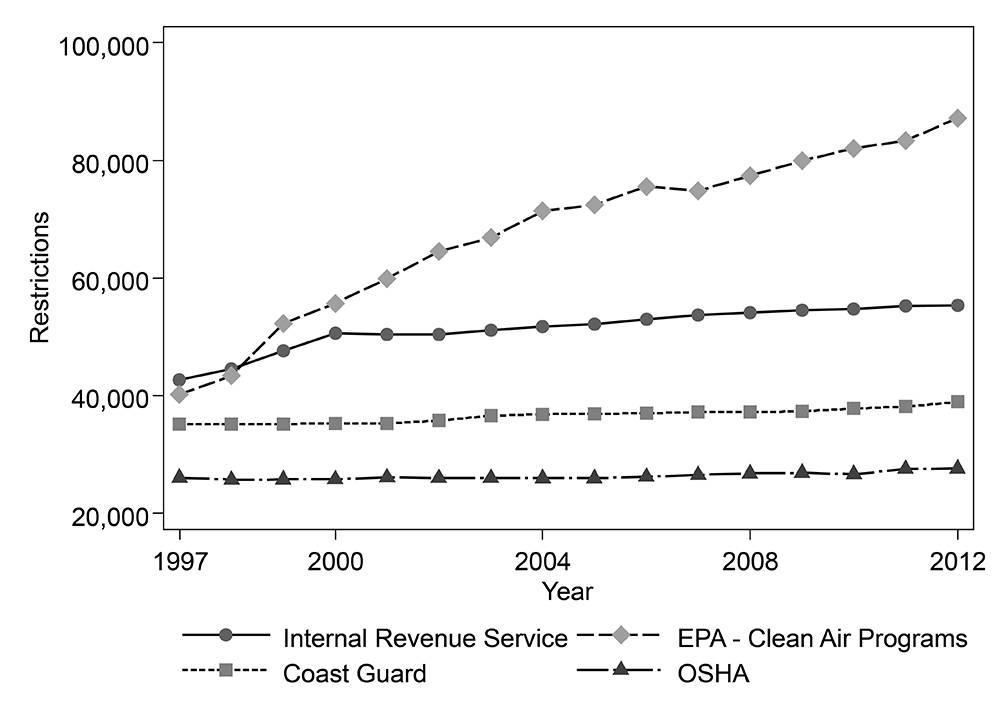
Figure 2 shows the annual count of restrictions for four of the most restrictive regulators that publish in the CFR. It shows that there can be substantial variation from regulator to regulator in how restrictions accumulate over time. While all these regulators exhibit growth of restrictions, the IRS has a faster growth rate than the others. The EPA’s Clean Air Programs grew relatively more quickly in the late 1990s than at any other time. While these graphs are fairly typical for large regulators, not all regulators exhibit growth in restriction counts over this time period. Similar graphs can be produced for hundreds of regulators using RegData.
QUANTIFYING BY INDUSTRY
Another advantage of using text as data is the ability to flexibly assess which industries are targeted by regulations produced by each of the regulators. Typically, NAICS industry descriptions are simple and obvious, such as “chemical manufacturing” or “crop production.” Based on each NAICS industry description, RegData uses various strings (combinations of words) that describe the industry and can be used to gauge how a particular regulator’s text relates to the industry. For example, “crop producers” is one of several strings describing the “crop production” industry.
To measure how each regulator’s text relates to specific industries, RegData compares the number of times these strings—labeled search terms—occur in each regulator’s text. The resulting dataset gives industry-specific measures of targeting—that is, measures of how frequently the regulations produced by a specific regulator or set of regulators target a specific industry. By this measure, for example, the regulators that most frequently mentioned search terms related to the “oil and gas extraction” industry in the year 2012 are (in order of ranking) “EPA—Air Programs,” “Coast Guard (Department of Homeland Security),” “Department of Energy,” and “Internal Revenue Service (Department of the Treasury).”
In addition to search term counts, RegData offers another, similar metric of the relevance of text to industries, called industry relevance. The industry relevance series normalizes the industry search term counts by the number of words produced by a regulator. In other words, industry relevance is the search term count divided by the word count for each regulator’s text.
Normalizing by word count allows smaller regulators—regulators that may not have large volumes of text—to still be considered when examining which regulators are relevant to an industry. The regulator that ranks highest in terms of search term counts may not rank highest in terms of industry relevance. Thus, in contrast to the regulators listed with the highest search term counts for the “oil and gas extraction” industry, the regulators with the highest industry relevance for that industry in the year 2012 are (in order of ranking) “Bureau of Land Management (Department of the Interior),” “Office of the Secretary (Department of the Interior),” “Bureau of Ocean Energy Management (Department of the Interior),” “Foreign Agricultural Service (Department of Agriculture),” and “EPA—Energy Policy.”
By using these measures of the industry targeting and relevance of each regulator’s text along with the number of restrictions in each regulator’s text, RegData is able to measure how regulated an industry was in in each year from 1997 to 2012.
There are several potential uses of a measure of how heavily regulated specific industries are. Both the causes and the consequences of regulation are likely to differ from one industry to the next, and by quantifying regulations for all industries, scholars can test whether industry characteristics, such as dynamism, unionization, or a penchant for lobbying, are correlated with industry-specific regulation levels or growth rates. The variety of industry-specific regulatory outcomes offered by RegData permits researchers to compare effects across industries with greater statistical certainty. For example, if researchers want to know whether high unionization rates are correlated with heavy regulation, they can compare RegData’s measure of industry-specific regulation for highly unionized industries to the measure for industries with little to no unionization.
COMBINING REGDATA WITH OTHER DATABASES
RegData’s design allows users to easily combine regulatory data with many other datasets measuring possible causes and consequences of regulation. For example, the Bureau of Economic Analysis (BEA) produces data measuring annual GDP by industry, as well as several other measures of industry performance. Many BEA datasets on industry performance use the NAICS method to define industries, so it would be a simple matter to combine the two for statistical analysis. Thus, by combining data from RegData with GDP-by-industry data, one could test whether increases in regulation are correlated with decreases in overall industry output. Similarly, a researcher could use RegData together with the BEA’s employment data by industry to see whether regulation correlates to changes in the number of jobs.
Additional details
Get the latest on RegData at quantgov.org.

