- | Monetary Policy Monetary Policy
- | Working Papers Working Papers
- |
Survey Measures of the Natural Rate of Interest
Offering policymakers new tools to determine the current stance of monetary policy
Abstract This paper proposes additional atheoretical model-free estimates of the natural rate of interest, or r-star, using survey-based measures of market participants, which were introduced by several central bank surveys conducted over the past decade in the United States, the United Kingdom, the Eurozone, and Canada. The paper compares these alternative estimates of r-star to more traditional structural estimates, such as those of Holston, Laubach, and Williams (2017). While all measures of r-star, including traditional structural measures, have declined over time before the COVID-19 pandemic, there has been substantial divergence in r-star estimates during the early 2020s. Specifically, survey-based estimates of r-star have risen, while some structural estimates have fallen during this period of resurgent inflation. In addition, these survey measures of market participants’ r-star expectations in the US closely follow the Federal Open Market Committee (FOMC) Summary of Economic Projections (SEP) median longer-run Fed funds rate forecast.
Measuring the natural rate of interest—also referred to as r-star or r*—is an essential tool for policymakers in determining the current stance of monetary policy. It is often considered a long-run equilibrium interest rate and the short-term interest rate achieved by an economy when inflation is stable.
Swedish economist Knut Wicksell famously coined the concept of the “natural rate of interest.” In his 1898 magnum opus Interest and Prices, Wickell says, “It is not a high or low rate of interest in the absolute sense which must be regarded as influencing the demand for raw materials, labour, and land or other productive resources, and so indirectly as determining the movement of prices. The causative factor is the current rate of interest on loans as compared to what I shall be calling the natural rate of interest on capital.”
However, measuring natural rates (also often referred to as the “neutral rate” or “equilibrium rate”) is a very challenging task. Many economists and policymakers believed the natural rate was low in the decade before the pandemic. Recent evidence suggests that it has moved higher since the COVID-19 pandemic. Nevertheless, it has taken time for this emerging consensus to develop, and delays can be costly. More accurate measures of r-star would reduce the likelihood of the Federal Reserve making a policy error. The intercept in monetary policy rules such as Taylor’s (1993) represents a nominal version of the natural rate of interest. An incorrect estimate of r-star can lead to substantial deviations in policy recommendations.
This paper provides an alternative model-free measure of the natural rate of interest based on survey expectations, which may help policymakers avoid misjudging the stance of monetary policy.
Historically, neutral rates have been measured using various structural models (Laubach and Williams 2003; Holston et al. 2017). Natural rates are often computed using dynamic stochastic general equilibrium (DSGE) models (Edge et al. 2008; Barsky et al. 2014; Curdia et al. 2015; Del Negro et al. 2017; Roberts 2018). However, such structural approaches, including those of Laubach and Williams (2003), Lubik and Matthes (2015), and Holston, Laubach, and Williams (2017), are highly susceptible to model misspecification. Standard errors for model-estimated r-stars can often be substantial, in the magnitude of several percentage points. Typically, such structural estimates show that the neutral rate has been falling for many decades (Rachel and Smith 2017; Rachel and Summers 2019).
Recent papers have explored r-star from different perspectives, including its fiscal consequences, with some economists arguing for a separate “fiscal r-star” measure (Campos et al. 2024; Bolhuis et al. 2024) and others examining the financial stability consequences for r-star (Akinci et al. 2023). Other papers have introduced new real-estate-based measures of the natural rate of interest, using foothold versus leasehold values (see Giglio, Maggiori, and Stroebel [2015] and Bäcker-Peral, Hazell, and Mian [2023] for analyses of values in the United Kingdon [UK] and Singapore) and historical long-term bond yields (Rogoff et al. 2024).
One challenge with using long-term bond yields or other long-run interest rates as indicators is that they contain a risk premium and an uncertain term premium, both of which can be difficult to measure. A similar issue exists with using inflation-linked securities (such as Treasury Inflation Protected Securities in the US) as unbiased forecasts of inflation. Economists such as Dhawan, Seidner, and Clarida (2024) have attempted to use central bank surveys to measure term premiums as well.
This paper compares alternative survey estimates of r-star to the more traditional structural estimates, specifically those of Holston, Laubach, and Williams (2017). While both alternative survey estimates and traditional structural estimates of r-star declined over time prior to the COVID-19 pandemic, there has been substantial divergence in estimates during the early 2020s. Specifically, survey-based estimates of r-star have risen while structural estimates of r-star have fallen during this period of resurgent inflation.
There is evidence that survey-based r-star measures are catching on. Some monetary policymakers have recently stated that they consider both survey-based and model-based r-star measures.[1] Ultimately, structural estimates of r-starcould inform survey respondents regarding which models and assumptions they prefer.
The paper is structured as follows: Section 2 describes and presents the survey data. Section 3 examines survey estimate uncertainty. Section 4 discusses the implications for Taylor rules. Section 5 provides concluding remarks.
1. Survey Expectations About the Neutral Rate and Short-Term Policy Rates in the Long Run
If agents believe that business cycles will smooth out in the long run, one can credibly infer that their long-run estimate of the policy rate will equal their long-run estimate of the natural rate of interest.
To obtain a real natural rate, one can take a long-run forecast of the policy rate and subtract the long-run inflation forecast (or, more simply, the central bank inflation target of 2 percent).
We obtain long-run forecasts from several central bank surveys:
- The Federal Reserve Bank of New York (New York Fed) Primary Dealers Survey. This survey began asking about long-run expected policy rates in 2012. It was later expanded to include the New York Fed’s Survey of Market Participants. In 2025, these two New York Fed surveys merged to form the Survey of Market Expectations.
- The European Central Bank (ECB) Survey of Monetary Analysts (SMA) (which began asking about long-run expected policy rates in 2021).
- The Bank of England Market Participants Survey (which began in 2022).
- The Bank of Canada’s Market Participants Survey (which began in 2023).
The details of these surveys are summarized in table 1. These surveys ask market participants questions about traditional macroeconomic aggregate forecasts as well as more detailed forecasts regarding market expectations of different aspects of monetary policy, including balance sheet size and expectations about the neutral rate or the policy rate in the “long-run.” The latter are of chief interest to this study.
Previously, forecasting surveys only asked for estimates several years into the future. One example is the long-running, US-based Survey of Professional Forecasters, which began in 1968 and was initially conducted by the American Statistical Association (ASA) and the National Bureau of Economic Research (NBER). It was taken over by the Federal Reserve Bank of Philadelphia in 1990 and asked questions about interest-rate forecasts, such as the three-month Treasury bill (as well as the consumer price index [CPI]), but only up to four years into the future. Questions about the “long run” have been noticeably absent until the past decade.
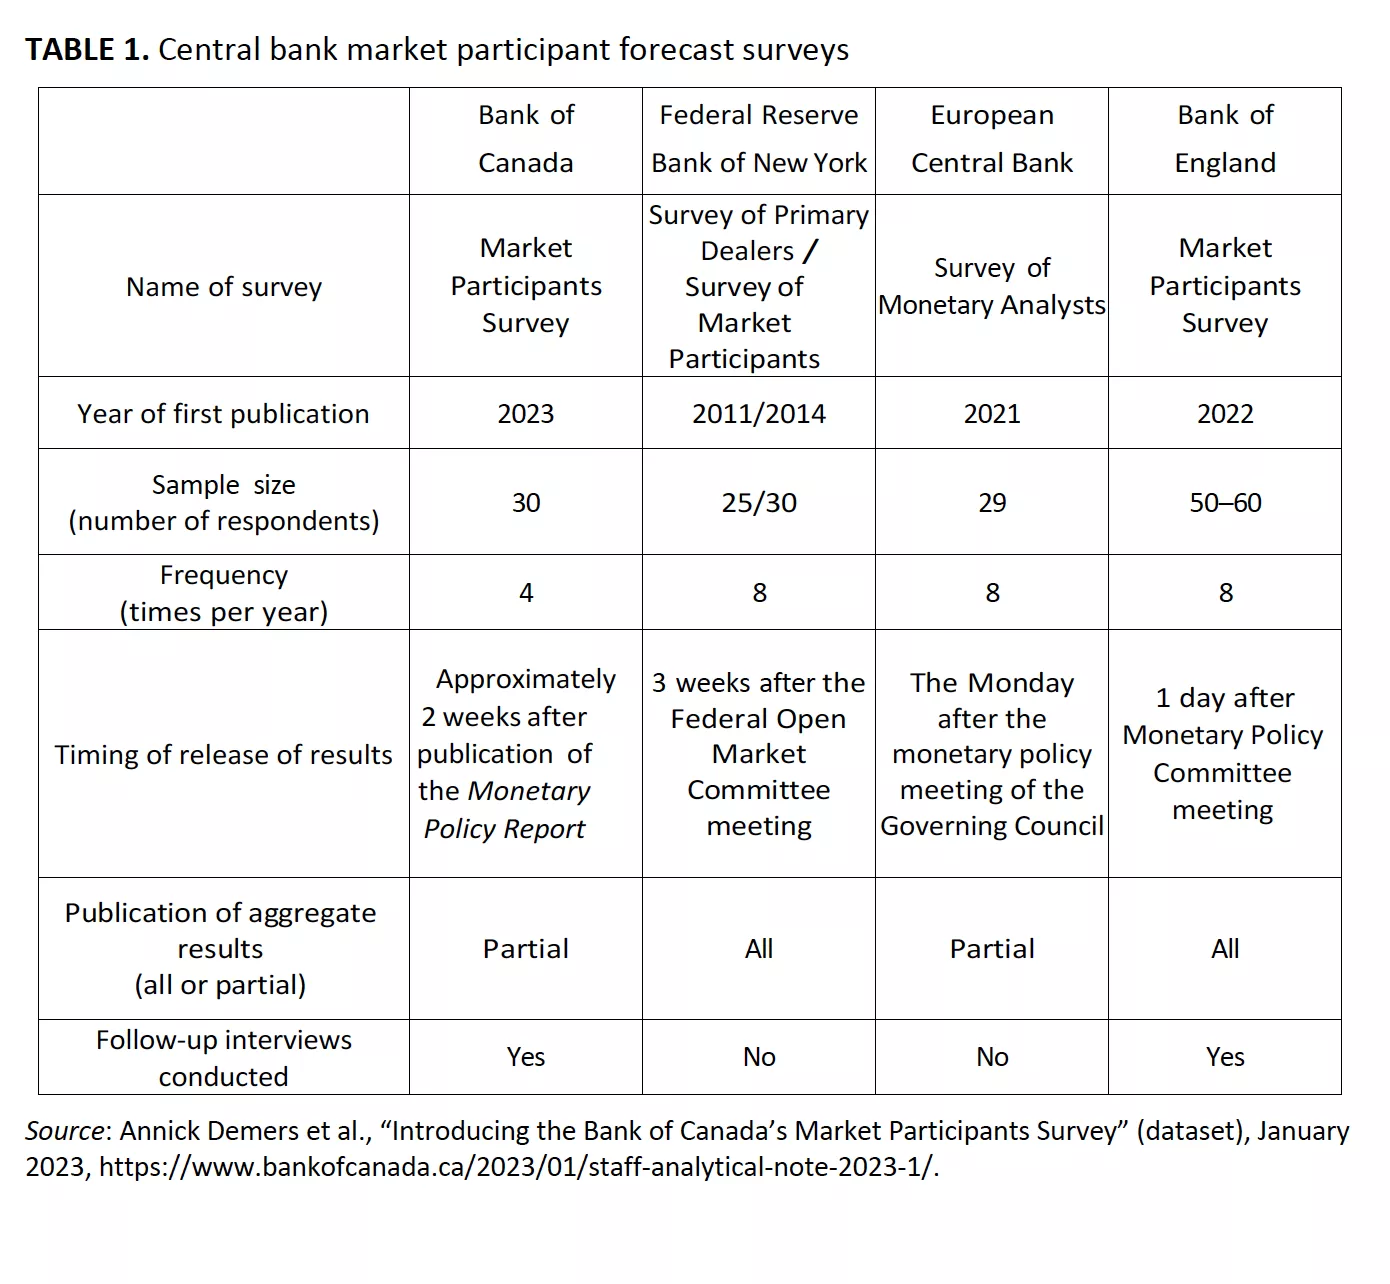
1.1 The US survey
The NY Fed Primary Dealers Survey asks the question:
In addition, provide your estimate of the longer run target federal funds rate and your expectation for the average federal funds rate over the next 10 years. Please provide your responses out to at least one decimal place (e.g. for one percent enter 1.0, not 0.01).[2]
Figure 1 plots the NY Fed Primary Dealer survey median “longer run” federal funds rate expectation versus the effective federal funds rate. In general, the NY Fed Primary Dealer Survey r-star estimates fell during the 2010s, consistent with the broader view that r-star has declined over many decades.
According to estimates from the NY Fed Primary Dealer Survey, the effective federal funds policy rate was above r-star by approximately 2.5 percent at the peak of the 2021–2023 tightening cycle. This contrasts sharply with the Holston-Laubach-Williams r-star estimate, which suggests the policy rate was above r-star by more than 4 percent during this period.
There has been substantial debate whether r-star has risen or fallen in the wake of COVID-19. Interestingly, there is significant divergence between the market participant survey forecasts, which generally suggest that r-star has risen since COVID-19, and the Holston-Laubach-Williams r-star estimates, which indicate a decline.
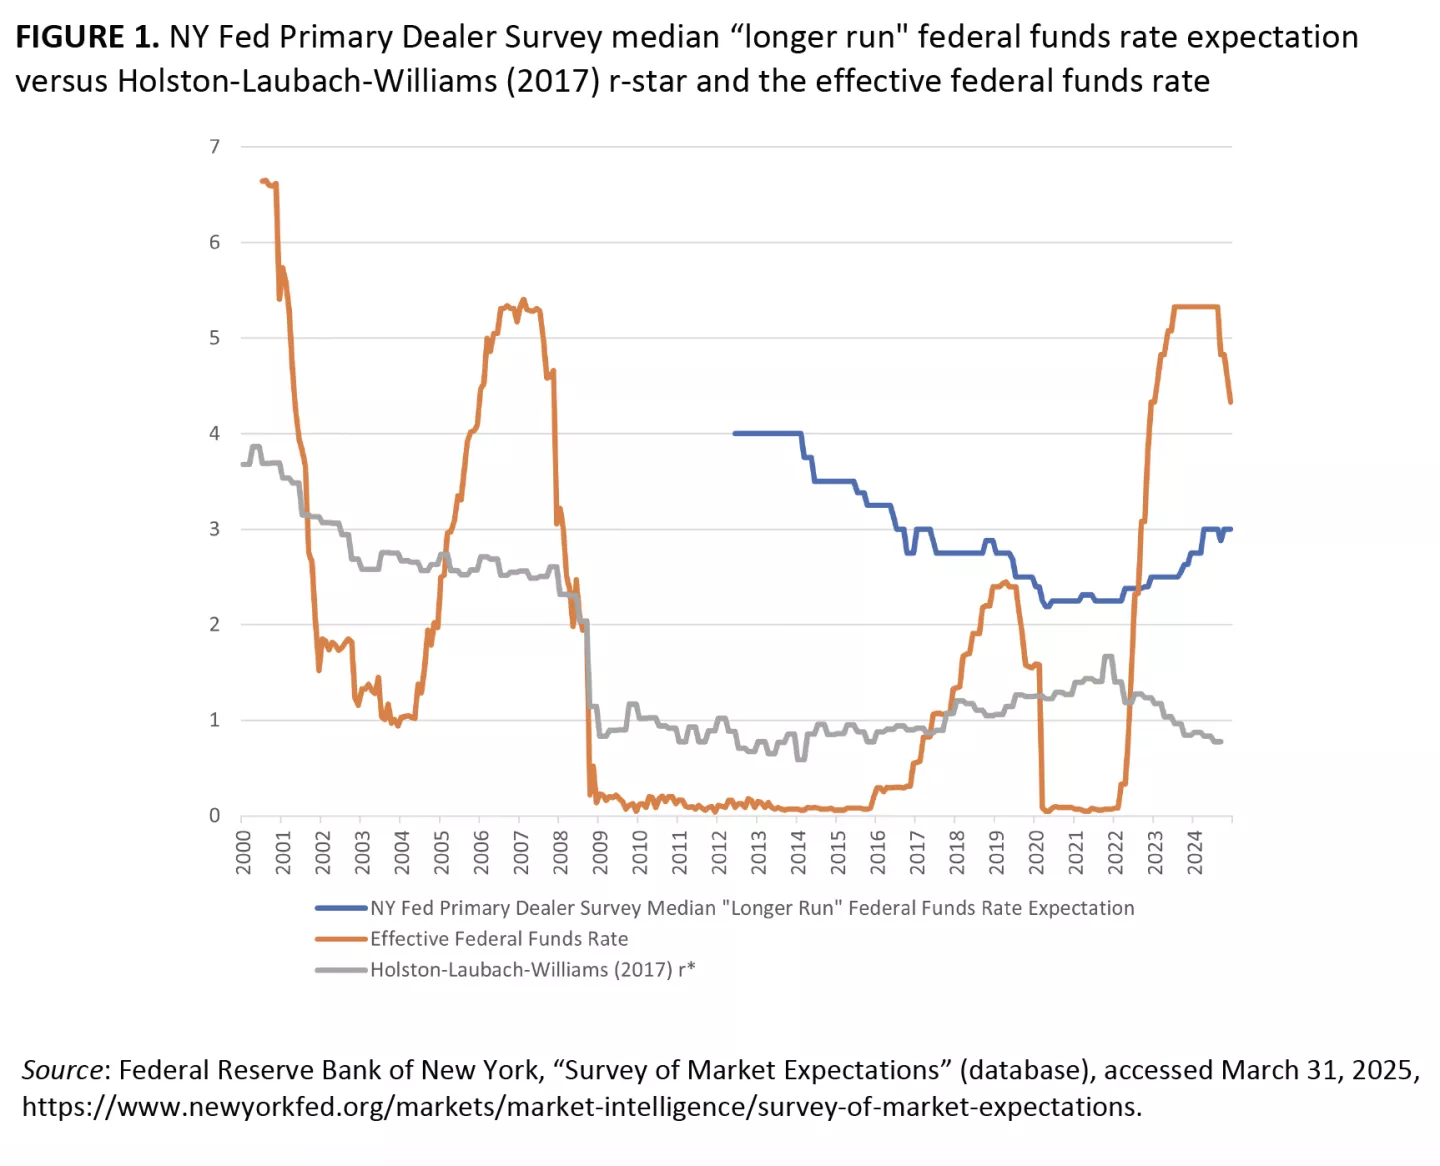
1.2 The Eurozone survey
Similarly, the ECB Survey of Monetary Analysts asks:
Please indicate the level (in percentage per annum) of the following interest rates that you consider most likely (i.e. the mode) to prevail over the reserve maintenance period after the Governing Council meetings listed below. Also, please indicate the level that you consider most likely (i.e. the mode) to prevail at the end of each of the quarters and years listed below, and in the long run.
Figure 2 plots the ECB Survey of Monetary Analysts median “longer run” deposit facility rate expectation versus the Holston-Laubach-Williams r-star and the ECB deposit facility rate. Note that from 2021 to 2024, the survey median estimate rose from 1.0 percent to 2.0 percent.
Similar to the US comparison, there is also a divergence between market participant survey forecasts, which generally suggest that r-star has risen since COVID-19, and the Holston-Laubach-Williams r-star estimates, which have fallen significantly.
According to the ECB survey r-star median estimates, the ECB policy rate, which peaked at 4.0 percent, was above r-star by about 2.0 percent at the height of the early 2020s tightening cycle. This contrasts sharply with the Holston-Laubach-Williams r-star estimate, which suggests the policy rate was above r-star by more than 5.0 percent during this period.
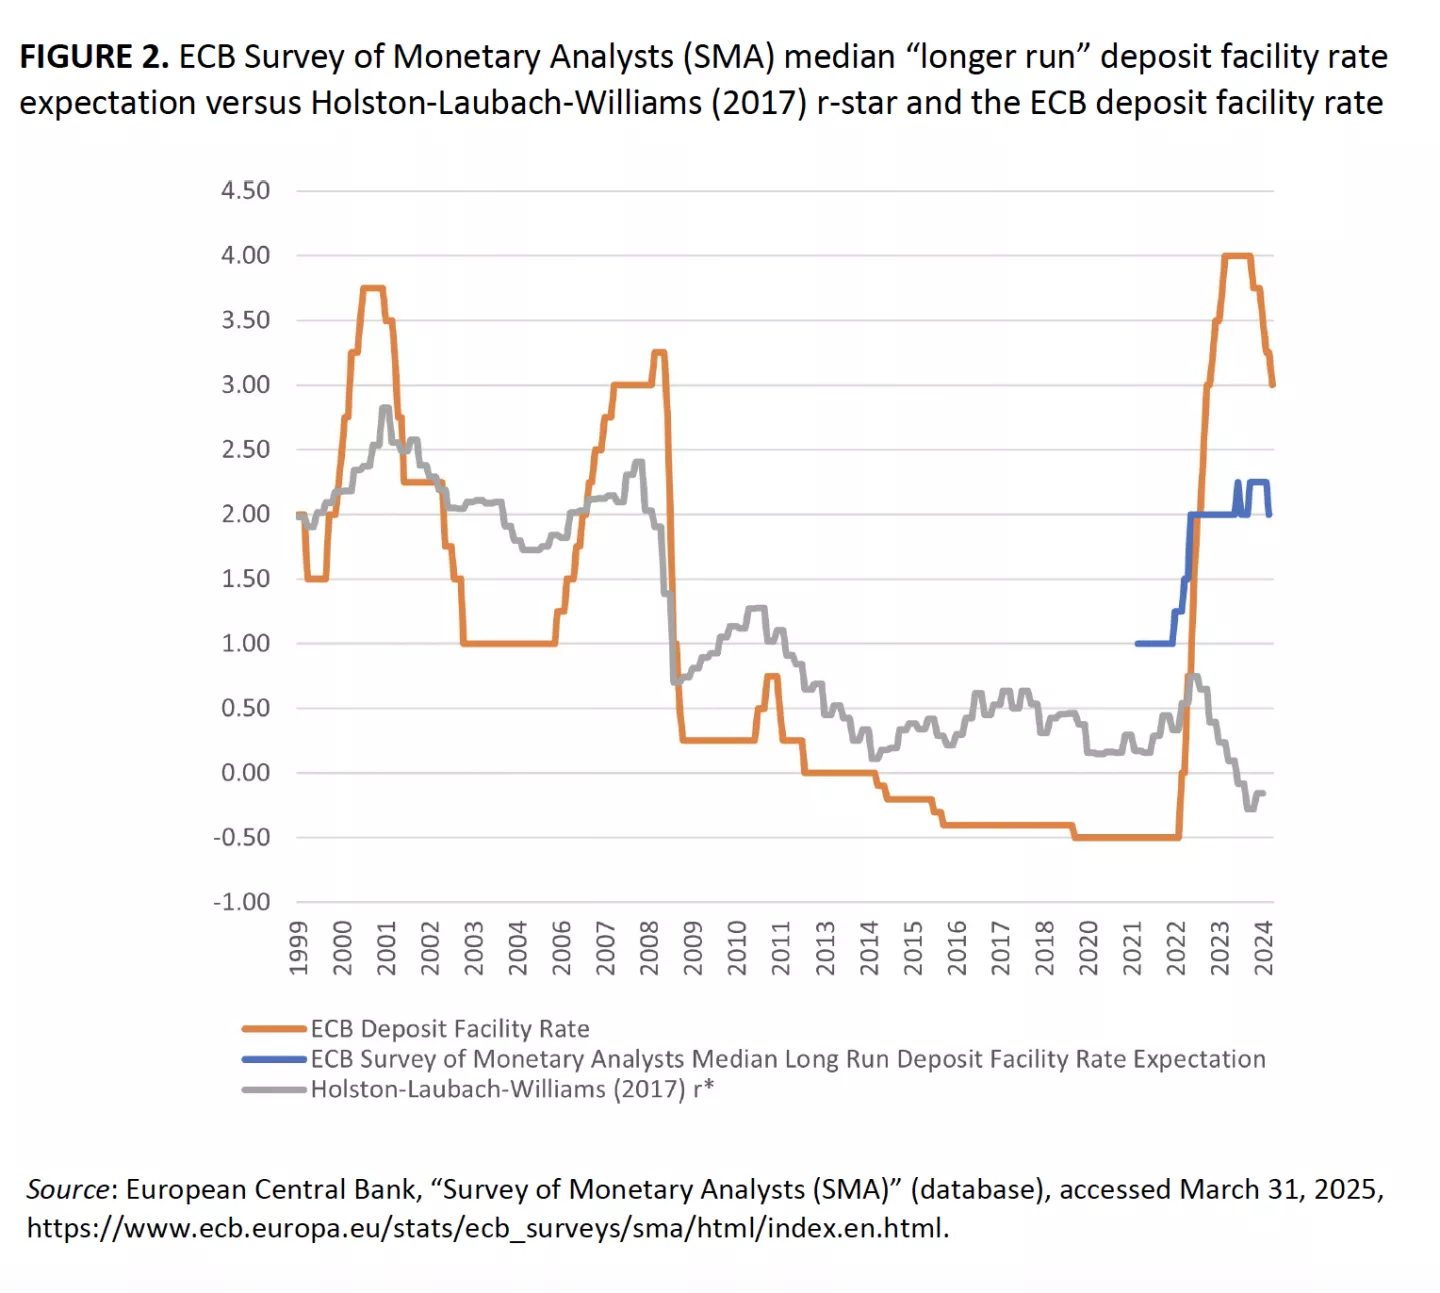
1.3 The UK survey
The Bank of England Market Participants Survey began asking the following question in their March 2022 survey:
And where do you see the level of Bank Rate at which monetary policy is neither expansionary nor contractionary (often referred to as the neutral, natural or equilibrium rate)?
Figure 3 plots the Bank of England Market Participants Survey long-term nominal neutral rate median estimate versus the Holston-Laubach-Williams r-star (which was discontinued in 2020) and the Bank of England policy rate. Notably, from early 2022 (when the survey first began asking r-star questions) to early 2024, the survey median estimate rose from 1.25 percent to 3.25 percent. There has been substantial debate whether r-star has risen or fallen in the wake of COVID-19, and this provides further support for the view that it has increased. Additionally, when the survey began in early 2022, its initial estimate of 1.25 percent was close to the most recent estimate of UK Holston-Laubach-Williams provided by the New York Fed, at 1.55 percent for the second quarter of 2020.
It is also worth noting that, based on r-star estimates from the Bank of England Market Participant Survey, the Bank of England policy rate was restrictive by more than 2 percent at the height of the early 2020s tightening cycle.
1.4 The Canada survey
The Bank of Canada’s Market Participants Survey asks:
What is your estimate of the long-term nominal neutral rate in Canada?
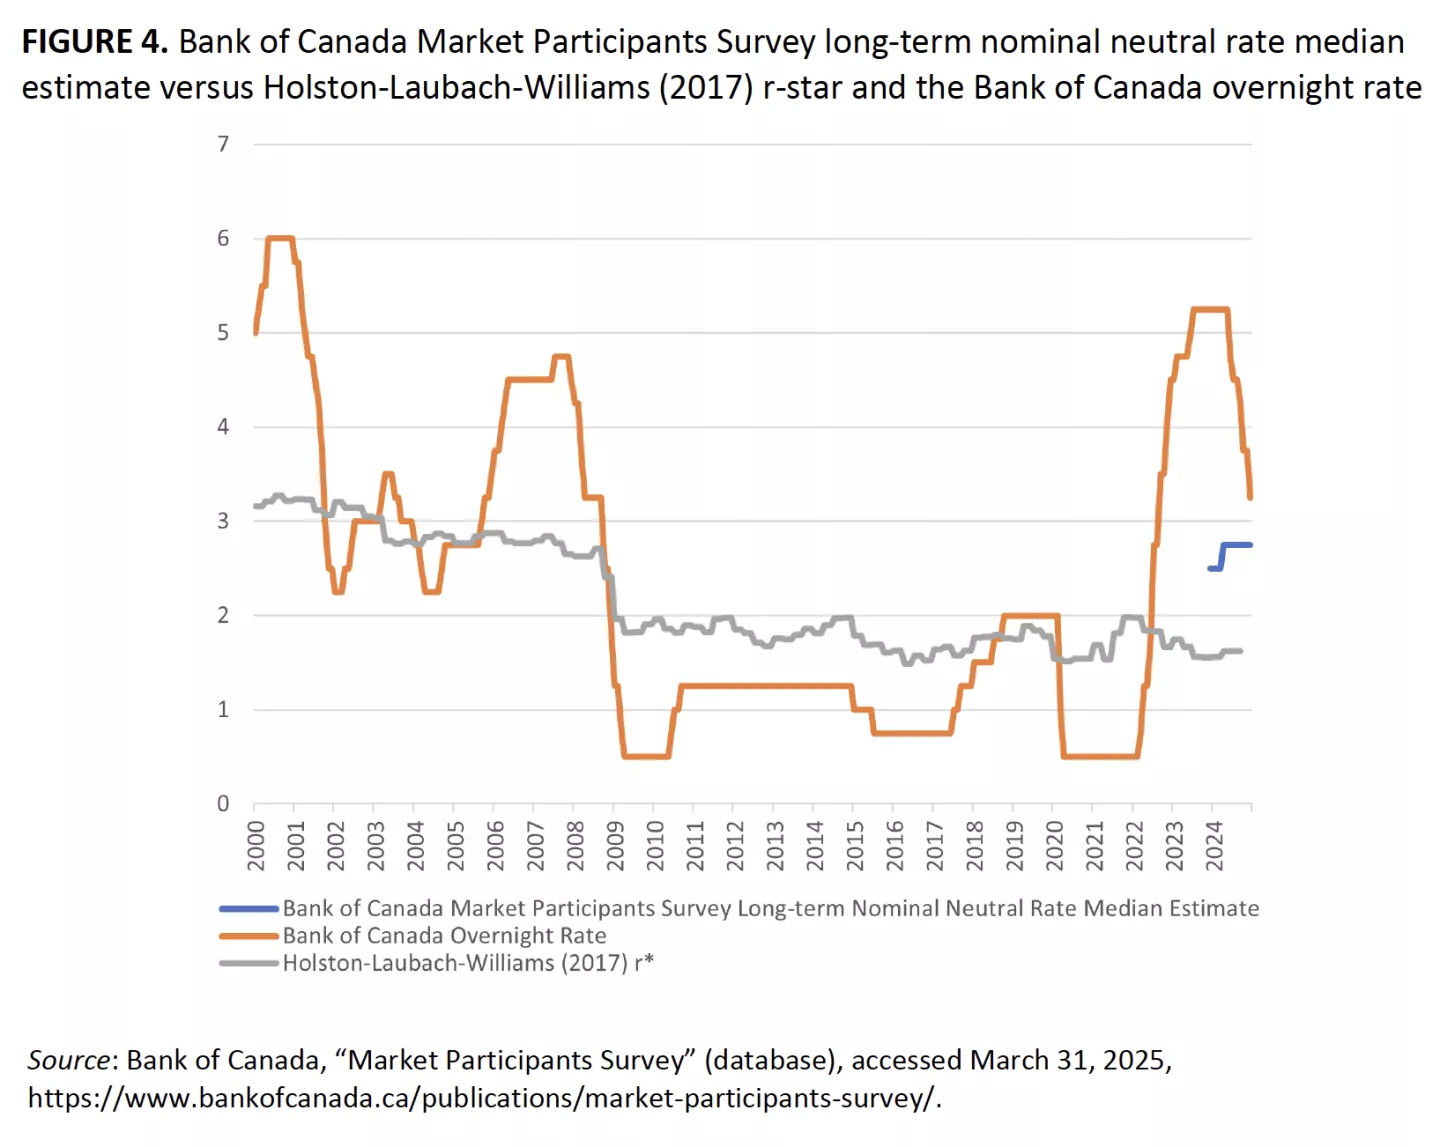
Figure 4 plots the Bank of Canada Market Participants Survey long-term nominal neutral rate median estimate versus the Holston-Laubach-Williams r-star and the Bank of Canada overnight rate. While the sample size is limited (as the Bank of Canada survey only began in 2023), the available data suggest that the Bank of Canada policy rate was restrictive by more than 2 percent at the beginning of 2023 before the central bank started cutting interest rates in 2024.
This is compared with the Canadian Holston-Laubach-Williams r-star estimate, which, at 1.62 percent as of the third quarter of 2024, is approximately 1 percent below the survey-based median estimate of r-star at 2.75 percent. This suggests that monetary policy is about one percentage point more restrictive in terms of its stance.
1.5 Forward guidance and central bank economic projections
In 2007, the Federal Reserve began publishing its Summary of Economic Projections (SEP), and in January 2012, Federal Open Market Committee (FOMC) participants’ assumptions about the appropriate level of the federal funds rate at year-end and in the “longer run” were added to the SEP.[3] Figure 5 presents the median FOMC SEP median longer-run federal funds rate forecast in comparison with the NY Fed Primary Dealer Survey Median ‘longer run’ federal funds rate expectation. Interestingly, these survey measures of market participant r-star expectations are closely related to the Federal Reserve FOMC Summary of Economic Projections median longer run fed funds rate forecast. Since 2012, when both data series first became available, the two series have never been more than 0.42 percent apart and, in most cases, have differed by no more than 0.13 percent, a striking result. Whether FOMC members follow market participants’ r-star forecasts to inform their own r-star projections, or vice-versa, is an interesting question. Some FOMC members have publicly stated that they consider market participant forecasts.

Several central banks publish forward guidance and economic projections, though their formats differ from the Fed’s SEP, and none regularly publish long-run interest rate forecasts from monetary policymakers.
- The European Central Bank provides macroeconomic projections quarterly, including GDP growth, inflation, and other indicators, but does not use a dot plot format for interest rate projections. Instead, the ECB relies on more qualitative forward guidance in their communications.
- The Bank of England (BOE) publishes its Monetary Policy Report quarterly, featuring fan charts that display probability distributions for future inflation, GDP growth, and the bank policy rate. However, the forecast horizon is only three years ahead, which is too short to be considered a good proxy for the long-run equilibrium interest rate (neutral rate).
- The Bank of Japan (BOJ) releases economic outlook reports that include board members’ forecasts for GDP and inflation. However, historically, the BOJ has been less explicit about future interest rate paths, given its long period of near-zero rates.
- The Reserve Bank of Australia (RBA) provides economic forecasts but has traditionally been more reserved about explicit interest rate projections compared to the Fed.
This difference in communication approaches reflects various views on the benefits and risks of providing explicit rate forecasts. Some central banks worry that markets might interpret projections as commitments rather than conditional forecasts based on current data.
However, given the lack of a comparable neutral rate forecast from other central banks’ economic projections (forward guidance), only the Fed’s long-run policy rate projections are used in this paper to compare with market participants’ forecasts for the long-run policy interest rate (in this case the New York Fed Survey of Primary Dealers and Survey of Market Participants).
2. Survey Estimate Uncertainty
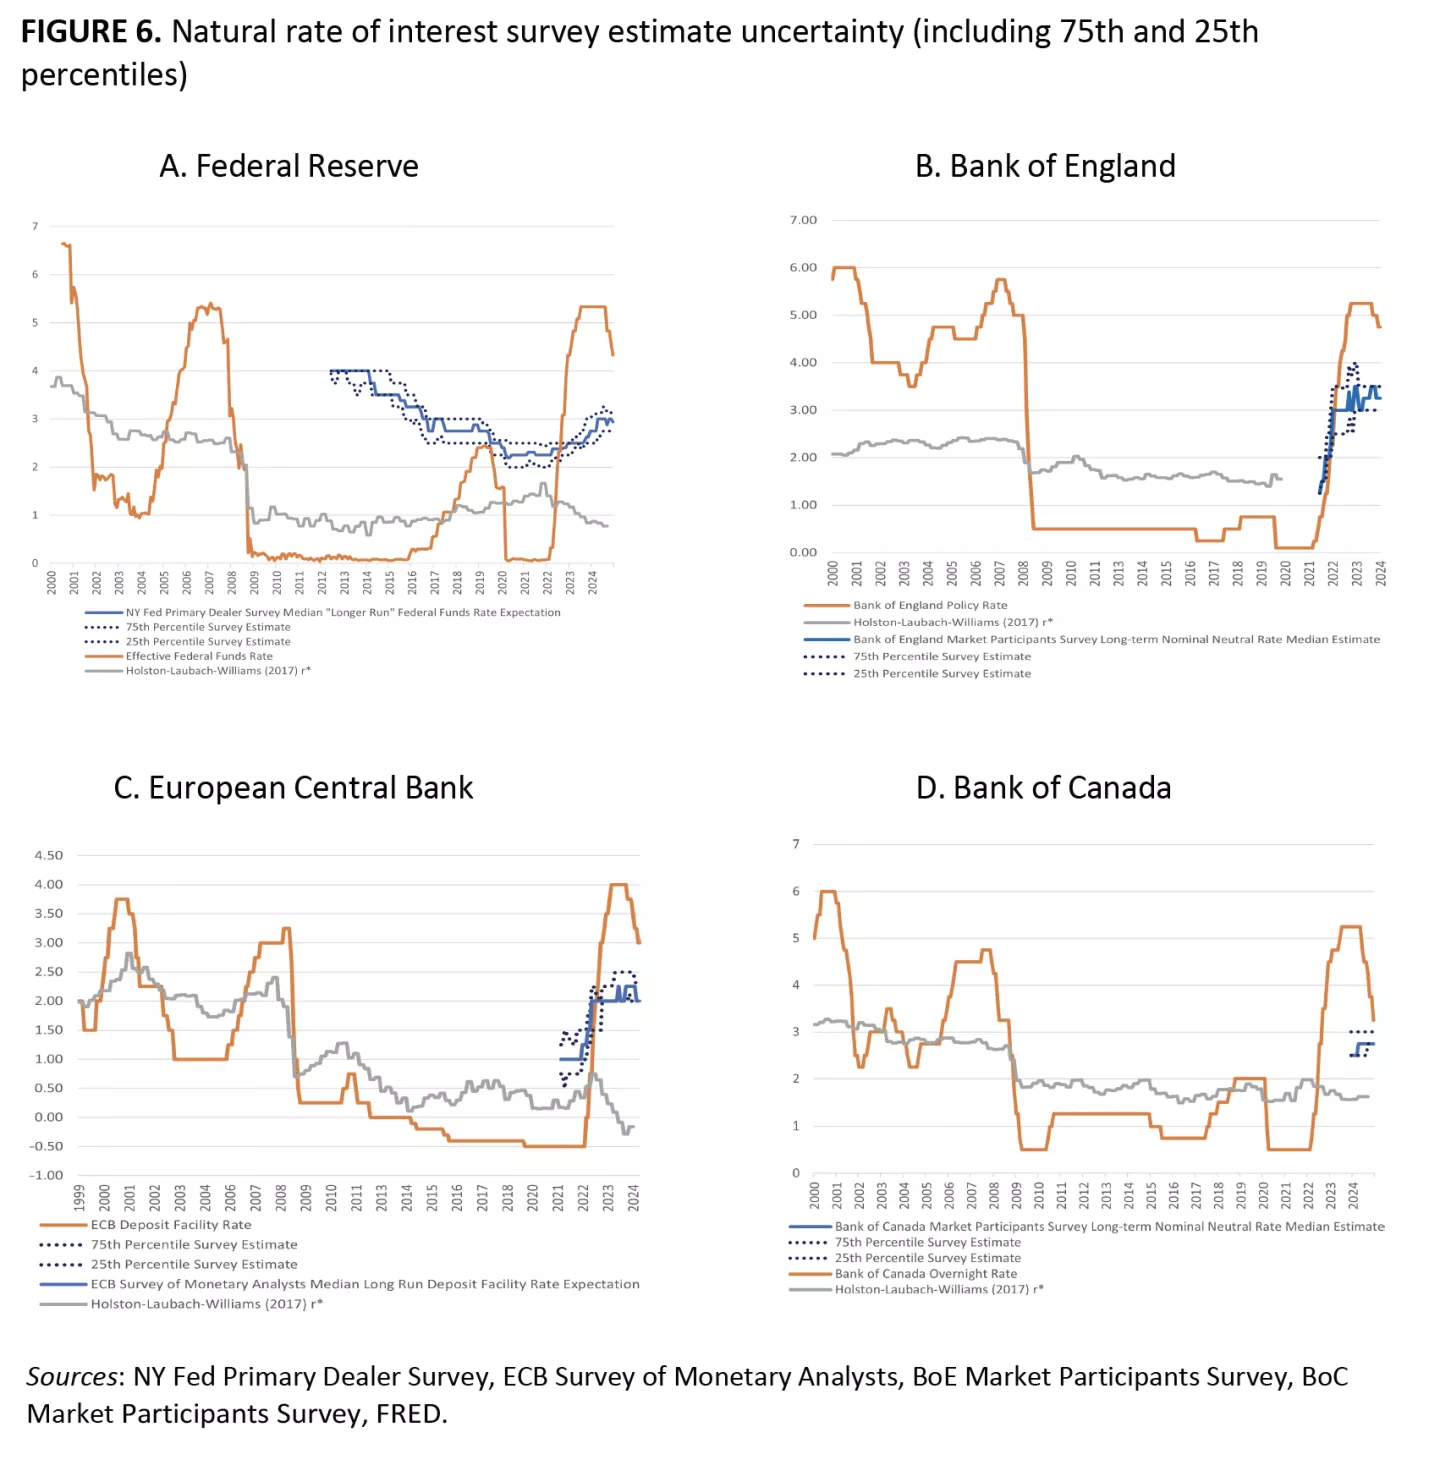
The central bank surveys, in addition to reporting the median survey response for long-run/neutral rate from respondents, also report the 75th and 25th percentiles. Figure 6 plots the time series of 75th and 25th percentiles for the long-run/neutral rate estimates reported by central bank surveys.
- In the US, the difference between the 75th percentile estimate and the 25th percentile estimate is, on average, 0.42 percent and has a maximum of 0.75 percent.
- In Europe, where the time series is shorter, the difference between the 75th percentile estimate and the 25th percentile estimate is, on average, 0.29 percent and never exceeds 0.50 percent.
- In the UK, the difference between the 75th percentile estimate and the 25th percentile estimate is, on average, 0.73 percent and has a maximum of 1.25 percent, suggesting greater uncertainty in survey estimates of r-star.
- In Canada, the difference between the 75th percentile estimate and 25th percentile estimate is, on average, 0.40 percent and has a maximum of 0.50 percent.
3. Implications for Taylor Rules
One way to assess the impact of different r-star estimates is to examine their implications in a standard Taylor Rule framework, following Taylor (1993) and Taylor (1999) (“balanced-approach”) and inertial rules.
The Taylor Rule is commonly written as such:
it= πt + r*t + β1(πt − π*t) + β2(yt − y*t)
where the nominal federal funds rate, r*t , is the real equilibrium interest rate (natural rate), πt is the current inflation rate, π*t is the target inflation rate (e.g., 2 percent for the Federal Reserve), yt is the actual output, and y*t is the potential output from the CBO.
In the original Taylor (1993) setup, there is an equal weight on inflation and the output gap: β1 = β2 = 0.5. In the "balanced approach" rule of Taylor (1999) there is a greater weight on the output gap with, β1 = 0.5 and β2 = 1.
In the inertial rule setup, there is a considerable weight of 85 percent on the prior period Taylor rule estimate nominal interest rate from the previous period, and a 15 percent weight on the current period Taylor Rule estimate:[4]
it = 0.85 ∗ it−1 + 0.15[πt + r*t + β1(πt − π*t) + β2(yt − y*t)
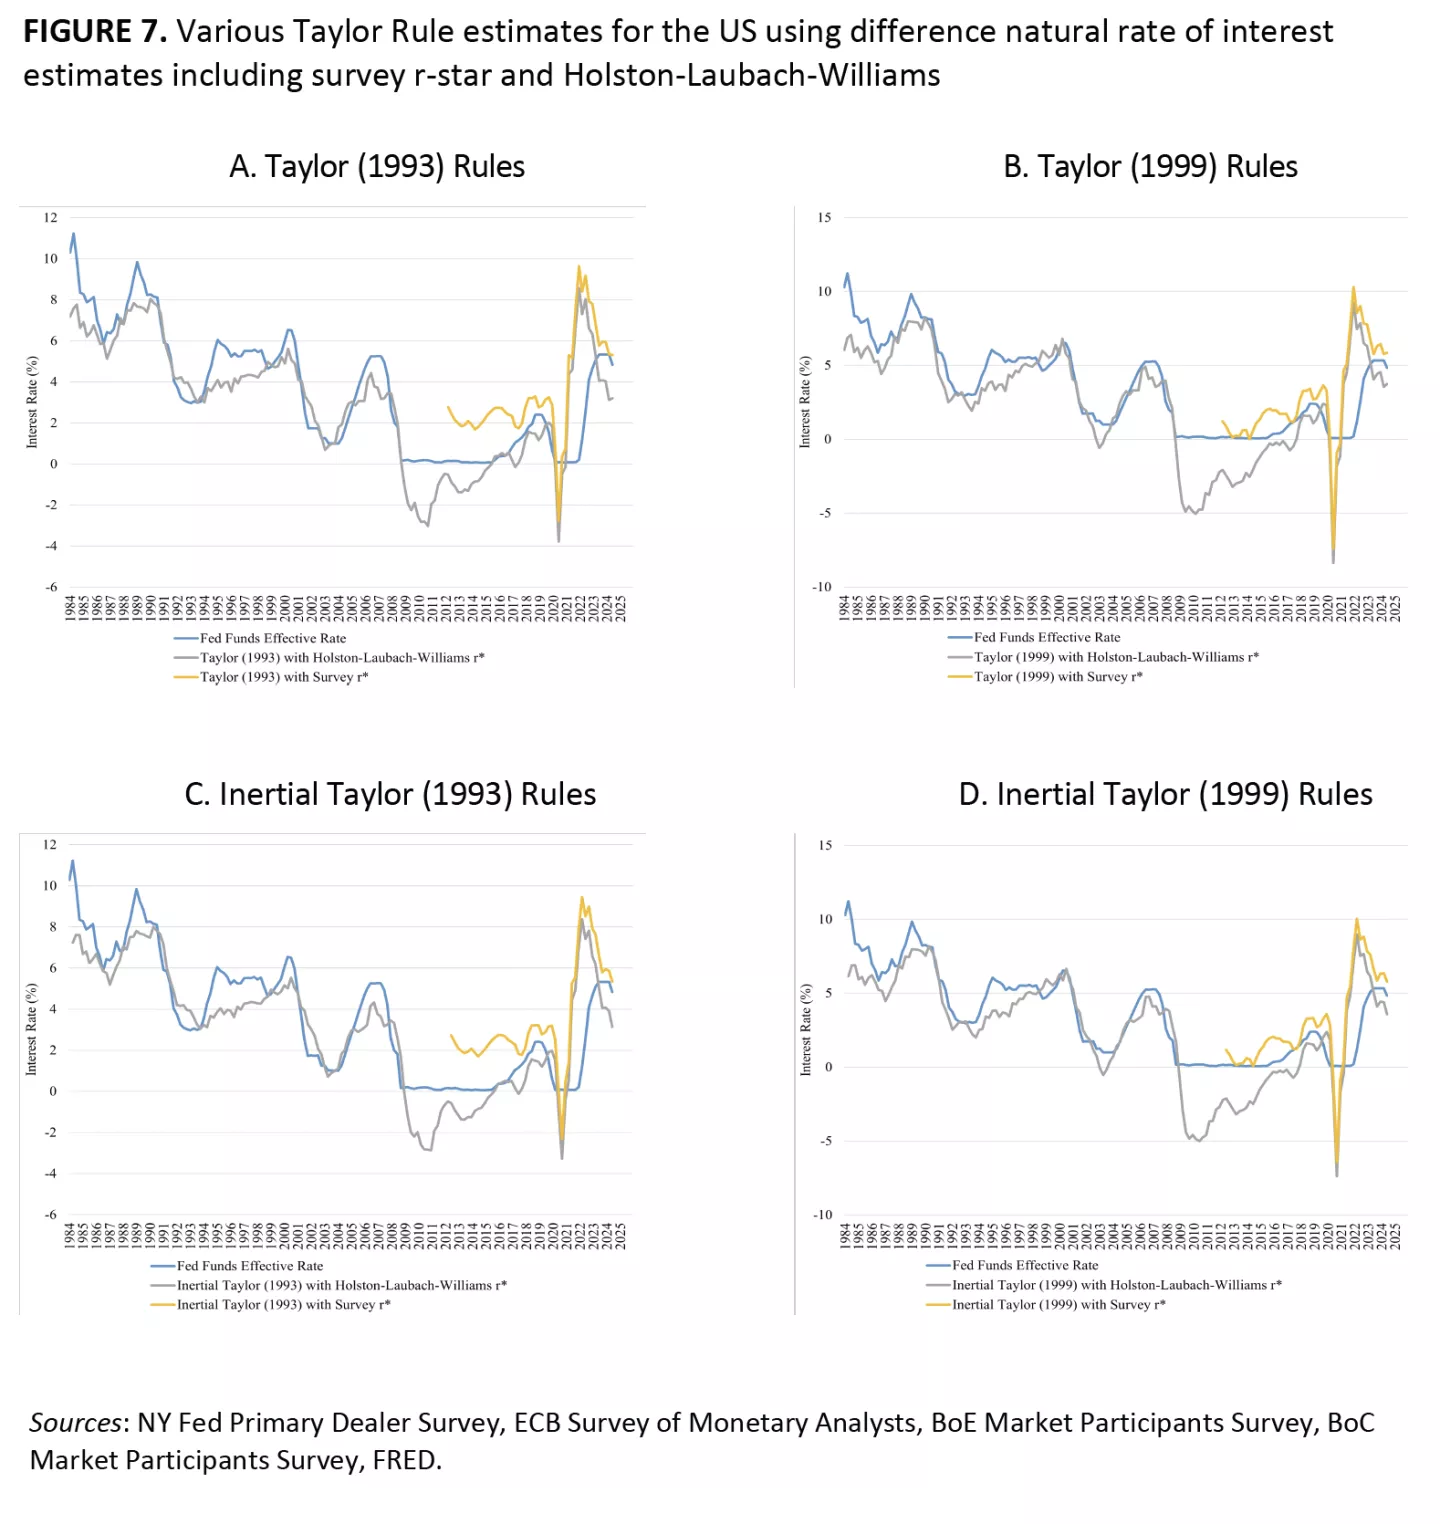
The intercept in the Taylor Rule represents a nominal version of the natural rate of interest. An incorrect estimate of r-star can lead to substantial deviations in policy recommendations. This becomes particularly evident in figure 7, where we contrast Taylor Rule–based interest rate recommendations using different r-star estimates, including the survey measures featured in this paper as well as traditional structural estimates like those of Holston, Laubach, and Williams (2017).
Panel (a) shows such monetary policy rule estimates using a Taylor (1993) rule, while panel (b) shows these estimates using a Taylor (1999) rule (with a bigger weight on the output gap). In both cases, the monetary policy rule with the model-based Holston-Laubach-Williams r-star prescribes the lowest interest rate and the most amount of monetary accommodation. This is followed by the interest rate recommended by the survey-based r-star and the constant 2 percent real r-star. Due to a larger weight on the output gap, the Taylor (1999) rule goes much deeper below zero than the Taylor (1993) rule during the COVID-19 pandemic.
Panels (c) and (d) show the inertial versions of the Taylor (1993) and Taylor (1999) rule with various r-star estimates. The inertial Taylor rule estimates in general do not prescribe as quick of an interest rate tightening cycle in 2022 amidst the peak of the early 2020s inflation, or as fast an interest rate easing cycle in the subsequent years as inflation recedes. This is to be expected as inertial rules prescribe a response of the federal funds rate to economic developments spread out over time. Such inertial responses may better capture the Fed’s monetary policy response function which may be slow to act. Here, the survey r-star estimates still prescribe a higher interest rate than the Holston-Laubach-Williams r-star.
Conclusion
To summarize, this paper proposes additional atheoretical, model-free estimates of the natural rate of interest using survey measures introduced by several central bank surveys created over the past decade in the US, UK, Eurozone, and Canada. The paper compares these alternative estimates of r-star to more traditional structural estimates, such as those of Holston, Laubach, and Williams (2017). While various alternative measures of r-star declined before the COVID-19 pandemic—alongside traditional structural measures—there has been substantial divergence in r-star estimates during the early 2020s. Specifically, survey-based estimates of r-star have risen, while structural estimates of r-star have fallen during this period of resurgent inflation.
Survey-based estimates may not suffer from misspecification issues that affect model-derived neutral rates (Holston, Laubach, and Williams 2017), which often have substantial standard errors. However, survey estimates of the natural rate of interest do reflect some disagreement among respondents. This variation is often small, as seen in the 25th and 75th percentiles of survey response distributions.
Survey-based estimates also may not suffer from the challenges associated with long-run, market-based measures—such as long-run interest rates derived from foothold versus leasehold values (Bäcker-Peral, Hazell, and Mian 2023—or historical long-term bond yields (Rogoff, Rossi and Schmelzing 2024), which may include risk premia and an uncertain term premium, both of which are difficult to measure.
As mentioned, there is evidence that survey-based r-star estimates are gaining traction, including among monetary policymakers at the Federal Reserve,[5] who have indicated they follow survey-based r-star measures as well as model-based ones. Model-based and survey estimates of r-star can and should co-exist: Structural estimates of r-star may inform survey respondents, who can choose which models and assumptions they prefer.
It would be highly valuable to monetary policymakers across countries if more central banks—beyond the Federal Reserve, Bank of Canada, European Central Bank, and Bank of England—were to introduce similar central bank surveys asking market participants for their r-star estimates. Time will tell how many more central banks will follow suit.
References
Akinci, Ozge, Gianluca Benigno, Marco Del Negro, and Albert Queralto. 2023. “The Financial (In)Stability Real Interest Rate, r-star*.” New York Fed Staff Reports No. 946.
Bäcker-Peral, Verónica, Jonathon Hazell, and Atif R Mian. 2023. “Dynamics of the Long Term Housing Yield: Evidence from Natural Experiments.” NBER Working Paper No. 31760.
Barsky, Robert, Alejandro Justiniano, and Leonardo Melosi. 2014. “The Natural Rate of Interest and Its Usefulness for Monetary Policy.” American Economic Review 104(5): 37–43.
Bolhuis, Marijn, Jakree Koosakul, and Neil Shenai. “Fiscal R-Star: Fiscal-Monetary Tensions and Implications for Policy,” IMF Working Paper No. 2024/174.
Callicott, Erika, David H. Papell and Ruxandra Prodan-Boul. 2024. “The Fed’s Policy Rules and the Neutral Real Interest Rate.” Working Paper.
Curdia, Vasco, Andrea Ferrero, Ging Cee Ng, and Andrea Tambalotti. 2015. “Has US Monetary Policy Tracked the Efficient Interest Rate?” Journal of Monetary Economics 70: 72–83.
Del Negro, Marco, Domenico Giannone, Marc P. Giannoni, and Andrea Tambalotti. 2017. “Safety, Liquidity, and the Natural Rate of Interest.” Brookings Papers on Economic Activity (Spring 2017): 235–94.
Campos, Rodolfo G., Jesús Fernández-Villaverde, Galo Nuño, and Peter Paz. 2024. “Navigating by Falling Stars: Monetary Policy with Fiscally Driven Natural Rates.” NBER Working Paper No. 32219.
Demers, Annick, Tamara Gomes, and Stephane Gignac. 2023. “Introducing the Bank of Canada’s Market Participants Survey.” https://www.bankofcanada.ca/2023/01/staff-analytical-note-2023-1/.
Dhawan, Pramol, Marc Seidner, and Richard Clarida. 2024. “Will the True Treasury Term Premium Please Stand Up?" PIMCO Research Report.
Edge, Rochelle M., Michael T. Kiley, and Jean-Philippe Laforte. 2008. “Natural Rate Measures in an Estimated DSGE Model of the US Economy.” Journal of Economic Dynamics and Control 32: 2512–35.
Giglio, Stefano, Matteo Maggiori, and Johannes Stroebel. “Very Long-Run Discount Rates.” Quarterly Journal of Economics 130, no. 1, (February 2015): 1–53.
Holston, Kathryn, Thomas Laubach, and John C. Williams. 2017. “Measuring the Natural Rate of Interest: International Trends and Determinants.” Journal of International Economics 108 (May 2017): S59-S75.
Laubach, Thomas and John C. Williams. 2003. “Measuring the Natural Rate of Interest.” Review of Economics and Statistics 85, no. 4 (November) 1063–70.
Lubik, Thomas A. and Christian Matthes, “Calculating the Natural Rate of Interest: A Comparison of Two Alternative Approaches.” Federal Reserve Bank of Richmond Economic Brief 15-10, October 2015.
Rachel, Lukasz and Lawrence H. Summers. 2019. “Public Boost and Private Drag: Government Policy and the Equilibrium Real Interest Rate in Advanced Economies.” Brookings Papers on Economic Activity (Spring): 1–76.
Rachel, Lukasz and Thomas D Smith. 2017). “Are Low Real Interest Rates Here to Stay?” International Journal of Central Banking 13, no. 3 (September 2017).
Roberts, John M. 2018. “An Estimate of the Long-Term Neutral Rate of Interest.” FEDS Notes.
Rogoff, Kenneth S., Barbara Rossi, and Paul Schmelzing. 2024. “Rethinking Short-Term Real Interest Rates and Term Spreads Using Very Long-Run Data.” NBER Working Paper No. 33079.
Taylor, John B. 1993. "Discretion versus Policy Rules in Practice." Carnegie-Rochester Conference Series on Public Policy 39: 195–214.
Taylor, John B. 1999. “A Historical Analysis of Monetary Policy Rules.” In Monetary Policy Rules, edited by John B. Taylor, 319–48. University of Chicago Press.
Wicksell, Knut. 1898. Interest and Prices: A Study of the Causes Regulating the Value of Money. Translated by R.F. Kahn (1936). Macmillan.
Notes
[1] In a February 7, 2025, public interview with this paper’s author, Federal Reserve Governor Adriana Kugler said, “I have to say I do like looking at the surveys as well. And there’s survey-based models, right? Which use the survey data to inform where r-star is too.” See John Hartley, host, Capitalism and Freedom in the 21st Century, podcast, “US. Monetary Policy, Inflation, and Labor Markets with Adriana Kugler (Federal Reserve Governor),” February 11, 2025, https://www.hoover.org/research/us-monetary-policy-inflation-and-labor-markets-adriana-kugler-federal-reserve-governor.
[2] In earlier waves around 2013, the NY Fed Primary Dealer Survey also asked for estimates of the two-year-ahead neutral rate. For example, in the October 2013 survey, Question 3b asks respondents:
As noted in the minutes to the September FOMC meeting, a number of participants expected that, “if economic headwinds died away only slowly. . . the achievement of the Committee’s employment and price stability objectives would likely require keeping the federal funds rate below its longer-run equilibrium value for some time even as economic conditions improved.” We are interested in the degree to which economic headwinds are impacting your estimate of the neutral nominal federal funds rate over the next several years—that is, the rate that would be consistent with no unemployment gap and inflation at the FOMC’s objective. Please provide your estimate of the neutral nominal federal funds rate at end-2016, given the financial and economic conditions you expect to prevail at that time.
When asking respondents to “please comment on any difference between this [two-year-ahead neutral rate] estimate and your longer run estimate provided,” the survey says:
Some dealers noted that their estimate for the neutral nominal federal funds rate at end-2016 was different from their estimate of the longer run target, while several others stated that they saw little to no difference between the rates. Of the dealers that saw a difference between the two estimates, some cited a variety of economic and regulatory headwinds resulting from the financial crisis that would imply a lower neutral nominal rate over a shorter time horizon. Several dealers noted their view that various economic headwinds had put downward pressure on the economy’s potential growth rate.
Note that the median end of 2016 neutral rate forecast of 3.25 percent to 3.50 percent around this time is somewhat lower than the roughly 4.00 percent forecast of the long run federal fund rates.
[3] Board of Governors of the Federal Reserve System, “Review of Monetary Policy Strategy, Tools, and Communications,” last updated February 22, 2019, https://www.federalreserve.gov/monetarypolicy/timeline-summary-of-economic-projections.htm.
[4] For further discussion of such inertial rules, see Callicott, Papell, and Prodan-Boul (2024).
[5] Federal Reserve Governor Adriana Kugler in a February 7, 2025, public interview with the author of this paper said, “I have to say I do like looking at the surveys as well. And there’s survey-based models, right? Which use the survey data to inform where r-star is too.” See John Hartley, host, Capitalism and Freedom in the 21st Century, podcast, “US Monetary Policy, Inflation, and Labor Markets with Adriana Kugler (Federal Reserve Governor),” February 11, 2025, https://www.hoover.org/research/usmonetary-policy-inflation-and-labor-markets-adriana-kugler-federal-reserve-governor.
Suggested Citation
Hartley, Jonathan S. “Survey Measures of the Natural Rate of Interest.” Mercatus Working Paper, Mercatus Center at George Mason University, April 2025.
Metadata
© 2025 by Jonathan S. Hartley and the Mercatus Center at George Mason University
Keywords: interest rates, monetary policy, natural rate of interest
JEL codes: E43, E52
author contact information
Jonathan S. Hartley, PhD Candidate, Stanford University, [email protected]
acknowledgements
The author is grateful for helpful comments from David Andolfatto, David Beckworth, Michael Bordo, Richard Clarida, John Cochrane, Jeff Campbell, Darrell Duffie, Jesus Fernandez-Villaverde, Patrick Horan, Peter Ireland, Adriana Kugler, Hanno Lustig, David Papell, J.R. Scott, John Taylor, and Kevin Warsh.
Disclaimer
The Mercatus Working Paper series allows in-house and affiliated scholars to share preliminary research findings. These papers are not peer reviewed. The views expressed are the authors’ own and do not reflect the official positions of the Mercatus Center or George Mason University.

