- | Government Spending Government Spending
- | Policy Briefs Policy Briefs
- |
What’s the Truth about Unemployment?
Introducing the Comprehensive Jobless Rate (U-5b)
The unemployment rate is probably the single most quoted statistic that measures the health of the economy. Changes in the gross domestic product (GDP)—which signal the beginning and end of recessions—are also important, but the public understandably seems to care more about how difficult it is to find a job than how much the economy is actually producing.
For this reason, it’s critical to have an accurate measure of “true” unemployment. However, many politicians and political pundits have derided the unemployment rate reported by the Bureau of Labor Statistics (BLS), arguing that it doesn’t count everyone who actually wants a job. In fact, President Trump, while on the campaign trail, suggested that the actual level of unemployment might be as high as 42 percent. These sentiments represent a lack of confidence in official government statistics, and they’re an important challenge to the economics profession. This paper addresses that challenge.
What Is the “True” Unemployment Rate?
The first problem in measuring unemployment is actually defining unemployment. If simply not having a job were enough to be considered unemployed, then the average unemployment rate in 2017 would have been 52.9 percent. However, this absurdly high statistic counts everyone without a job as being unemployed, including children and infants, meaning that it doesn’t really tell us anything about the strength of the economy or the difficulty in getting a job. Leaving out anyone below the age of 16 provides a somewhat more convincing number—39.9 percent—but this measurement still counts people who are retired, are staying at home with family, are currently attending school, or have other reasons for not seeking employment.
It seems reasonable to require that someone actually want a job in order to be counted as unemployed. Under this condition, the average jobless rate in 2017 would have been 7.5 percent.
This measure of unemployment can be called the comprehensive jobless rate (CJR) because it counts every adult or adolescent who (1) does not have a job currently, (2) says that they want a job, and (3) is capable of working. In effect, it’s the most realistic measurement of the unemployment rate.
What about the Other Official Unemployment Rates?
The CJR is higher than the various unemployment rates calculated by the BLS, and for a good reason. The official BLS measures of unemployment, labeled as U-1 through U-6, provide a more nuanced understanding of the labor market, such as identifying longer-term unemployment (U-1) and discouraged job seekers (U-4) (see table 1).
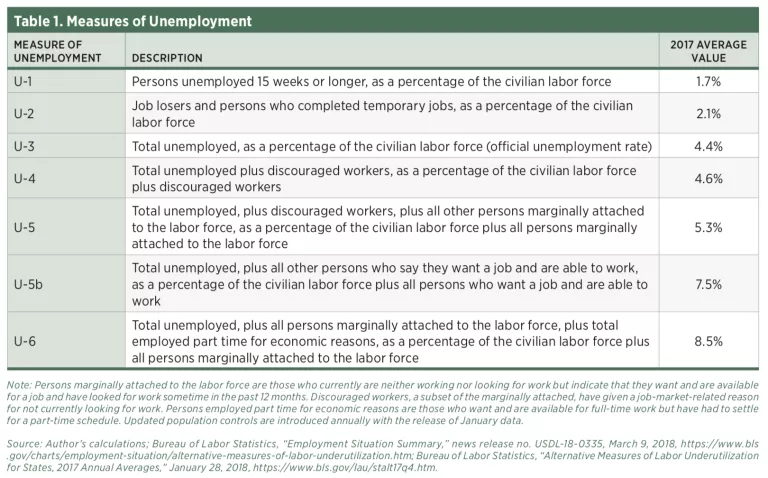
The CJR adds value to the existing BLS unemployment measures by providing an upper bound on the rate of joblessness. It fits in between U-5, which counts those people who want jobs and who are marginally attached to the workforce, and U-6, which counts those people who are employed part time but desire a full-time job. Following the BLS’s naming convention, the CJR could also be referred to as the “U-5b” unemployment rate.
The critical difference between the U-5 rate and the CJR/U-5b is that the U-5b counts everyone who says they want a job, regardless of whether they are currently available to start a job and regardless of the last time they actively searched for employment. In comparison, the U-5 does not count people who have not actively searched for work in the last 12 months or who were not available to start a job when they were surveyed. This means that the U-5 doesn’t count people whose frustration has led to a long-term abandonment of their job search, nor does it count students who are near graduation and are actively seeking work but are not immediately able to begin working. The CJR/U-5b accounts for these groups who slip through the cracks of the other unemployment measures.
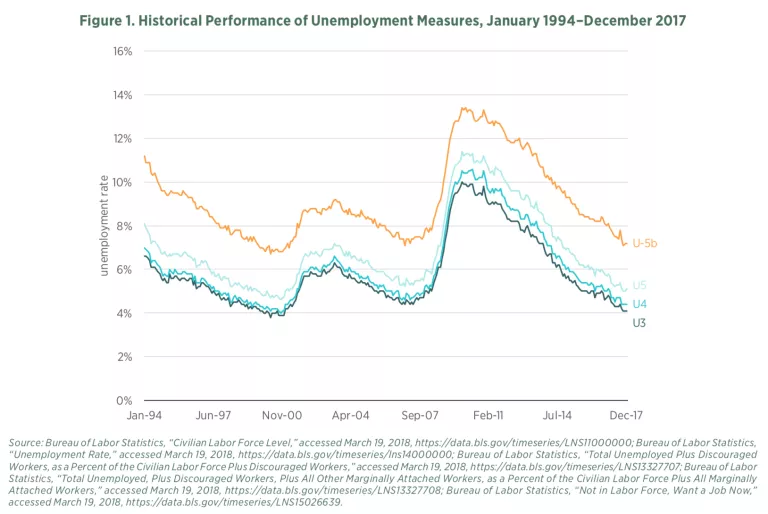
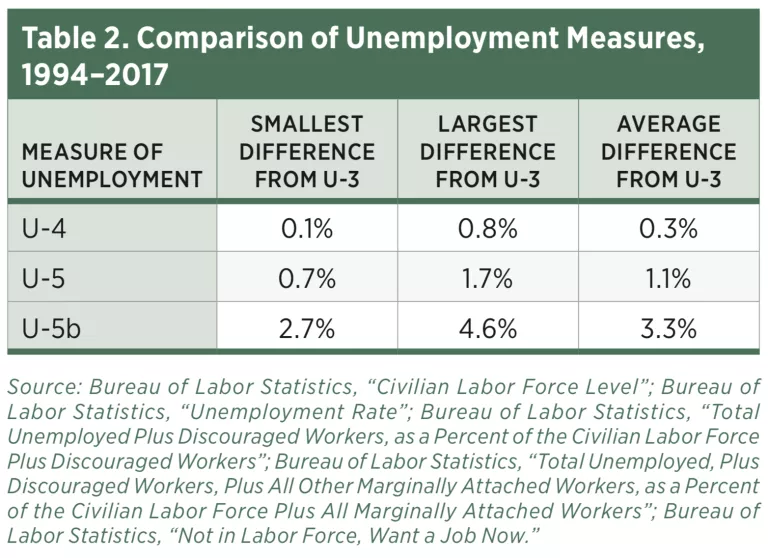
Figure 1 compares the historical level of the CJR/U-5b with the primary BLS unemployment rates that focus on joblessness (U-3 through U-5). The CJR follows the same general trends over time as the other unemployment rates and is, on average, around 3.3 percent higher than the U-3, the official unemployment rate that is most often reported (see table 2). The fact that the various unemployment rates show the same trends over time suggests that, while the official unemployment rate doesn’t measure the full scope of joblessness, its fluctuations do provide relevant information on the overall health of the labor market.
Conclusion
The comprehensive jobless rate, or U-5b, provides the highest possible realistic measurement of joblessness. The only way to achieve a higher measure of unemployment would be to include (1) people who don’t actually want a job, (2) people who are physically or mentally unable to work as a result of an illness or disability, and (3) people who are currently employed part-time but want full-time employment (which is an important issue, but is not the same as joblessness).
The CJR offers a way to cut through partisan bickering and political pundit hand-wringing over not knowing the “true” unemployment rate. As such, it provides a stable metric that can allow for more productive policy discussions and a better understanding of the economy for the general public.
Additional details
For more on labor force participation and further background on the Comprehensive Jobless Rate (U-5b), see Scott Winship's research What's behind Declining Male Labor Force Participation: Fewer Good Jobs or Fewer Men Seeking Them? and Declining Prime-Age Male Labor Force Participation: Why Demand- and Health-Based Explanations Are Inadequate.
Related Content
- | Expert Commentary Expert Commentary
BLS Jobs Numbers Analysis, February 2018

- | Government Spending Government Spending
- | Data Visualizations Data Visualizations
The Official Unemployment Rate Isn’t the Complete Picture
- | Data Visualizations Data Visualizations

