- | Regulation Regulation
- | Policy Briefs Policy Briefs
- |
Baselines
A Fundamental Element of Regulatory Impact Analysis
This Mercatus on Policy explores the importance of baselines in assessing the benefits and costs of federal regulations.
For more than three decades, executive branch agencies have been required to conduct regulatory impact analyses (RIAs) for all regulations deemed to be “economically significant.” A regulation is considered economically significant when the Office of Management and Budget (OMB) determines that its benefits, costs, or other effects amount to $100 million or more annually. The purpose of these RIAs is to identify whether there is a problem the government should consider addressing and to identify and estimate the costs and benefits of different options to solve the problem. Doing so allows agencies to make informed decisions when initiating regulatory actions. Previous Mercatus research has shown the importance of identifying alternative forms of regulation, as well as alternatives to regulating, before making a decision.[1]
The need to consider alternatives raises another perhaps more important question: How do these alternatives compare to the state of the world that would occur if no new regulation were issued? Only after assessing what the world would look like in the absence of a new regulation can an agency truly identify which alternative offers the largest benefits for the least cost.
WHAT IS A BASELINE?
A baseline is a realistic portrayal of what the world would look like in the absence of a particular regulation. The baseline should be backed up with sound evidence: either the agency’s own data-driven empirical analysis or published research that demonstrates why the agency believes the particular baseline is realistic.
The baseline is not the same thing as what is occurring now or what occurred in the recent past. A baseline should take account of likely trends and changes that will occur and not simply assume that a static moment in time will go on forever in the absence of the regulation. By forecasting changes that are likely to take place in the future, the baseline can distinguish between the marginal impact of the proposed regulation and other effects that would have occurred anyway in absence of the regulation.
It is important to remember that a regulation will alter consumer and producer behavior away from the baseline and that these differences in behavior will generate costs and benefits to society. Following an industrial accident at a plant, for example, other companies may examine their own practices and make changes to their own plants, particularly if something new has been learned. These normal market responses will reduce the risk of these accidents and will also reduce any costs and benefits of any government actions to address the problem. This type of normal market responses should be accounted for in the baseline and should not be counted as costs or benefits of the relevant regulation.
Often market participants find out new information about the existence of a problem at the same time that agencies do. Noting these responses is important when constructing a realistic baseline because it gets at the issue of whether a market failure or other systemic problem exists that requires resolution through regulation. Previous Mercatus research has identified the importance of demonstrating the problem that an agency is seeking to solve through regulation.[2] If new information emerges that reveals a problem that was previously unknown and if this information causes consumers and firms to respond, this may mean that the problem is not systemic in nature and, therefore, does not require regulation (i.e., no market failure).
HOW ARE AGENCIES DOING?
The Mercatus Center Regulatory Report Card has evaluated the quality of RIAs since 2008.[3] Agencies receive a score from 0 to 60 based on 12 criteria outlined in Executive Order 12866 and OMB Circular A-4, documents that lay out the requirements and best practices for RIAs.[4] One question in the report card relates to baselines. It asks: Does the analysis adequately address the baseline? That is, what the state of the world is likely to be in the absence of federal intervention not just now but in the future?
Agencies receive a score on this question ranging from 0 to 5. The average score from 2008 to 2010 was 2.4 out of 5, or just below 50 percent. Four rules out of 72 scored a zero on this question, meaning the baseline is unclear in the analysis or not addressed at all. 15 scored a one, suggesting there is some kind of baseline asserted with no analysis or evidence to justify it.[5]
WHAT SHOULD A REALISTIC BASELINE LOOK LIKE?
OMB Circular A-4 lays out guidelines for how agencies should conduct their RIAs.[6] Specifically, it states that agencies should take into consideration the following criteria when generating a baseline:
• evolution of the market;
• changes in external factors affecting expected benefits and costs;
• upcoming changes in regulations promulgated by the agency or other government entities; and
• the degree of compliance by regulated entities with other regulations.
Additionally, the circular recommends that agencies should consider how technological changes in the future may affect the outcome of a particular regulation. It is careful to point out that, “if you assume that technology will remain unchanged in the absence of regulation when technology changes are likely, then your analysis will over-state both the benefits and costs attributable to the regulation.”[7]
When assessing the costs and benefits of a particular regulation, agencies should be sure to compare each alternative against the baseline. This allows the agency to assess the incremental costs and benefits of each alternative, and compare the alternatives with each other and the proposed regulation. In addition, agencies should acknowledge uncertainty surrounding the baseline and, when necessary, consider using multiple baselines that demonstrate what the world might look like under various scenarios. In these cases, alternatives should then be compared to each distinct baseline.[8]
If other regulations are being proposed, or have been recently finalized, by the relevant agency or any other agency, likely responses to these rules, as outlined in the RIAs in those rules, should be included in the baseline as well.[9]
Similarly, accurate baseline analysis is also important for retrospective analysis of regulations. We cannot know the actual effects of a regulation without comparing the observed effects with the relevant counterfactual (i.e., what would likely have occurred in the absence of the regulation).[10]
BEST PRACTICE
An example of a well-done baseline comes from a 2011 rule proposed by the Department of Transportation that required electronic on-board recording devices on certain commercial motor vehicles. DOT considered three baselines in its analysis and compared each alternative rule under consideration to each of the three different baselines. The RIA adjusted the baseline level of non-compliance for factors such as inflation, a decline in violations that preceded the mandate for electronic on-board recorder use, and the decline in commercial motor vehicle related crashes.
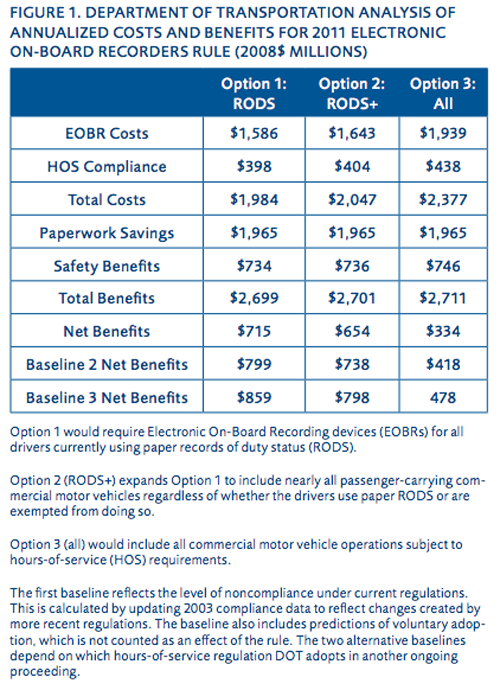
Using the first baseline, DOT estimated benefits, costs, and net benefits for the proposed rule. The two other baselines considered the likely state of the world under various alternatives considered in connection with another regulation DOT proposed around the same time. These baselines incorporated the interaction of the proposed rule with multiple versions of the other regulation proposed by DOT. DOT then calculated net benefits of each alternative relative to each baseline and displayed the results in several easy to read charts, one of which is reproduced above (see Chart above).
This chart shows how regulatory alternatives can be compared against multiple baselines. In this case, costs and benefits were calculated for each of three options the agency considered. Net benefits were then calculated against three different baselines. The analysis shows that Option 1 has the highest net benefits under any of the three baselines. This is important because it informs the agency that, by choosing Option 1, it may provide the greatest benefits to citizens, relative to the costs that are also imposed by the regulatory option. If a different option had higher net benefits under one baseline scenario than under others, DOT might have made a different decision—perhaps choosing the option that maximized net benefits under the most likely baseline, or perhaps waiting until it first made decisions on the other regulations.
Another example of a best practice occurs in the RIA for a 2012 Environmental Protection Agency (EPA) rule that sets performance standards for greenhouse gas emissions from new coal-fired electric utility generating units. For this regulation, the agency claims that the rule will have neither costs, nor benefits, owing to the fact that the agency does not believe any new coal-fired power plants will be built in the time period being analyzed.
EPA was correct to state that there would be no benefits or costs associated with the regulation since the marketplace is already moving in that direction anyway. This is an example of good analysis by the agency’s economists, since they did not confuse benefits and costs of the rule they are issuing with changes in behavior that are already occurring in absence of a regulation.
GOOD ANALYSIS VS. GOOD DECISION-MAKING
This last example gets at a separate issue, however, which is whether good analysis performed by an agency’s experts helps inform the decision to issue a regulation. If a baseline indicates that a problem is going away or that market conditions are already working to solve the problem, why issue a regulation at all?
EPA claimed that if circumstances change and new coal fired power plants are built, the regulation will produce net benefits. However, analysis for this alternative baseline is scant compared to the rest of the RIA. Since EPA admits there is a small likelihood that there will be zero net benefits or even net costs, a “wait and see” approach might be the most prudent decision. EPA could easily wait to see if energy costs change resulting in more plants being built and then decide if regulating is the most appropriate policy decision. At present, there is simply no way of knowing what technologies or other factors may become relevant in the future.
Therefore, baselines should not be used just for the sake of estimating the benefits and costs of alternatives; they should also be used to help inform decision-makers about whether or not regulating makes sense in the first place.
EXAMPLES OF SUBSTANDARD ANALYSIS
One example of poor baseline analysis accompanied a 2010 rule proposed by the Department of Labor that sought to lower miners’ exposure to respirable coal mine dust. While this is certainly a worthy goal, the baseline the agency used assumed that the number of citations for violating the rule in the future would remain as they were in the previous year.
While it is possible that this baseline was realistic, no evidence was cited to support the use of a figure from just one prior year as the baseline. In addition, there was no consideration of uncertainty surrounding this baseline. Instead, the agency assumed its baseline was correct with certainty, with no discussion of what trends could be expected if the Mine Safety and Health Administration (MSHA) did not take this action. A more accurate method would be to have examined a series of prior years (not just one), identify trends that might continue, and also consider factors that might alter those trends.
One particularly egregious example of a flawed baseline occurred in a 1997 EPA retrospective analysis of the costs and benefits of the Clean Air Act.[11] As a recent Mercatus Center study pointed out, “In its baseline scenario of air quality without the 1970 Clean Air Act, six metropolitan areas would have been worse than Bombay, two would have been worse than Manila, and one would have been worse than Delhi, one of the world’s most polluted cities.”[12] This simply is not a realistic scenario. The agency ignored air quality improvements that may have been attributable to factors other than the Clean Air Act. Yet using this unrealistic baseline, the agency claimed that the benefits of Clean Air Act rules lay in the range of $6 trillion to $50 trillion, when in fact the real figure was undoubtedly much lower.
CONCLUSION
A sound baseline analysis helps an agency determine whether to regulate and how to regulate. A realistic baseline is crucial to obtaining accurate measurement of the true costs and benefits of federal regulation. Only a proper baseline—one that assesses what the world would look like in the absence of a particular regulation—can ensure an agency that its proposed regulation will likely achieve its intended results. The Mercatus Center’s Regulatory Report Card has uncovered some good examples of baseline analysis, but the low average scores for analysis of baselines suggest that in many cases, baselines need more attention.
ENDNOTES
1. See for example Jerry Ellig and James Broughel, “Regulatory Alternatives: Best and Worst Practices,” Mercatus on Policy, Mercatus Center at George Mason University, Arlington, VA, February 21, 2012. https://www.mercatus.org/publication/regulatory-alternatives
2. See for example Jerry Ellig and James Broughel, “Regulation: What’s the Problem?,” Mercatus on Policy, Mercatus Center at George Mason University, Arlington, VA, November 21, 2012. https://www.mercatus.org/publication/regulatory-alternatives
3. For information on Report Card methodology, visit http://www.mercatus.org/reportcard.
4. Executive Order 12866—Regulatory Planning and Review, 58 Federal Register 51735 (Oct. 4, 1993). Office of Management and Budget, Circular A-4, “Regulatory Analysis” (September 17, 2003).
5. These numbers refer only to “prescriptive” regulations that impose mandates or prohibitions; they omit budget regulations that implement federal spending or revenue collection programs. Budget regulations generally score lower than prescriptive regulations. The average score for budget regulations on the question about baselines in 2008 and 2009 was 1.2 out of 5 possible points. The Report Card discontinued evaluating budget regulations after 2009.
6. Office of Management and Budget, Circular A-4, “Regulatory Analysis” (September 17, 2003).
7. Office of Management and Budget, Circular A-4, “Regulatory Analysis” (September 17, 2003): 37. It will affect estimates of both benefits and costs as both are derived from the same behavioral changes.
8. Office of Management and Budget, Circular A-4, “Regulatory Analysis” (September 17, 2003): 16.
9. Office of Management and Budget, Circular A-4, “Regulatory Analysis” (September 17, 2003): 15.
10. Winston Harrington, Richard D. Morgenstern, and Peter Nelson, “On the Accuracy of Regulatory Cost Estimates,” Journal of Policy Analysis and Management 19:2 (2000), 301.
11. See EPA, “Benefits and Costs of the Clean Air Act,” http://www.epa.gov/air/sect812/index.html.
12. Randy Lutter, “Regulatory Policy: What Role for Retrospective Analysis and Review?,” Mercatus Working Paper, Mercatus Center at George Mason University, Arlington VA, April 18, 2012.

