- | Academic & Student Programs Academic & Student Programs
- | Government Spending Government Spending
- | Working Papers Working Papers
- |
The U.S. Experience With Fiscal Stimulus
A Historical and Statistical Analysis of U.S. Fiscal Stimulus Activity, 1953-2011
Can deliberate government spending activities have a continuing net positive impact on economic activity? Do federal spending programs designed to offset a recession’s negative effects really add a net positive nudge to GDP growth? Can government purposefully and successfully stimulate ongoing employment growth?
Can government spending activities have a positive impact on economic activity? Do federal spending programs designed to offset a recession’s negative effects add a boost to GDP growth? Can government purposefully and successfully take steps that will increase employment?
In essence, do government stimulus programs really work?
These questions were a constant part of the public debate following the implementation of the American Recovery and Reinvestment Act signed into law in 2009. When it was first launched, economists in the Obama administration predicted that the program would generate or avoid the loss of almost 4 million jobs and that the unemployment rate would not go above 8%. However, the rate immediately rose to 8.2% and jumped to over 10% in October 2009.
As shown below, the unemployment rate in early 2012 seemed locked in a range that rotated around 8.5%. This was true in spite of the $787 billion the government spent in a deliberate attempt to bring down unemployment, more than a trillion dollars obligated to bail out auto companies, insurance companies, mortgage lenders, and banks, and ongoing war expenditures that ran a billion dollars a day. Put together, fiscal, monetary, and defense policies did not seem able to put meaningful wind into the economy’s flagging sails.

This report goes far beyond the most recent recessions in an effort to assess stimulus effectiveness, including every recession since WWII. It examines the history of stimulus efforts as revealed by presidential statements found in the ERP and determines if stimulus actions have affected economic performance. The review of issues of the Economic Report of the President that coincide with recessionary periods has uncovered key dimensions of the development and practice of White House stimulus policy:
Stimulus through the decades
1953 under Dwight D. Eisenhower
Examination of a large number of data points shows that the economy responds either negatively or not at all to increased government spending, which is to say that GDP growth does not follow stimulus spending.
The Relationship between stimulus spending and economic growth during recessions
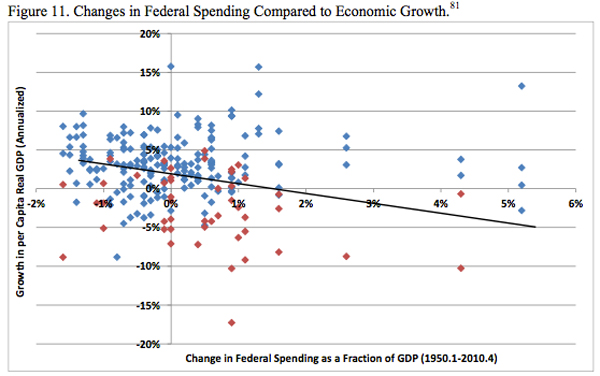
As Figure 11 shows, from approximately 1950 to 2010, increases in federal spending were not associated with significant increases in per-capita GDP growth. Blue and red symbols represent quarters of expansion and recession, respectively.
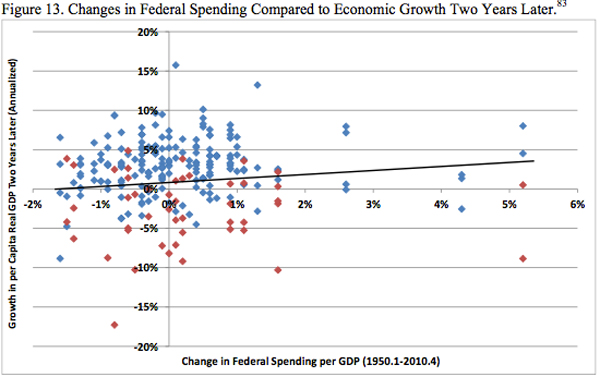
As Figure 13 shows, from approximately 1950 to 2010, increases in federal spending were associated with decreases in per-capita GDP growth.
Deliberate efforts to stimulate the US economy through government fiscal policy have been a formal part of the political economy for more than eighty years. The analysis uncovers a rich but at times confused history of efforts to spend our way out of recessions on the one hand but then deal later with an inflationary economy by way of monetary policy. While there can be appearances of strong favorable responses to fiscal medicine, the more rigorous statistical analysis of relationships between stimulus spending and GDP growth presented a mixed bag of evidence.
To speak with a scholar or learn more on this topic, visit our contact page.
Related Content
- | Government Spending Government Spending
- | Working Papers Working Papers
Did Stimulus Dollars Hire the Unemployed?
- | Government Spending Government Spending
- | Data Visualizations Data Visualizations
Did the Stimulus Create Jobs?
- | F. A. Hayek Program F. A. Hayek Program
- | Housing Housing
- | Policy Briefs Policy Briefs
The American Recovery and Reinvestment Act: Will More Public Spending Pave the Way to Better Infrastructure?


