- | Monetary Policy Monetary Policy
- | Policy Briefs Policy Briefs
- |
The Neutral Level of NGDP and the NGDP Gap: Q4 2021
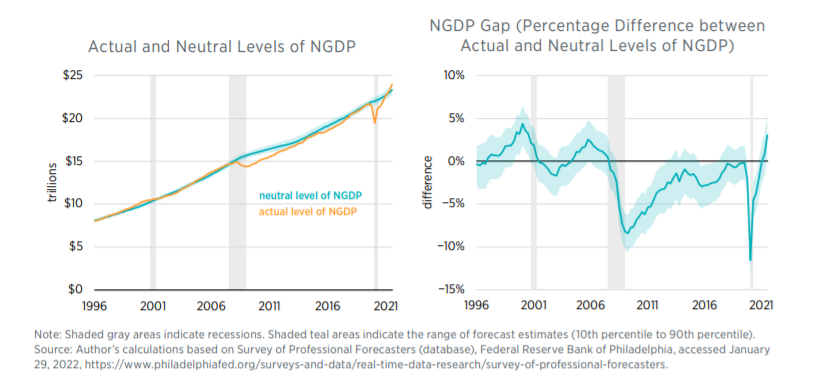
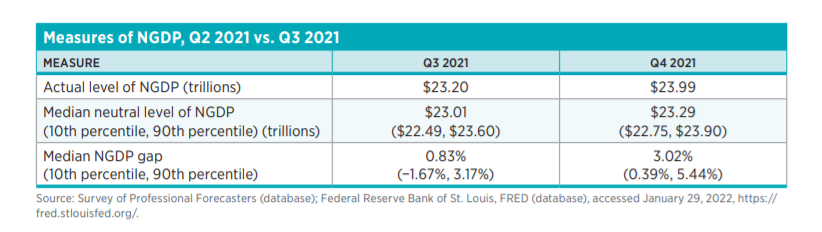
The nominal GDP (NGDP) gap, a measure of unexpected changes in the dollar size of the US economy, is calculated as the percentage difference between the actual and the neutral levels of NGDP. The neutral level of NGDP, in turn, is a sum of all dollar incomes expected by households and businesses coming into a specific time period and is created using data from consensus forecasts. In the fourth quarter of 2021, the median NGDP gap rose to 3.02 percent, up from the previous quarter’s value of 0.83 percent.
The 3.02 percentage NGDP gap means that the dollar size of the economy, $23.99 trillion, was greater than the expected $23.29 trillion. Moreover, it was also greater than the 10th and 90th percentiles of the NGDP gap, which shows that this gap was significantly different from zero during this time. This means aggregate spending and income in dollar terms were materially higher than their expected values and that monetary policy was running hot in the fourth quarter of 2021.
A CLOSER LOOK AT THE NGDP GAP
As noted, the NGDP gap requires an estimate of the neutral level of NGDP. The neutral level of NGDP is estimated by taking an average forecast of NGDP, or total nominal income, for a given quarter based on forecasts for that period from the preceding 20 quarters. The forecast data used here are taken from the Federal Reserve Bank of Philadelphia’s Survey of Professional Forecasters.
The NGDP gap measures the percentage difference between this average forecast and the actual level of NGDP. If actual NGDP is significantly less than the neutral level, then monetary conditions are contractionary. If actual NGDP is significantly greater than the neutral level, then monetary conditions are expansionary.
The rationale for this understanding is twofold. First, members of the public make many economic decisions, such as whether to take out a mortgage or a car loan, on the basis of forecasts of their nominal income. Similarly, firms may finance with debt and commit to multiyear contracts on plants, raw materials, and labor on the basis of forecasts of their nominal income. Second, actual nominal incomes may turn out to be very different from what are expected and, as a result, may be disruptive for households and firms that are not able to quickly adjust their economic plans. These disruptions can be avoided by maintaining total nominal income or NGDP on the growth path expected by the public. In other words, the Federal Reserve should aim to close the NGDP gap in order to keep monetary conditions neutral.
To ensure robustness, I create a data series using real-time NGDP data (which are revised later). This series is called the vintage NGDP gap, and it contains initial-release NGDP data for each quarter that can be used to construct an NGDP gap. In other words, it shows the NGDP gap policymakers would have seen in real time, given the initial NGDP data. In addition, I create a second version of the NGDP gap, the Blue Chip NGDP gap, using the Blue Chip Economic Indicators instead of the Survey of Professional Forecasters. This measure provides a cross-check on the use of the latter source as a main indicator. Both the vintage NGDP gap and the Blue Chip NGDP gap can be downloaded from the NGDP gap web page hosted by the Mercatus Center.
For more information on how the NGDP gap is constructed and how it may be used to understand policy, please see “The Stance of Monetary Policy: The NGDP Gap,” a policy brief by David Beckworth.