Introduction
By most of the important measures—the kind that fill tables and text in the annual Economic Report of the President—the US economy is on a roll. The first estimate for Q3 2018 GDP growth came in with an annual rate of 3.5 percent—not as good as Q2’s 4.2 percent, but a lot better than 2017’s 2.8 percent growth for the year.[i] The unemployment rate is reaching record lows; construction activity, while weakening, is still high. Perhaps more importantly, total workplace earnings, including bonuses and fringe benefits, are on the rise. As an overall assessment of personal prosperity, real per capita GDP is also increasing. Put another way, on average, US workers and families are becoming better off.
In fact, some commentators are saying we have a Goldilocks economy where everything is just right. We must remember the rest of the story, though: when the three bears returned, and Goldilocks had to escape. Can we hear some distant growls? There is growing evidence that rising uncertainty regarding trade, interest rates, and other government policies is making managers and owners of businesses hesitate and review the situation before making major new job-creating investments. Keep in mind, it is hesitation in a high-growth economy. What might this say about the prospects for another recession?
This report will address the recession question but will first focus on the hesitating economy. The next section provides some supporting evidence along with a few anecdotes that explain how trade policy uncertainty interrupts plans to hire workers and expand manufacturing plants. Using labor market data, the next section examines the recession question. According to the data, the economy is definitely operating at a high level, and fortunately nothing in the data path presented in the section resembles a recessionary prospect. The section that follows takes a fresh look at how the Trump trade wars are generating a little-discussed facet of growing regulation that involves the granting of favors to trade-regulated firms. After that, a spotlight is placed on Hawaii for this quarter’s state analysis. The report ends with a visit to Yandle’s Reading Table and discusses three books that may be worth reading. Before moving to the next section, I offer projections for the 2019 economy in table 1.
Table 1. Dr. Bruce Yandle’s 2019 Economic Projections
| 2019 Projected (percent) | 2018 Recent Value (percent) | |
| GDP Growth | 3.1 | 3.5 |
| CPI | 3.2 | 2.9 |
| Unemployment | 3.6 | 3.7 |
| 90-Day Bill | 3.0 | 2.1 |
| 10-Year Note | 3.6 | 3.2 |
| 30-Year Mortgage | 5.5 | 4.9 |
Sources: For all of the 2018 recent values except the 90-day bill, see Wells Fargo Securities Economics Group, Weekly Economic & Financial Commentary, November 21, 2018, https://www08.wellsfargomedia.com/assets/pdf/commercial/insights/econom…. For the 90-day bill recent value, see Wells Fargo Securities Economics Group, Monthly Economic Outlook, November 7, 2018,Note: Estimates are current as of November 21, 2018.
https://www08.wellsfargomedia.com/assets/pdf/commercial/insights/econom….
As indicated, I expect little change in GDP growth, a bit higher inflation, slightly tighter employment markets, and higher interest rates. All-in-all, I offer a rather unexciting projection, which, if it comes to pass, may be something to celebrate.
The Hesitating Economy
Is the high-growth economy hesitating? Why hesitation, and what’s the evidence?[ii]
Consider this: there are unstable oil prices, generated partly by US restrictions on the shipment of Iranian oil; higher interest rates with the Fed promising more of the same; and growing uncertainty with regard to ratification of the recently negotiated US-Mexico-Canada trade agreement. Then, there are continuing belligerent trade conversations between White House officials and Chinese leadership and on-again, off-again Trump administration commitments to befriend North Korea. These make up major ingredients of the uncertainty soup that private decision makers are trying to understand. Occurrence of any number of these could be enough to cause some firms to hesitate in their plans for expanding operations and markets. All of them together could take the wind out of the economy’s high-flying sails. In the following section, I look closely at trade policy, which is the more troublesome part of the economic uncertainty puzzle.
What about the evidence?
In a recent study, University of Chicago economist Steven J. Davis reported an uncertainty index for Japan and the United States he developed based on the occurrence of key words, such as “trade policy uncertainty,” in international newspapers.[iii] Davis examined the patterns that resulted and labeled some of them. His chart is reported here.
Figure 1. Trade Policy Uncertainty
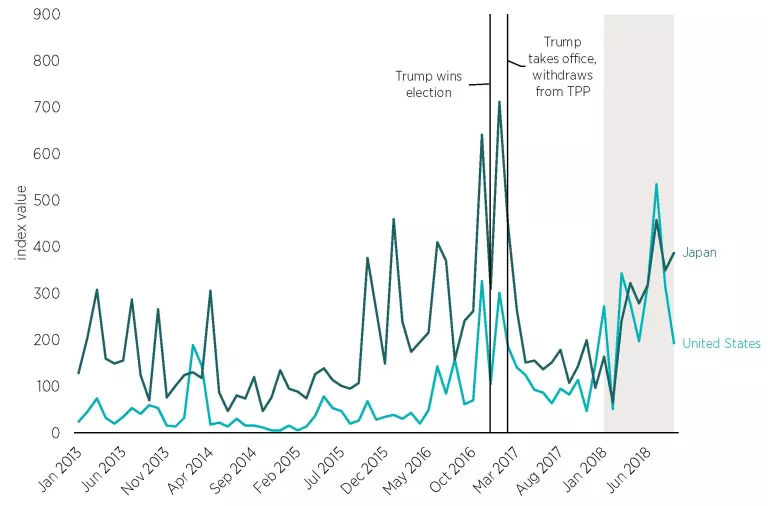
Note: TPP = Trans Pacific Partnership. The shaded period represents when President Trump announced tariff hikes; and when trade policy tensions intensified, especially between the United States and China.
Sources: US Data: Scott R. Baker, Nicholas Bloom, and Steven J. Davis, “Measuring Economic Policy Uncertainty,” Quarterly Journal of Economics 131, no. 4 (2016): 1539–1636; Japan Data: Elif C. Arbatli, Steven J. Davis, Arata Ito, Naoko Miake, and Ikuo Saito, “Policy Uncertainty in Japan” (NBER Working Paper No. 23411, National Bureau of Economic Research, Cambridge, MA, May 2017). All data were downloaded from policyuncertainty.com.
The chart shows the two indices spiking with President Trump’s unexpected election to office and his associated promise to remove the United States from the Trans-Pacific Partnership trade agreement. A second series of spikes is seen with the 2018 start of the current trade wars.
As Davis suggests, charts are nice, but does the pattern tell us anything about decisions to expand businesses? Do executives hesitate when uncertainty rises? To answer this question, Davis cites a recent Federal Reserve Bank of Atlanta survey of 330 business executives that asked, “Have the recently announced tariff hikes or concerns about retaliation caused your firm to re-assess its capital expenditure plans?”[iv] About one-fifth of the respondents said, “Yes.” A similar Reuters survey of Japanese manufacturing firms discussed by Davis asked about postponed investment plans. Of the 253 responding firms, 24 percent indicated they were postponing or reassessing major investment plans.
Uncertainty regarding trade and established sources of supply causes managers of US manufacturing plants to postpone pending expansion plans and then to devote their time to finding suppliers not subject to tariffs. The requirements of the new US-Mexico-Canada trade agreement, yet to be ratified by Congress, are that automobile manufacturers source at least 70 percent of their steel and aluminum from within the three countries or pay a 2.5 percent tariff on noncomplying products. While a final determination is yet to be made, this may mean that Mercedes-Benz and BMW, which currently import engines from Germany, may have to move engine production to North America. If so, that would lead to an increase in manufacturing activity in the region, but also to higher costs, leading to higher prices and potential assembly plant layoffs.
A reverse example is seen in the case of Kent International, Inc., a South Carolina bicycle producer with an assembly plant employing 167 workers.[v] Before the outbreak of the US-China trade war, Kent’s principal owner, Arnold Kamler, had expansion plans in the works. His firm was going to import steel tubes from China and use the tubes to form bicycle frames. Then the tariffs hit. Kamler explains, “When we started getting winds of tariffs and were confident cut tubes would be subject to tariffs, we stopped.”[vi] Kamler indicated that he traveled to the Philippines and Taiwan to find tariff-free sources for tubing. “We are not bringing jobs back to America with this thing. We are bringing jobs to different countries in Southeast Asia.”[vii] The Kent, Mercedes-Benz, and BMW stories illustrate how new search costs result from the tariff war, and how the already-scarce time of top managers is diverted to dealing with a new, politically determined cost. Those costs explode when the number of tariff-affected firms increases.
There is another unobserved cost associated with imposing tariffs. As illustrated in the South Carolina bicycle plant story, top management is diverted from the projects it would have been working on to dealing with revisions in plans and perhaps interacting with political leaders as it negotiates the fallout from the tariffs. Since May—when the Trump steel and aluminum tariffs were announced—the US Department of Commerce, which administers the associated regulations, has received more than 35,000 petitions from firms seeking exemptions from steel and aluminum tariffs.[viii] What if, on average, preparing the petitions took just 8 hours? That would amount to 280,000 hours or 7,000 weeks of management time, all in an effort to recover a now-blocked production relationship. This does not bode well for productivity improvement. Only a successful petition will allow a firm to recover the position occupied prior to the advent of higher tariffs (that is, to return to square one, after expending substantial resources).
When operators of US manufacturing plants face uncertainty, they also turn to temporary workers when contracting for additional labor instead of making permanent hires. The most recent Bureau of Labor Statistics (BLS) employment data show the rate of growth of manufacturing employment falling and—you guessed it—the rate of growth for temporary contract worker employment rising, each by almost equal amounts.[ix]
When labor markets are tight and productivity is rising, employers tend to raise wages in order to attract and keep workers. But when uncertainty enters the picture, the same employers go with bonuses, vacation time, use of company vehicles, and other fringe benefits—things they can turn off and on—rather than raising wages. Recent BLS survey data indicate this is happening.[x]
Does this mean we are seeing the high point of the current long-lived expansion? Maybe. Or does this mean it’s time for Washington decision makers to pause in their constant efforts to disrupt major policies and to give the economy a chance to take a deep breath?
Why risk another recession when it can be avoided?
What Do Labor Markets Say?
Just how strong is the economy, and is there room in the tight labor markets for some more growth? The labor market distributions spider charts maintained by the Federal Reserve Bank of Atlanta provide an in-depth composite view of patterns formed by 15 labor market variables. Placed into five categories—employer behavior, confidence/perceptions, utilization, wages, and flows—the values attained quarterly by the 15 variables can be compared with their earlier counterparts. To illustrate, I provide the spider chart that shows the pattern formed by comparing October 2018 data with those of December 2016 (see figure 2). Visual inspection of the chart tells us which of the five variable categories has improved most across the 22-month period and accordingly helps us assess the current strength of the overall economy.
Figure 2. Labor Market Distributions Spider Chart
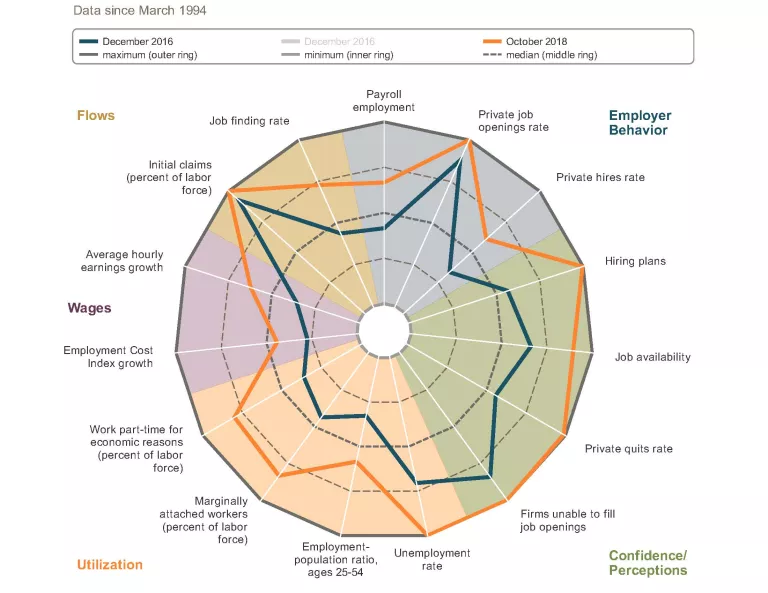
Source: Federal Reserve Bank of Atlanta, “Labor Market Distributions Spider Chart,” November 6, 2018, https://www.frbatlanta.org/chcs/labor-market-distributions.aspx?panel=1.
Employer behavior and confidence/perceptions stand out for their relative strength. Buried in the categories are hiring plans, availability of labor, and future planned hiring. The chart patterns suggest that the economy’s post-2016 expansion is broadly based and that the current pace of growth is expected to continue, but that labor-supply constraints are beginning to be felt. The chart does not support the notion that what we are experiencing in terms of GDP growth is a flash in the pan.
Another view of the economy’s current strength is found in two indexes reported by the Federal Reserve Bank of Kansas City. One index seeks to describe the strength of the current economy; the other the momentum observed in the economy’s performance. The bank economists use 12 variables for each of the two measures. All of these are labor market variables. Figure 3 reports the two indexes for January 1992 through August 2018. Note that there are two recessions identified during this period. Also note how the two indexes performed as they approach the recessionary periods and how this compares with the current period.
Figure 3. KC Labor Market Conditions Indexes
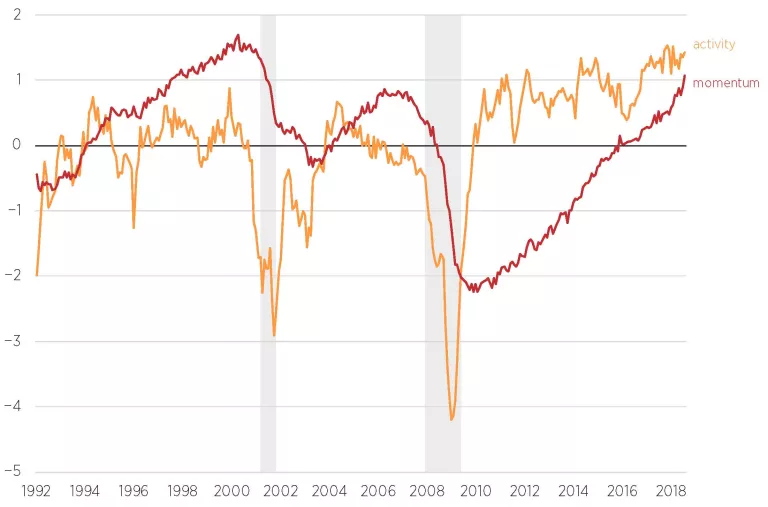
Note: Shaded periods indicate recessions.
Sources: Federal Reserve Bank of St. Louis, “KC Fed Labor Market Conditions Index, Momentum Indicator,” accessed November 4, https://fred.stlouisfed.org/series/FRBKCLMCIM; Federal Reserve Bank of St. Louis, “KC Fed Labor Market Conditions Index, Level of Activity Indicator,” accessed November 4, https://fred.stlouisfed.org/series/FRBKCLMCILA.
The Kansas City data tell us that we are experiencing a robust growth period, one that is sustained by strong economic momentum; there are no indications from these two indexes that a recession lies waiting. Put another way, the Kansas City chart confirms the picture reported in the Federal Reserve Bank of Atlanta’s spider chart.
Trump’s New Full Economy Regulation
Corporate tax cuts and sharp reductions in federal regulation are main GDP growth drivers.[xi] Those who wanted less federal regulation have a lot to celebrate—maybe. White House leadership has seemingly put the brakes on runaway regulation. The number of Federal Register pages issued annually has fallen significantly, and the number of newly proposed “economically significant” rules (that is, rules with a potential effect on the economy in excess of $100 million) has dropped toward zero. Regulatory cuts have sharply revised the Environmental Protection Agency’s treatment of coal-burning electricity producers and lightened the regulatory load carried by community banks and other financial institutions. But alas, the story doesn’t end there. Trade war regulation that cuts deeply into the economy is the new regulation growth industry. As mentioned previously, firms and sectors are now petitioning Washington by the thousands for permission to avoid tariffs and stay in business.
When President Trump placed tariffs on steel and aluminum imports this past May, due process considerations required the US Department of Commerce to announce the related rules and allow firms, based on special circumstances and economic hardship, to request waivers to escape the tariffs. The due process rules allow American aluminum and steel producers to intervene when petitioners ask for relief and, if they desire, show that they, the domestic producers, can supply the needs of the petitioning firms—but, of course, at a higher price. Thus far, American steel producers Nucor and United States Steel have successfully blocked all 1,600 requests for waivers on steel tariffs. On the other hand, some US aluminum producers requested waivers on aluminum tariffs so they could continue to bring in aluminum produced in their Canadian plants, tariff free.[xii]
The tariff rulemaking procedures put in place a regulatory process that now envelops all American business firms that use or produce steel and aluminum products, and that cuts a large swath across the economy. Of course, steel and aluminum are just the beginning. Trump tariff expansion now applies to thousands of imported products from China.[xiii] Yes, the number of Federal Register pages may be falling, and pre-Trump-administration measures of major regulatory activity may be in a state of decline, but make no mistake about what is really going on. The US economy is now beset by growing industry regulation administered by the Department of Commerce, the new regulatory czar.
While in the process of becoming less regulated, the US economy was hijacked by growing trade-war-generated regulation. Let’s hope the Trump trade war is short lived.
Hawaii in The State Spotlight
Patrick A. McLaughlin
Senior Research Fellow, Director of Policy Analytics
Mercatus Center at George Mason University
Stephen Strosko
Program Coordinator and Python Developer
Mercatus Center at George Mason University
Each quarter, we select one state and assess that state’s economic outlook and health. Last quarter, we put Illinois in the spotlight. In previous quarters, we have examined Colorado, Kentucky, Michigan, North Carolina, Oregon, and Utah. We focus on Hawaii this quarter.
Hawaii’s Strong Economy
Hawaii’s economy appears to be set up well for the near future. Unsurprisingly, two industries that are relatively larger in the state of Hawaii than in other states are the tourism industry and the defense (military) industry. The two industries account respectively for 27.3 percent and 9.8 percent of Hawaii’s GDP.[xiv] Consider tourism, the larger of the two. According to the Department of Business, Economic Development & Tourism (DEBDT), Hawaii is projected to have increases in both the number of tourists as well as the average expenditures of tourists from 2019 to 2021.[xv] However, it should be noted that these increases are projected to be decreases in percent terms over the growth rates observed in 2016 and 2017.
The Economic Research Organization at the University of Hawaii (UHERO) draws similar conclusions. UHERO states that even though 2018 is looking to be a strong year for Hawaii’s tourism sector, multiple natural disasters including the recent volcanic eruptions and flooding will have a significant impact on Hawaii’s tourism sector in the near future.[xvi] These factors all suggest an overall cautious optimism toward Hawaii’s tourism sector with an expected short-term decrease in percent growth.
The military sector is of high importance to Hawaii and is the second-largest sector in the state’s economy. As mentioned, the sector generates 9.8 percent of the state’s GDP and employed over 64,000 individuals in 2015.[xvii] Hawaii’s defense sector is largely based on the national defense budget, which has increased every year since 2013. Projected defense budget spending is also showing increases through at least the year 2020.[xviii] Hawaii contains some of the most important US military bases in the Pacific region. Therefore, military policy that affects the Pacific will also have a large influence on Hawaii’s economy. As countries like China, South Korea, Japan, and Indonesia continue to have growing economies and international influence, it is hard to imagine the Pacific becoming less of a priority for the United States in the near future. Overall, there is no reason to believe that the military sector will show any decline in Hawaii.
Employment statistics in Hawaii paint an optimistic picture for the state’s economy. Hawaii’s unemployment rate has steadily declined since the recession in 2009 and now hovers around an even 2.0 percent.[xix] This actually ranks Hawaii as the state with most employed labor force across the entire United States, which currently has an overall unemployment rate of 3.7 percent. Recent months have shown a slight uptick in the unemployment rate for Hawaii (2.2 percent instead of 2.0 percent), which may also be attributable to some of the recent natural disasters and does not appear to be a long-term trend at this point.
Hawaii’s per capita personal income stood at $52,787 in 2017.[xx] This marks eight consecutive years of per capita personal income growth for the state. A 3.7 percent increase between 2016 and 2017 sits well above the national average of 3.1 percent. These per capita income numbers rank Hawaii toward the top of the list of states. However, residents of Hawaii may not feel as lucky as one might think. The state had the highest cost of living of all 50 states and Washington, DC, as of Q2 2018.[xxi] In addition, the urban area of Honolulu, Hawaii, has a per capita real GDP of $58,525, which lags significantly behind other metropolitan areas that have equally high costs of living like Washington, DC, at $74,000 and San Francisco, at $89,978.[xxii]
Hawaii has mixed reviews with regard to fiscal health. Since 2004, Hawaii has had a credit rating of AA+, only one level away from the highest rating.[xxiii] However, this credit rating may be in danger of declining owing to some underlying poor trends in Hawaii’s fiscal health. The state currently has the 13th highest per capita debt at $10,137.[xxiv] In addition, the Mercatus Center’s state fiscal health rankings place Hawaii 38th out of the 50 states. The state fiscal rankings capture the fiscal health of every state by examining debt, obligations, solvency, healthcare benefits, and other financial indicators.[xxv] The fiscal rankings identify Hawaii’s long-term liabilities as a point of concern, as they are at 84 percent of total assets, or $12,056 per capita.
From an education standpoint, Hawaii seems to be lagging a little bit behind. As of 2016, the state has a high school graduation rate of 82.7 percent, which sits right below the national average of 84.1 percent. This rate is the culmination of a rather mediocre 3 percent increase that has been going on since 2010, whereas the national average growth rate is 5 percent.[xxvi] Hawaii does have a strong concentration of individuals with bachelor’s degrees or higher. Currently, 31.4 percent of individuals who are 25 or older in Hawaii have bachelor’s degrees (or higher), and 3.7 percent have an advanced degree such as a PhD. These statistics are just slightly higher than the national average of 30.3 percent and 3.3 percent, respectively.[xxvii]
Hawaii’s Regulatory Outlook
Hawaii’s regulatory code is published under the “Administrative Rules” section on Hawaii.gov.[xxviii] The state’s code is made up of 23 separate titles that each map to a different department, office, or the University of Hawaii. As of October 2018, the RegData project at the Mercatus Center has not quantified Hawaii’s regulatory code. This is mostly owing to lack of organization surrounding Hawaii’s code, which is more pronounced than that of any other state observed to date.
The aforementioned website that hosts Hawaii’s regulatory code is actually just a webpage that has links to different departments. When users click on these links, they gets sent to a department page that supposedly lists all of the regulations for that department. Each department has a unique website, and each department structures its title of the state regulatory code differently. This variation in code structure makes it extremely difficult to quantify Hawaii’s regulatory code in any way, and it is definitely unusual when compared to other states.
If Hawaii’s regulations were to be quantified using RegData, it would be interesting to see how many regulatory restrictions (terms such as shall, must, may not, required, and prohibited) are relevant to some of Hawaii’s most important industries, such as tourism and construction. For tourism, some interesting sectors to examine would be NAICS code 483112 (deep sea passenger transportation), 487110 (scenic and sightseeing transportation, land), 561510 (travel agencies), and 721110 (hotels). For the construction sector, NAICS code 236 (construction of buildings) would also be interesting to examine.
Even though Hawaii’s regulatory code is not quantified, RegData has successfully quantified the US Code of Federal Regulations and can shed some light on the sectors that are most regulated by the federal code in Hawaii relative to other states. Calculated using RegData metrics, a state’s FRASE score measures the burden of federal regulations on a state’s economy relative to other states.[xxix] Hawaii ranks 34th out of all 50 states and the District of Columbia by the FRASE score metric, meaning that Hawaii is less affected by federal regulation relative to other states. The highest contributor to Hawaii’s FRASE score is the Federal Aviation Administration through the air transportation sector. This sector alone accounts for over 25 percent of Hawaii’s FRASE score. However, we note that the Jones Act’s requirement that goods shipped to and from Hawaii be carried on American-flagged ships, which raises Hawaii’s cost of living, is a meaningful regulation not counted in the FRASE score.
Conclusion
Hawaii’s economy has both strong and weak characteristics. Education statistics, employment statistics, and stable industry sector growth give reasons for optimism, whereas per capita income relative to the cost of living as well as an ambiguous regulatory code could be signs for concern. The leading indicator published by the Philadelphia Federal Reserve Bank predicts the success of a state’s economy over the next six months. Hawaii’s August 2018 indicator is 1.11, a slightly below-average number.[xxx] The New Economy Index produced by the Information Technology and Innovation Foundation provides a broader assessment. Its most recent report shows that Hawaii ranks 40th out of all of the states with respect to knowledge jobs, economic dynamism, globalization, digital economy, and innovation capacity.[xxxi] This index would suggest that Hawaii is not set up well for the future, at least in the aforementioned areas.
Yandle’s Reading Table
If one is in the mood for an inspiring as well as entertaining read, it would be hard to do better than Eric Motley’s memoir Madison Park (New York: HarperCollins, 2018). Motley earned a PhD from the University of St Andrews, served in the George W. Bush White House, and is now executive vice president of Washington’s Aspen Institute. He was reared by his grandparents in Madison Park, AL. Madison Park is a small community formed originally by freed slaves who purchased some 500 acres of land and staked out a community near Montgomery, AL. As Motley describes Madison Park, it fits closely to Nobel laureate James Buchanan’s moral community definition, which is to say, the community is formed by people who have an abiding faith in God and who are accordingly committed to each other’s well-being.
Obviously an unusually gifted child, Motley had the good fortune of being reared by two unusually gifted grandparents. He tells how, early on, he became identified as a community DUK (a Designated University Kid). All of Madison Park became involved in assuring his success. An example of this is found in his chapter on turtles and rabbits, labels that were attached in the first grade to slow and fast readers. Always facing demand and support for high academic performance, Motley thought his world would fall apart when he was moved from the rabbit to the turtle reading group. His devastated grandparents announced the bad news in church, and the church responded when five retired schoolteachers took it upon themselves to set up weekly tutoring sessions. Motley was soon a recovering rabbit, and the five teachers expanded their sessions to include mathematics, history, and other subjects.
As one who rose from abject poverty to become part of America’s top-tier echelon, Motley’s story is very reminiscent of J. D. Vance’s Hillbilly Elegy. Grandparents played a crucial role in both stories. But in Motley’s case, it was the larger community that continuously provided guidance, inspiration, and the material sustenance that supported his success. This support went beyond the limits of Madison Park to include the white family that employed Motley’s grandmother as a housekeeper. That family supplied Motley with record albums of classical music and opera as well as heavier-than-usual reading material. As economist James Buchanan has noted, finding and keeping order is the first economic challenge to be satisfied by human communities. Motley’s Madison Park story provides a sterling example of how that was done near Montgomery, AL.
Writer Stephen Johnson is widely recognized for taking an unexpectedly fresh approach to topics that interest him. His 2018 book, Farsighted: How We Make the Decisions That Matter the Most (New York: Riverhead Books, 2018), adds to this well-deserved reputation. As suggested by the title, the book is about decision-making, but it is definitely not about decision science, though it brushes against that topic from time to time. Instead, Johnson focuses on the hard, complex decisions that are so rich with subtleties and longer-run effects that it is impossible for the average person to reach a decision by simply jotting down the pros and cons of the matter or somehow using a complex benefit-cost analysis to get to the right answer. He recognizes that Homo sapiens’s ability to make these hard decisions ranks high for the species along with our “technological innovation and gift of language.”[xxxii]
To catch the reader’s interest in his topic, Johnson tells about Charles Darwin’s two-column—pro and con—approach for determining whether or not to marry Emma Wedgwood. When Darwin reconciled the balance, the “get married” side won. It should be noted that he implicitly weighted the elements of his analysis; it was not just a matter of totaling the pluses and minuses. Johnson then explores really tough decisions, such as the CIA decision to attack Osama bin Laden’s Afghanistan complex. He takes that case to illustrate a three-step approach where groups of individuals engage in free-thinking solutions—a push for diversity—and then move toward consensus and acceptance of a final plan. Johnson’s description of the process reminds me of the old saying for committee action: “storming, norming, and performing.” Somehow, it is useful to get wild ideas out on the table; they may turn out not to be so wild after all.
After providing a framework for thinking about hard decisions, Johnson carries the reader to applications that illustrate key points. Once again, Charles Darwin enters the discussion. This time, Darwin is trying to decide about publishing the treatise that became On the Origin of Species, which contained findings that he assembled over a 10-year period. Doing so, he reasoned, would raise questions about God’s existence and grace, a topic that was crucially important in his own household following the 1851 tragic death of his 10-year-old daughter and now her understandably deeply troubled mother. Indeed, his theory, which when published he believed would set his name among the world’s leading scientists, could lead to his being drummed out of the church. Emma Wedgwood had found solace in her religious faith; Darwin did not want to disturb her. After wrestling with the difficult decision, he decided to wait two years before publishing his theory. This story illustrates some of the critical subtleties that Johnson attempts to describe in his treatment of difficult decision-making.
Johnson is convincing (and convinced) that more attention should be paid to the study of complex decision-making by students in high school as well as other grade levels. He is not necessarily pushing for more abstract mathematical studies, though that might be included in such a course, but he does call for fresh interpretations of novels and other stories that help readers visualize the complexities human beings must deal with when making decisions. He argues that although numerous important topics are taught to young people, “you will almost never see a course devoted to the art and science of decision-making, despite the fact that the ability to make informed and creative decisions is a skill that applies to every aspect of our lives.”[xxxiii] Johnson has given us an entertaining and challenging book that is well worth reading.
Anyone shopping recently for Halloween candy had to be impressed with the rich array of chocolate choices. Stacked neatly in fresh-from-the-factory, orange shelved cartons were multiple flavors of M&M’S, Snickers, Hershey’s bars of all descriptions, as well as Mars, Milky Ways, Mr. Goodbars, Kit Kats, and Reese’s Peanut Butter Cups, just to name a few. The offerings provided by the competing corporate giants, Mars, Inc., and Hershey, Inc., gave full assurance that chocolate-loving Americans would be satisfied. But as we crunch away on the wonderful sweets, few if any can be aware of the long and complicated story that lies behind the two companies. Mars is privately held and secretive, and Hershey is utopian in origin and dedicated to the support of the world’s richest orphanage, specifically, and Hershey, PA, generally. Even more complicated is the development of milk chocolate itself.
If you are like me, you probably thought that making chocolate was simply a process of grinding up cocoa beans, adding milk and sugar, and doing something special with the resulting paste. If that’s your take on the matter, you are wrong. You may have guessed that Milton Hershey is recognized as the US originator of milk chocolate for mass markets, but you would have never guessed that Hershey was the supplier of the chocolate coating for Mars’s original Milky Way and Snickers or that one of the Ms in M&M’s stands for R. Bruce Murrie, the son of Hershey’s long-time president. (The other M? You guessed it. Mars!) Mars eventually produced its own chocolate and got to be neck-and-neck with Hershey—and ultimately outdid Hershey—in chocolate candy production.
Joël Glenn Brenner tells about this and a lot more in her amazing book The Emperors of Chocolate: Inside the Secret World of Hershey and Mars (New York: Random House, 1999). Yes, the book has been around a while, but I just got my hands on it. The stories of the two firms are as different as the personalities of the strong-minded individuals who founded them.
Born in 1857 and reared in a poor and unhappy Lancaster, PA, home, Milton Hershey went to work as an apprentice in a Lancaster candy shop when he was 15. Four years later, he opened his own taffy shop, which soon failed. After a series of other pursuits, Hershey set up a caramel business in New York, stumbled into a lucky contract to sell candies in London, and then, back in Lancaster, successfully grew Lancaster Caramel Company. He also acquired factories in Chicago, IL, and Reading, PA.
By 1890, he was fabulously wealthy, married, living in a Lancaster mansion; and with 1,500 employees, Hershey put the business in the hands of key employees and set out to travel the world. Never interested in business per se, engineering, or management, Hershey was just nuts about making candy, always trying new recipes, totally devoted to trial and error. He was never concerned about chemistry and the science of cooking. He knew what he liked, and as it turned out, his customers had similar tastes.
Milk chocolate entered his life in 1893 at the Columbian Exposition in Chicago where he saw a miniature German chocolate factory at work. Hershey bought the operating display, formed Hershey Chocolate Company, and from then on passionately devoted his life to the development of milk chocolate products and to the benevolences he funded with his profits. He made Hershey, PA, his utopia, funding schools, parks, streets, and a famous boys’ orphanage—which ultimately, by his action, became the recipient of the bulk of Hershey’s net profits. Along the way, World Wars I and II and US Army demand for chocolate candy rations gave Hershey bars an almost universal market.
By comparison, Frank Mars, who might be thought of as the patriarch of the company bearing his name, was born into humble circumstances in 1883; as a youth he contracted polio and from that point was permanently disabled. Instead of playing stickball and other games outdoors, Mars stayed in the kitchen with his mother and watched her perform wonders as she made divinity, taffy, and caramel. Unlike Hershey, Mars learned that cooking is a science—an exact science at that. When he was 26, married, and with a son named Forrest (who would become Mars’s true founder), Mars was selling penny candy. Unfortunately, Frank’s business failed, as did his marriage. Still, he pursued candy making, ultimately with some real success. It was a later father-son reunion that led to Mars’s first candy bar, the Milky Way, which was the equivalent of a malted milk shake in bar form and coated with chocolate purchased from Hershey. From there, Mars made its way into becoming a world-force chocolate candy producer.
Where Hershey, as recently as the 1960s, had no idea how to replicate its chocolate recipe when building new plants and did not keep data on market share, consumer preferences, or wholesaler preferences, Mars operated like a Big Four accounting firm. Ultimately, Forrest Mars’s two sons took over the enterprise (with fanatical attention to every detail, even to the point of making certain that there were always 15 peanuts—no more or less—in a Snickers candy bar). Where Hershey was experimental and, at times, strapped by the responsibility to fund the Hershey orphanage, Mars was streamlined, efficient, and highly profitable.
Today, both firms have successfully diversified their lines but are still dedicated to catering to the world’s sweet tooth. I recommend you buy a bag of Reese’s Pieces or M&M’S and enjoy nibbling while reading Bren
[i] Bureau of Economic Analysis, “Gross Domestic Product, 3rd Quarter 2018 (advance estimate),” news release no. BEA 18-56, October 26, 2018, https://www.bea.gov/news/2018/gross-domestic-product-3rd-quarter-2018-a….
[ii] This section is based on Bruce Yandle, “The High-Growth Economy Hesitates,” Washington Examiner, October 3, 2018.
[iii] Steven J. Davis, “Trump’s Trade Policy Uncertainty Deters Investment,” EconBrowser, August 12, 2018.
[iv] Davis, “Trump’s Trade Policy Uncertainty.”
[v] Ruth Simon, “Tariffs Hit Those Trump Wants to Help: U.S. Factories,” Wall Street Journal, October 15, 2018.
[vi] Simon, “Tariffs Hit Those Trump Wants to Help.”
[vii] Simon.
[viii] Christine McDaniel and Danielle Parks, “Steel and Aluminum Tariffs: Thousands of Exclusion Requests from US Firms,” QuantGov, November 1, 2018, https://quantgov.org/tariff-exclusion/.
[ix] Federal Reserve Bank of St. Louis, “All Employees: Professional and Business Service: Management of Companies and Enterprises,” accessed November 26, 2018, https://fred.stlouisfed.org/series/CEU6055000001.
[x] Bureau of Labor Statistics, “Employer Costs for Employee Compensation News Release Text,” news release no. USDL–18–1499, https://www.bls.gov/news.release/ecec.nr0.htm.
[xi] This section is based on Bruce Yandle, “Is Trump Downsizing or Redirecting Regulation with Tariffs?,” Investor’s Business Daily, October 3, 2018.
[xii] Chris Sanders, “UPDATE 1-Alcoa Asks U.S. Government for Tariff Exemption on Canadian Aluminum,” CNBC, August 6, 2018.
[xiii] Chuin-Wei Yap, “U.S. Reliance on Obscure Imports from China Points to Strategic Vulnerability,” Wall Street Journal, September 24, 2018.
[xiv] Katie Murar, “Hawii Tourism Industry Sets Record for Sixth Consecutive Year,” Pacific Business News, January 31, 2018; Hawaii Defense Economy, home page, accessed November 26, 2018, http://hawaiidefenseeconomy.org.
[xv] Hawaii Department of Business, Economic Development & Tourism, “Outlook for the Economy: 4th Quarter 2018 Report,” accessed November 26, 2018, http://dbedt.hawaii.gov/economic/qser/outlook-economy/.
[xvi] UHERO (Economic Research Organization at the University of Hawai‘i), Hawaii’s Growth Down, but Not Out: UHERO State Forecast Update, Public Edition, September 21, 2018.
[xvii] Hawaii Defense Economy, home page, accessed November 26, 2018, http://hawaiidefenseeconomy.org.
[xviii] USGovernmentSpending.com, “Defense Spending,” accessed November 26, 2018, https://www.usgovernmentspending.com/defense_spending.
[xix] Bureau of Labor Statistics, “Local Area Unemployment Statistics,” accessed November 26, 2018, https://data.bls.gov/timeseries/LASST150000000000004?amp%253bdata_tool=….
[xx] Federal Reserve Bank of St. Louis, “Release Tables: Per Capita Personal Income by State, Annual,” accessed November 26, 2018, https://fred.stlouisfed.org/release/tables?rid=151&eid=257197.
[xxi] Missouri Economic Research and Information Center, “Cost of Living Data Series: Third Quarter 2018,” accessed November 26, 2018, https://www.missourieconomy.org/indicators/cost_of_living/index.stm.
[xxii] Statista, “Per Capita Real Gross Domestic Product (GDP) of the United States in 2017, by Metropolitan Area (in Chained 2009 U.S. Dollars), accessed November 26, 2018, https://www.statista.com/statistics/248112/per-capita-us-real-gross-dom….
[xxiii] Ballotpedia, “State Credit Rankings,” accessed November 26, 2018, https://ballotpedia.org/State_credit_ratings.
[xxiv] Jared Walczak, “Where Does Your State Stand on State & Local Debt Per Capita?,” Tax Foundation, September 10, 2015.
[xxv] Eileen Norcross and Olivia Gonzalez, “Ranking the States by Fiscal Condition, 2018 Edition” (Mercatus Research, Mercatus Center at George Mason University, Arlington, VA, 2018).
[xxvi] Education Week, “Data: U.S. Graduation Rates by State and Student Demographics,” December 7, 2017, https://www.edweek.org/ew/section/multimedia/data-us-graduation-rates-b….
[xxvii] Statistical Atlas, “Educational Attainment in the United States,” accessed November 26, 2018, https://statisticalatlas.com/United-States/Educational-Attainment#figur…, tables 50, 51.
[xxviii] Lt. Governor of the State of Hawai‘i, “Administrative Rules,” accessed November 26, 2018, http://ltgov.hawaii.gov/the-office/administrative-rules/.
[xxix] QuantGov, “Illinois,” accessed November 26, 2018, https://quantgov.org/50states/illinois/.
[xxx] Federal Reserve Bank of Philadelphia, “State Leading Indexes,” November 5, 2018, https://www.philadelphiafed.org/research-and-data/regional-economy/inde….
[xxxi] Robert D. Atkinson and J. John Wu, The 2017 State New Economy Index: Benchmarking Economic Transformation in the States (Washington, DC: Information Technology & Innovation Foundation, 2017).
[xxxii] Stephen Johnson, Farsighted: How We Make the Decisions That Matter the Most (New York: Riverhead Books, 2018), 7.
[xxxiii] Johnson, Farsighted, 13.
Related Content
- | Expert Commentary Expert Commentary
The Economic Situation, September 2018

- | Regulation Regulation
- | Policy Briefs Policy Briefs
The Economic Situation, December 2017
- | Regulation Regulation
- | Policy Briefs Policy Briefs
The Economic Situation, September 2017
- | Policy Briefs Policy Briefs

