- | Regulation Regulation
- | Policy Briefs Policy Briefs
- |
The Economic Situation, March 2018
A Quarterly Commentary on the Economy
The Growth Platform
With 2018 well under way, with investors licking their wounds from a better than 10 percent correction in stock market prices, and with soothsayers polishing their crystal balls for 2019 forecasts, it’s time to examine key elements in the economy’s growth platform and see how they look for ongoing economic performance. But first, I wish to emphasize that, in spite of stock market volatility, the real economy seems to be well grounded. Consider the GDP reckoning for 2017 and 2018’s first quarter. The late-January tally for US 2017 real GDP growth, subject to later revision, was 2.5 percent; this compares with 2016’s 1.6 percent and 2015’s 2.9 percent. For half of 2017 we continued to see a sleepwalking economy, but a series of stronger end-of-year quarterly GDP numbers lifted the annual average. The momentum built toward the end of 2017, and optimistic assumptions about the positive effects of tax cuts and regulatory reform may justify up to a 3.0 percent growth forecast for 2018. But that may be reaching a bit too far.
Early 2018 signals suggest that tight labor markets and lagging productivity improvements are still key constraints that will limit US growth. According to the Bureau of Labor Statistics, year-over-year labor force growth for December 2017 was 0.90 percent. Labor productivity grew 1.20 percent during the same period. Summing the two gives a GDP growth estimate of just 2.10 percent. Put another way, it’s too early to celebrate entry into 3.0 percent GDP growth territory. We should do well to average 2.8 percent.
When the 50-state geographic imprint of 2016 GDP growth is considered, as shown in the map from the US Bureau of Economic Analysis, there are eight states with state real GDP growth of 2.4 percent or greater (2.4 percent is significant because that is close to the estimate for 2017’s GDP growth for the nation). These strong growth states are California, the District of Columbia, Florida, Georgia, New Hampshire, Oregon, Utah, and Washington. Seven states recorded negative real GDP growth in 2016. These weakest states are Alaska, Louisiana, New Mexico, North Dakota, Oklahoma, West Virginia, and Wyoming. 2016’s rapidly falling energy prices explain part of the weak performance here. One last glance at the 50-state map tells us that how one is doing in the United States depends significantly on the state in question.

Inspecting the Platform
But what about the economy’s current growth platform? Are the elements that support growth beyond 2018 getting stronger and better situated? Might 3.0 percent growth be beckoning way in the distance? I believe the answer is yes. Consider this:
- Global as well as US economic policy uncertainty, as measured by the Economic Policy Uncertainty Index, fell significantly throughout 2017. It is now at a somewhat normal level. High policy uncertainty leads risk-averse economic agents to postpone major decisions.
- GDP growth for much of the industrialized world is currently at a more comfortable and stable level. Some call it “synchronized.”
- In spite of the January correction, high growth in securities valuations across high-income countries has generated a wealth effect that should buoy consumer spending.
- Cuts in US taxes, coupled with rapid write-offs for capital investment, will strengthen corporate and individual plans for growth-generating investment.
- Major reductions in federal regulatory activity are giving a supply-side stimulus to long-range economic growth.
- Continued growth in US energy production is keeping a lid on commodity price increases.
- Wage growth is picking up, adding another positive nudge to consumer spending.
In a few words, the economy’s foundation for growth seems to be much healthier now than in early 2017. On this score, 2018–2019 GDP growth should be stronger. And maybe, just maybe, we will again see regular 3.0 percent growth in the 2020s. But don’t forget this caveat: future growth will be constrained by growth in the labor force and labor productivity.
A Few Words of Caution
However, there is always a but, and for now there are three. The first is the growing prospect for rising inflation and a reactive Federal Reserve that is likely to raise interest rates to prevent overheating. The Bureau of Labor Statistics revised wage growth to 2.9 percent year-over-year in January. Take away the 0.90 percent productivity growth and you get 2.0 percent wage inflation, which begins to sound like the overall price inflation number the Fed has been calling for. I note that overall Consumer Price Index (CPI) inflation for January hit 2.1 percent on a year-over-year basis. There can be little doubt but that inflationary forces are beginning to show themselves. This quarter the Fed ended quantitative easing, and more gradual interest rate hikes are in store. These adjustments may have a chilling effect on economic growth, particularly if the Fed believes that current large excess reserves in the banking system may somewhat cushion the blow on the economy. In addition, the World Bank states that, for the first time in 10 years, the world economy is operating at its potential. Such a statement amplifies concerns about rising inflation. Of course, “potential” is not like a range of mountains that never changes. New investment in real and human capital expands growth potential, though not instantly.
The second cautionary note is about the Trump administration’s official stance regarding world trade and related treaties. Donald Trump’s “America First” mantra can lead to governmental actions that severely cripple US exports—especially for agricultural products—and therefore GDP growth, or punish consumers of tariff-levied imports. Recent tariff increases on Korean washing machines and Chinese solar panels raise concerns that America First actually places American consumers last. I should add that China has already responded with a World Trade Organization complaint against the United States, stating that American exporters have been selling grain below cost thanks to US government farm subsidies. We should expect more of this tit-for-tat activity.
The third concern is about the Trump administration’s foreign policy. A misstep can create a situation that demands larger expenditures on national defense worldwide and therefore causes less investment in private economic activities that foster future growth.
Tax Cuts and GDP Growth
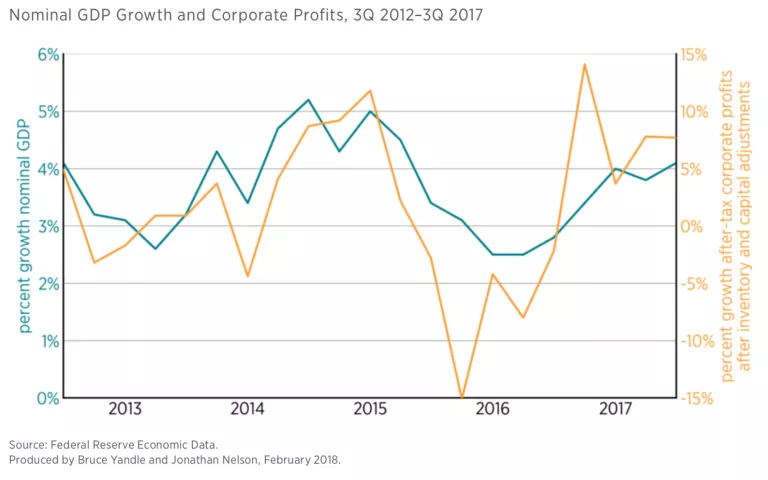
There are some other factors to consider. As previously mentioned, the 2017 tax reform legislation includes many elements that would bolster GDP growth. These elements include reductions in personal income tax rates, cuts in corporate rates, rapid depreciation write-offs, increases in personal deductions, and tighter constraints on mortgage interest deductions. Each of these has a potential GDP effect, but I wish to focus here on just one: the cut in corporate taxes. I do so because, other things equal, I believe the GDP effects can be positive, large, and quick. However, the overall effect on the 2018 economy is apt to be small. I believe the larger effects will come from later wage increases induced by tightening labor markets and from increased investment in human and physical capital, which includes information technology and software. These investments will yield productivity improvements and gains in GDP growth.
The following graph shows the relationship between growth in after-tax corporate profits (adjusted for inventory valuation and capital depreciation) and GDP growth, all in nominal terms, for the 1Q 2013 to 3Q 2017 period.
A Spring Forecast for 2018–2019
When the positive prospects generated by a stronger growth platform and tax reform are combined with negative forces that may come from Washington’s protectionist policies along with constraints posed by low labor force and productivity growth, the resulting forecast looks a bit better than 2017’s economic performance.
Here’s the picture that I see for the United States for 2018:
- Real GDP growth for the year will average 2.8 percent.
- Inflation will rise a bit. Look for 2.2 to 2.5 percent, as compared to this year’s 1.8 percent.
- Interest rates will nudge up: 10-year treasury note—3.10 percent; 30-year mortgage rate—4.00 percent to 4.20 percent.
- Single-family housing construction will be strong; multi-family will be weak.
- The pace of manufacturing activity will continue to accelerate.
How Is America Doing Relative to Other OECD Countries?
Discussion of platforms, synchronized growth, and rising stock market averages begs for a bit of comparison. How is the United States doing relative to other industrialized countries? Are we on the way to becoming great again? And if so, relative to what?
There are many measuring rods to consider, but I will focus on just two: growth in real GDP and gains in broad stock market averages. I pick these two for simple reasons: (1) they are readily available, and (2) most people consider them to be important indicators of economic prosperity. I should note that while GDP is the standard measure of annual economic activity, the stock market may be called a measure of the mood of economic agents for the same economy; it can be read continuously and is far more volatile than GDP.
I suggest we see how the United States is doing relative to a sample of other industrialized countries.
Each week the Economist publishes data on the two aforementioned measures for a large sample of countries. Using data from the December 16, 2017, issue and concentrating on growth since December 2016, I focused on the OECD countries included in the Economist’s data. There are 24 in the sample, and of course, the United States is one of them.
Now, let’s look at the US record. Over the 12-month period, the US recorded a hefty 24.4 percent gain in the Dow Jones Industrial Average (DJIA) and showed 2.2 percent real GDP as the latest growth. (I note that later estimates for US 2017 GDP growth came in at 2.5 percent.) Many people have celebrated the unusually strong DJIA growth, and I surely like it myself, but not many have danced in the street when hearing about GDP growth.
But how about the OECD sample? How did it perform? Did any other country come close to the hot US Wall Street performance?
It turns out that the average growth in stock market indicators for the 24 OECD countries, measured in US dollars, is 24.03 percent, and average GDP growth is 2.53 percent. The US is just a tiny bit better than average for stock market gains and below average for GDP growth at the time the data were collected. Hoping to be great again, America is in the middle of the heap. This is shown in the nearby scatter diagram that maps growth in stock market averages (shown on the horizontal axis) into real GDP growth (shown on the vertical axis). Those countries that lie in the diagram’s northeast quadrant have performed better than the US for both variables. It is also easy to identify countries in the southwest quadrant that have not performed so well.

And which countries get counted in what some might call the losers’ column? Belgium, France, Japan, Mexico, Norway, Switzerland, and the United Kingdom have lower GDP and stock market growth than the United States. Eight countries in the sample fall into the mixed-bag category. Australia, Canada, Israel, Spain, and Sweden are stronger than the United States in GDP growth but have lower gains in stock market averages, and Chile, Italy, and Greece are stronger in stock market gains but lower in GDP growth. In all this, Switzerland takes the booby prize for lowest GDP growth, 0.9 percent in the 24-country sample, and Canada’s 10.1 percent growth takes bottom place for stock market growth.
So, how’s America doing? Even with handsome stock market gains, relative to a cross section of the industrialized world, we are about average. But then, when it comes to GDP growth, we are striving. The road to average seems steep and long. The road to great is even steeper.
Is the United States a Market Economy?
In the wake of expanding Chinese shipments of steel, aluminum, and other commodities, the United States initiated a World Trade Organization (WTO) action against China, accusing China of selling these commodities in US markets at prices below the cost of production—a practice known as dumping. If the allegation is proven, China could be faced with tariffs and penalties.
How an accused country responds to a dumping complaint depends on its WTO status (market economy vs. nonmarket economy). If an economy is deemed to be a market economy by the complaining country, one where the forces of supply and demand generally determine prices and costs, then the response can be based on that country’s—China’s, for example—market prices and costs. But if a country is not deemed to be a market economy, as is currently China’s situation, defense is far more complicated and involves the use of data from a third country where prices and costs are thought to be market determined.
Market status is determined on a country-by-country basis. Since joining the WTO some 14 years ago, China has sought constantly to obtain market economy status. The United States and other trading partners have basically said, “No. You have too many state-owned and state-subsidized enterprises.”
There are politics behind a dumping complaint. Industrial consumers of steel and aluminum would be just as happy to pay lower prices to Chinese providers, but special interest pleading on the part of owners of American manufacturing plants and their employees can be overriding. As they might put it, a long dumping campaign may destabilize our domestic industry and force out of business otherwise profitable firms with severe repercussions on our worker base. When the United States files a WTO dumping complaint, it is in a way favoring some domestic interests over others (e.g., producers over consumers of steel), and this is partly because of the fact that American steel is better organized and able to make its case with the Commerce Department and Congress.
But all this raises a question: Is the United States a market economy? If so, how much of one? When the United States points an accusing finger at China, is this a case of the pot calling the kettle black? After all, the degree to which market forces determine economic outcomes is surely not 100 percent for the United States or for any country.
The Extent to Which the United States Is Regulated
In thinking about the question, my mind turned understandably to the extent to which the US economy is regulated. Yes, China produces steel with state-owned enterprises, but almost all mortgages produced in the US are purchased and processed by Fannie Mae and Freddie Mac, state-owned enterprises. (Of course, we do not export mortgage lending, at least not directly, but we do sell government-produced mortgage-backed securities.) But there is more to the story. What about US enterprises and sectors that are managed by regulatory agencies, like banking and insurance? Or the entire healthcare sector, where prices are based primarily on Medicare reimbursement rates? Or the agricultural economy, which operates within a system of subsidies and market orders? And then there is the Federal Reserve’s attempt to regulate interest rates and the effects of those actions on the value of the dollar and other national currencies.
Are these highly regulated sectors becoming a larger part of the economy? Is the United States well along the way to becoming something other than a market economy? And what about the extent to which all regulations produced by all regulatory agencies impinge on economic decision-making across the entire economy? Is the number of regulatory constraints growing? Staying about the same? Contracting? And if the United States has become a hybrid economy, wouldn’t it make sense to recognize such evolutionary changes and forget about keeping a zero-one WTO rule that says economies are either market economies or not? Might it not make sense to let each WTO case be treated with the best possible regulatory analysis without assuming that somewhere there are cases of pure markets?
Looking at Gross Domestic Product and Regulation
To address the first set of questions, I summed the 2016 share of gross national output produced by agriculture, utilities, broadcasting, finance and insurance, healthcare and social services, autos and motor vehicles, and government and compared that total with a similar 1997 count. I chose industries where prices, entry, product design, and ownership are either government controlled or highly regulated. In 1997, these “heavily regulated sectors” accounted for 20.8 percent of total Gross National Output. In 2016, the total was 21.7 percent, less than a 5 percent increase. On this basis, the US seems to be holding its own as a market economy.
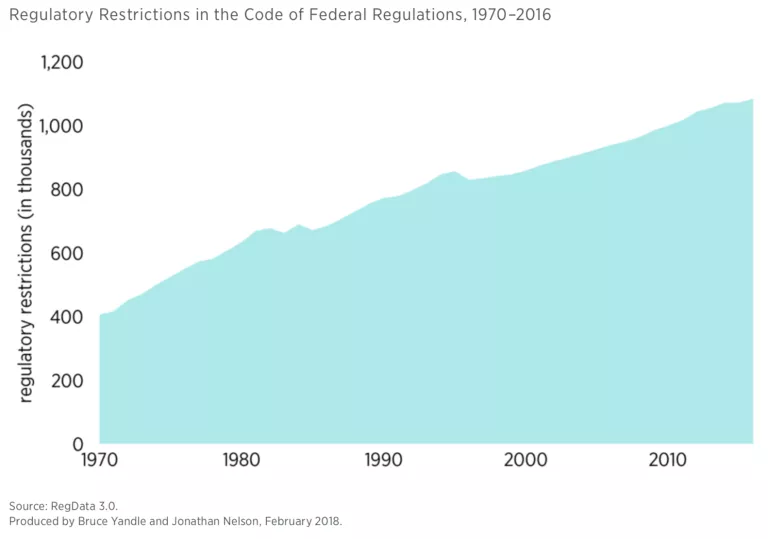
Turning to the second set of questions, I went to the Mercatus Center at George Mason University and got their RegData count of all federal regulatory restrictions for all US industries found in the US Code of Federal Regulations from 1970 through 2016. The total count rose from 405,647 in 1970 to 1,083,318 in 2016, which I report in the next chart.

Using RegData, I also got a reading on the 10 most regulated industries for 1997, 2007, and 2016. I found the following:

Notice that across the 20 years during which the US economy has become more heavily regulated, the mix of top 10 industries has exhibited some interesting movement. I first call attention to the top sector for each year. Professional, Scientific, and Technical Services includes all accounting, business consulting, scientific testing, and engineering services. We might think of it as the premier human capital sector. As to other sectors, I note that Petroleum and Coal moved from 7th to 3rd place across the years, and that Chemical Manufacturing rose from 6th to 2nd place. This movement perhaps reflects the rise of natural gas fracking and production technology. We can also see that Credit Intermediation has risen from 9th to 5th place, no doubt an indication of Dodd-Frank legislation following the 2008 recession.
Mention of the financial sector brings yet another consideration. Since 2008, the US banking system has been affected by many recession-inspired controls, which include those triggered by Dodd-Frank. Along with heavy regulation of all facets of banking have come direct subsidies in the form of taxpayer-funded interest payments on excess reserves held by commercial banks with the Federal Reserve System. In 2016, the Fed paid banks $12 billion in interest. If these payments had not been made, the funds employed would have been returned to US taxpayers. Some 40 percent of the payments went to foreign banks that operate in the US. The interest rate paid on reserves is set by the Federal Open Market Committee when it determines short-term interest rates. In December 2017, the rate was raised to 1.50 percent, a 100 percent sure thing for banks that had over $2 trillion on reserve with the Fed.
Where’s the Economy Headed?
Since we have no pure case for making comparisons, it is impossible to speak definitively to the basic question, Is the United States a market economy? The appropriate answer should always be “relative to what?” Given the extent to which undisciplined market forces are affected by price controls, entry, public ownership, subsidies, and all forms of regulation, it is clear that the US economy is a long way from satisfying what might be called a purely free market. While there is no basis for making cross-country comparisons, it is still possible to identify drift away from a free-market polar position toward a government-owned and -operated extreme position. Based on the data reported here, one can be confident in saying that the US economy has drifted significantly in the direction of state control since 1970, but the pace toward state control has slowed in recent months.
Though the sighting of one swallow does not define the coming of spring, we can still consider the sharp reduction in regulation that occurred during the Trump administration’s first year. For example, in 2017 the number of pages in the Federal Register came in at 61,950, compared with the all-time high of 95,894 in 2016. The number of new rules announced in 2017 stood at 3,281, compared with an average of 3,633 in the previous eight years. Finally, the Trump administration withdrew or delayed 1,579 rules that were in the process of being made final when the new administration arrived in office. EPA rules have been especially sensitive to regulation rollback. According to the Harvard Law School’s Environmental Regulation Rollback Tracker, some 40 rules have now been reversed by the Trump administration. Yes, one year’s data point cannot determine a trend, but the dramatic decline in regulatory activity described by 2017’s reduced pace surely suggests that the US economy is receiving a free market nudge.
Putting the Spotlight on Colorado’s Economy
Patrick A. McLaughlin—Senior Research Fellow, Director of the Program for Economic Research on Regulation, Mercatus Center at George Mason University
Jonathan Nelson—Program Coordinator, Mercatus Center at George Mason University
Each quarter, we select one state economy and assess that economy’s economic health and growth prospects. We also examine the state’s regulatory environment. Last quarter we put North Carolina in the spotlight. In previous quarters, we have examined Oregon, Kentucky, and Michigan. We focus on Colorado this quarter.
In the past year, Colorado has enjoyed a period of solid economic growth. The state’s personal income grew by 2.9 percent from 3Q 2016 to 3Q 2017, better than the nation’s growth rate of 2.6 percent.
Some of this economic growth is owing to both Colorado’s booming craft beer industry and the recently legalized cannabis industry. According to a report from the Brewers Association, there are 334 craft breweries in Colorado (ranking second in the nation), which produce a total of over 1.4 million barrels of beer per year. The industry contributes over $3 billion to the state, ranking first in the nation in per capita economic impact. As of October, the cannabis industry has made over $1.2 billion in 2017 sales, resulting in over $205 million in tax revenue for the state.
Since Colorado has beautiful, snowy mountains, perfect for skiing and other wintery activities, it is unsurprising that tourism is an important industry in the state. Even during the summer, Colorado offers adventures like whitewater kayaking and wonderful hiking trails. Nearly 5 percent of Colorado’s GDP comes from tourism, ranking 12th nationwide (behind states like Nevada, Hawaii, and Florida).
While basic goods production plays a much less important role in the Colorado economy now than in previous decades, oil and gas extraction remains a big industry in the state. In 2015, the industry produced $11.8 billion in output, constituting about 3.7 percent of the state’s GDP.
Colorado is a top performer with regard to educational attainment, ranking 12th among the 50 states with 91.2 percent of the adult population having graduated from high school, and ranking 3rd with 39.2 percent of the adult population having bachelor’s degrees. The state ranks 8th in median household income. The state’s unemployment rate has plummeted since the 2008 recession, having reached an all-time low of 2.3 percent in April 2017. As of November 2017, Colorado’s unemployment rate remains below 3 percent, more than a percentage point below the national rate of 4.1 percent.
What about the future economy? There are two indicators to consider. The first is the current state leading indicator produced by the Philadelphia Federal Reserve Bank. The indicator shows what to expect for the state’s economy in the next six months. As of November 2017, it is positive for Colorado.
A second assessment of future prospects is the extent to which a transition is being made toward the emerging knowledge economy. The New Economy Index produced by the Information Technology and Innovation Foundation provides this broader assessment. Its most recent report shows that Colorado ranks near the top of the 50 states with respect to knowledge jobs, economic dynamism, and innovation capacity. The state is average with respect to globalization and size of the digital economy. Overall, Colorado ranks 7th in making the transition to the new economy.
In terms of overall fiscal solvency, the state government of Colorado ranks 30th in the nation in 2017 according to the State Fiscal Rankings project by the Mercatus Center at George Mason University. On a short-run basis, Colorado has between 1.25 and 2.02 times the cash needed to cover short-term obligations, well below the national average. Revenues exceed expenses by only 3 percent, producing a surplus of $145 per capita. On a long-run basis, Colorado has a net asset ratio of 0.01. Long-term liabilities are 46 percent of total assets, near the national average. Like many other states, Colorado has issues managing its state pensions, with an unfunded liability of $93.72 billion, which is 34 percent of state personal income.
Colorado’s Regulatory Outlook
Colorado’s regulatory code is published in the Code of Colorado Regulations (CCR) and contains roughly 11.5 million words. Even as a full-time job, it would take someone about 16 weeks to read the entire code, assuming she read 300 words per minute, 40 hours per week.
RegData found 151,860 regulatory restrictions in the CCR. These are instances of the words and phrases shall, must, may not, prohibited, and required, and can signify legal constraints and obligations on individuals and businesses. Colorado’s state regulatory burden is above the median number of restrictions (126,734) for the 20 states that have been analyzed so far. Compare Colorado to New York, the most regulated state, with 307,636 restrictions, and Arizona, the least regulated, with 63,919.
In addition, RegData identified the most regulated industries in Colorado. The top five regulated industries are ambulatory healthcare services (12,210 restrictions), chemical manufacturing (8,981 restrictions), utilities (5,488 restrictions), mining other than oil and gas (5,338 restrictions), and nursing and residential care facilities (5,020 restrictions). Many of the restrictions on healthcare come from the Department of Public Health and Environment. This department alone is responsible for 40,638 regulatory restrictions.
At the federal level, the healthcare industry is also heavily regulated. The industry is regulated by 17,623 federal restrictions in addition to the 12,210 state-level restrictions in Colorado. Healthcare is generally a highly regulated industry in many states, including Connecticut (6,809 restrictions), Nebraska (5,135 restrictions), New York (8,273 restrictions), Pennsylvania (5,631 restrictions), and Oregon (8,732 restrictions).
Colorado’s recent steady economic growth and low unemployment is likely to continue as it successfully makes the transition to the new knowledge-based and service-oriented economy. It will be important for Colorado lawmakers and regulators to keep markets open and free from excessive taxation and regulations (especially in the beer and cannabis industries) to allow the economy to continue to thrive.
Yandle’s Reading Table
I turn now to share thoughts on Christopher Scalia and Edward Whelan’s Scalia Speaks (New York: Crown Forum, 2017). Justice Antonin Scalia was widely recognized and highly respected (even by his ideological adversaries) for his prodigious scholarship, excellent writing, and deep commitment to the rule of law—as implied by the original meaning of the words that form the US Constitution. On top of all these superlatives, one can add a final scoop of verbal ice cream. Scalia had a great sense of humor and enjoyed helping people laugh. He said yes to life. All of these precious traits are encountered in Scalia Speaks, an edited collection of 39 speeches and seven eulogies organized by his son Christopher Scalia and a former law clerk, Edward Whelan. Each speech was delivered while Scalia was serving on the Supreme Court.
The speeches are delightful, partly because they are short, but mainly because of the elegance of content. The occasions when these speeches were delivered run a wide gamut that includes high school reunions, prayer breakfasts, the celebration of George Washington’s birthday by the Chicago Union League Club, and commencement addresses at Catholic University and Langley (Virginia) High School. In some cases, the speeches are light and mainly entertaining. In still other instances, the discussions are deeply challenging, but always enjoyable. Of course, the eulogies must be mentioned separately, for they introduce the reader to a small collection of outstanding individuals who sought to serve the public interest.
The speeches are organized into six categories: the first is on the American people and ethnicity, the second on living and learning, the third on faith, the fourth on law, the fifth on virtue and public good, and the last on heroes and friends. Upon reading through the sections, one gets to know Scalia first as a human being, a man who loved his wife, his family, nation, and life itself. Further reading reveals Scalia the scholar, a man who loved words, good writing, hardheaded legal analysis, music, and singing. The reader becomes acquainted with the justice’s deep religious faith as well as his expansive appreciation of people from all backgrounds, religions, and ways of life. In the midst of this, one encounters Scalia’s dedication to making original-meaning Constitutional interpretations even when doing so cut against the grain of his religious beliefs.
As might be expected, and desired, Scalia’s speeches provide a bundled, but brief, legal education on important topics. One outstanding example of this is found in his treatment of the Bill of Rights and the First Amendment’s protection of “the freedom of the speech.” It will be noted that I carefully included “the” in the quotation. Scalia teaches us that the protection is not for freedom of speech, but for freedom of the speech and other matters enjoyed by Englishmen at the time the Bill of Rights was written. Scalia points out that the Bill of Rights “was intended to cover those rights that a tyrant was most likely to infringe.” His discussion of the point helps one understand how dedication to original intent yields a vastly different interpretation relative to an interpretation based on a living constitution that must be interpreted in the light of the times and pressures of the moment.
Original intent, or what Scalia prefers, original meaning, is a recurring theme in the collection, and for good reason. The late Justice Scalia makes clear that he is fighting a lonely battle in his effort to constrain our human tendencies to employ government’s coercive powers to direct resources to projects that suit our preferences. Scalia Speaks is just the right choice for bedside reading.
Economists Brink Lindsey and Steven M. Teles take a different approach in their 2017 book, The Captured Economy (New York: Oxford Press, 2017). Instead of looking at particular industries or firms and identifying the consequences of regulatory rent-seeking, the two authors examine the cumulative effects of federal regulation on the economy’s growth and performance. The book’s subtitle gives a short synopsis: “How the Powerful Enrich Themselves, Slow Down Growth, and Increase Inequality.” In a real sense, the book picks up a theme from the Ford administration’s “Whip Inflation Now” program, when economists saw regulation as the cause of reductions in GDP growth and therefore saw holding money supply constant becoming a source of inflation. But as indicated, Lindsey and Teles argue that US regulatory hardening of the arteries has done more than just slow economic growth. Regulatory capture has also supported a biased growth that rewards higher-wage workers and owners of capital while penalizing those at the bottom of the income ladder. In short, US-style regulation has contributed to rising income inequality.
Since the late 1960s, students of regulation have examined theories of regulatory capture that involve coalitions of interest groups who expect their desired regulatory gains to exceed the costs they incur when getting them. For example, we have learned that public utility investors and their agents will work long and hard to influence the ratemaking process, that major banks will attempt to influence specification of Basel capital requirements, and that natural gas producers will subsidize national environmental groups who work to bring an end to coal-fired electricity generators. Though first identified and discussed by Gordon Tullock in 1967, little attention has been paid on an ongoing basis to the deadweight losses that come with regulatory rent-seeking and capture. And until Lindsey and Teles, no one has argued that regulation leads systematically to biased economic growth that favors higher-income groups, broadly speaking.
In this short book (221 pages, including the index), the two authors refer to the recent presidential election and lay out what they term the folk explanation of what is wrong with America: “Elites have conspired to hoard opportunity, manipulating the rules and their control of the political system to generate wealth for themselves, even as living standards for everyone else stagnate or decline.” They then embellish this by noting that the US economy has become less competitive, less dynamic, and less innovative; and this hardening of arteries, generated by regulation, has redistributed income from lower- to higher-tier elements of the population. I should note that after arguing that regulation has generated all this mischief, the two authors recommend more regulation as the solution; they call for more stringent enforcement of antitrust law. Somehow, they seem unaware of scholarly work that suggests that antitrust enforcement is just as subject to rent-seeking behavior as other forms of regulation.
The book is organized in a useful way for teachers. Following two chapters that lay out their basic argument, the authors provide four case-study chapters: one from the financial crisis, one on intellectual property, another on occupational licensing, and the last on land use. The book concludes with a well-done chapter on Public Choice economics and a final chapter that offers their somewhat flawed recommendation for dealing with the problem of biased regulatory capture.

