- | Housing Housing
- | Research Papers Research Papers
- |
State Fiscal Rankings | 2018 Edition
Ranking the States by Fiscal Condition
This study ranks the 50 states according to their financial condition. How does your state rank?
For the fifth and final year, a study from the Mercatus Center at George Mason University ranks the 50 states according to their financial condition. Each edition has provided a snapshot of each state’s fiscal health by providing information from audited state financial reports in an easily accessible format. In “Ranking the States by Fiscal Condition, 2018 Edition,” Eileen Norcross and Olivia Gonzalez calculate this year’s rankings from each state’s fiscal year 2016 reports and then apply trend analysis to reports for each year from 2006 until 2016.
The study measures how well states can meet short-term and long-term bills by examining their financial statements. Most states are in a stable condition, with the exception of the size of unfunded pension liabilities (a large portion of most state government obligations). Some states also have consistently low levels of cash, which indicate the potential for budget shortfalls during a recession.
A Multidimensional Approach to Fiscal Solvency
The study analyzes state finances according to five dimensions. These dimensions combine to produce an overall ranking of state fiscal solvency.
- Cash solvency. Does a state have enough cash on hand to cover its short-term bills?
- Budget solvency. Can a state cover its fiscal year spending with revenues, or does it have a budget short-
fall? - Long-run solvency. Can a state meet its long-term spending commitments? Will there be enough money to cushion it from economic shocks or other long-term fiscal risks?
- Service-level solvency. How large a percentage of personal income are taxes, revenue, and spending? How much “fiscal slack” does a state have to increase spending if citizens demand more services?
- Trust fund solvency. How much debt does a state have? How large are its unfunded pension and healthcare liabilities?
Top Five States
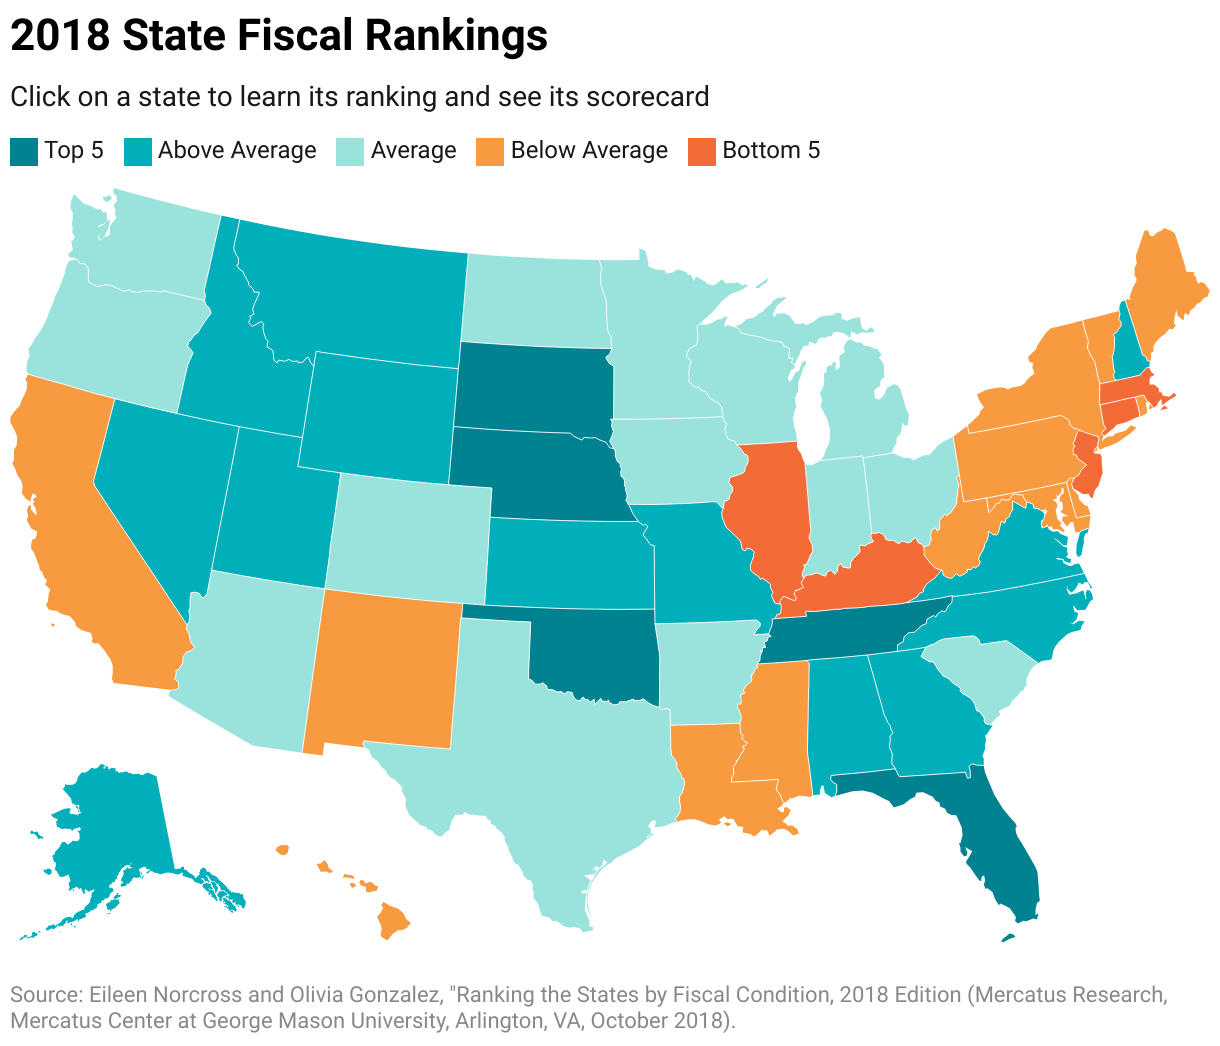
The top five most fiscally solvent states are Nebraska (#1), South Dakota (#2), Tennessee (#3), Florida (#4), and Oklahoma (#5).
Bottom Five States
The bottom five states in terms of fiscal solvency are Kentucky (#46), Massachusetts (#47), New Jersey (#48), Connecticut (#49), and Illinois (#50).
National Trends in Fiscal Health
- Comparing revenues to expenses, state budgets have not fallen to the lows they reached during the recession, but they also have not quite improved to prerecession levels.
- Long-term liabilities have, on average, increased over time.
- Long-term liabilities increased most significantly in fiscal year 2015, largely as a result of new Governmental Accounting Standards Board (GASB) rules that required states to report unfunded pension obligations on the balance sheet.
- Unfunded pension liabilities remain an ongoing problem for the states. The GASB reporting changes only more transparently reveal the magnitude of the problem.
Key State Findings
- Consistent performers. Some states have consistently performed poorly, such as Connecticut, Illinois, and New Jersey. They have experienced ongoing structural deficits, a growing reliance on debt to fund spending, underfunded pensions and other postemployment benefit liabilities, or some combination of these problems. States with low levels of debt and unfunded pension liabilities and strong short-term indicators include Nebraska, Tennessee, and Utah.
- Fiscal implications of heavy reliance on oil tax revenue. Alaska, North Dakota, and Wyoming rely heavily on severance taxes on oil production as sources of revenue to finance government spending. These states experience volatility in their short-term solvency and dramatic swings in cash and revenue levels. In some cases this leads them to increase spending beyond a level that could be supported if the revenues were raised based on the income of residents.
- Fiscal implications of major tax reform. Indiana, Kansas, Michigan, North Carolina, Rhode Island, and Utah have each passed a variety of tax reforms during the time period this study analyzes. In the cases of Indiana and North Carolina, these reforms were accompanied by base-broadening or spending reforms that resulted in neutral or positive impacts on the states’ financial positions. By contrast, Kansas’s tax reform of 2012 cut rates but narrowed the tax base by including an income tax exemption for sole proprietorships. It also did not undertake spending reforms. This led to a steady decline in Kansas’s budget solvency during the postreform years.
Conclusion
States face many fiscal problems, but these problems are not insurmountable. Studying how each state is performing with respect to a variety of fiscal indicators can help state policymakers address persistent issues and anticipate potential problems.

