- | Government Spending Government Spending
- | Data Visualizations Data Visualizations
- |
Budget Caps Are a Healthy Brake on Federal Spending
Lawmakers on Capitol Hill continue to find more ways to raise funding above the level permitted by the caps. Republicans would like to increase the caps on defense funding while Democrats would like to increase the caps on nondefense funding. That should concern taxpayers because, as the following charts show, the caps and accompanying sequestration enforcement mechanism have been successful in constraining the discretionary share of the federal budget.
The Budget Control Act of 2011 created caps on discretionary funding for fiscal years (FYs) 2012 to 2021 that are enforced by the threat of sequestration (across the board cuts) should Congress allocate funds above acceptable levels. Policymakers have tried to circumvent these caps since their inception. In 2013, Congress boosted the discretionary cap level by $63 billion for FYs 2014 ($44.8 billion) and 2015 ($18.5 billion) under the so-called Ryan-Murray budget deal. Congress has also used the Overseas Contingency Operations account (known as the war fund), which is not subject to the caps, to evade limits on defense funding.
Lawmakers on Capitol Hill continue to find more ways to raise funding above the level permitted by the caps. Republicans would like to increase the caps on defense funding while Democrats would like to increase the caps on nondefense funding. That should concern taxpayers because, as the following charts show, the caps and accompanying sequestration enforcement mechanism have been successful in constraining the discretionary share of the federal budget.
In both charts, actual and projected cap funding levels are measured against the Congressional Budget Office’s March 2011 adjusted baseline projections for defense and nondefense discretionary funding without the caps. The first chart is in nominal terms, and the second chart is in inflation-adjusted FY 2016 dollars.
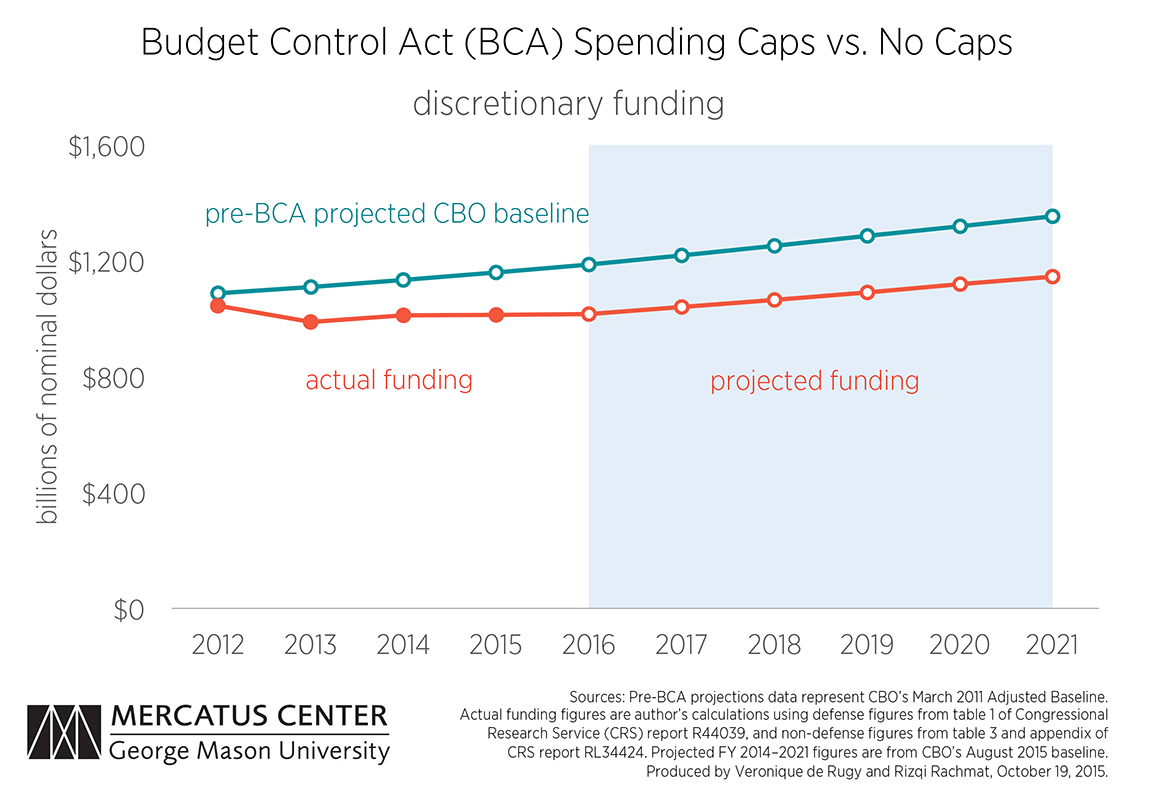

Both charts give us an idea of the actual and projected savings to taxpayers. In nominal terms (chart 1), discretionary funding rises slightly over time, after an initial drop, from FY 2012 to FY 2021. In real FY 2016 dollars (chart 2), discretionary funding is projected to be lower at the end of that period.
One of the chief criticisms of the caps is that they are largely limited to the discretionary programs, which comprise an increasingly smaller share of the overall federal budget. That’s a fair criticism. Chart 3 shows capped discretionary funding versus total federal funding from FY 2012 to FY 2021.
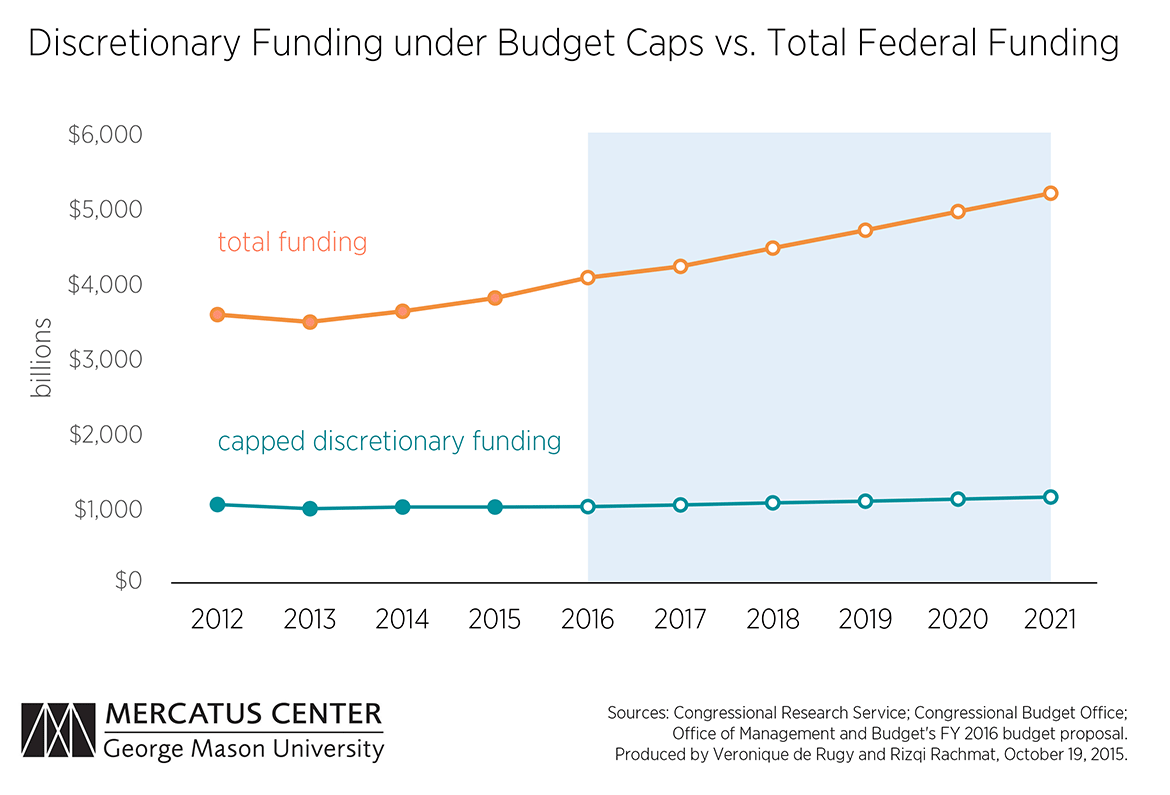
This chart shows that overall spending continues to rise even with the caps on discretionary funding. That is because mandatory programs, which are the biggest drivers of the federal government’s long-term budget problems, are largely sheltered from the caps. Instead of trying to find ways to evade or do away with the caps on discretionary spending, policymakers should lock in these gains for taxpayers and seek to expand limits on federal funding to include more of the mandatory side of the budget.

