- | Government Spending Government Spending
- | Data Visualizations Data Visualizations
- |
The Fiscal Interplay Between Federal, State, and Local Governments
Using data from the Office of Management and Budget (OMB), the following two charts place the post-1960s explosion in federal grants to state and local governments in perspective.
The federal government spends over $500 billion annually on grants-in-aid to state and local governments, making grants-in-aid the third largest item in the budget after Social Security and national defense. In recent decades, federal aid to state and local governments has soared and, thus, increased their reliance on federal aid for the financing of certain government functions.
Using data from the Office of Management and Budget (OMB), the following two charts place the post-1960s explosion in federal grants to state and local governments in perspective.
Grants-in-aid are a primary mechanism that the federal government uses to extend its influence into state and local affairs. Under the grant-in-aid process, the federal government claims to extend aid to the states to finance “areas of domestic public spending” or for “swift fiscal relief during the recent recession” or for when “severe and unforeseen economic conditions” arise.
The implications of federal grants-in-aid to state and local governments are far reaching. It raises questions over Congress’s ability to attach conditions to federal grants-in-aid for other purposes. For individual states to continue to qualify for federal funds for projects, they have to abide by certain federal rules or regulatory controls. This muddies the lines between federal, state, and local government activities.
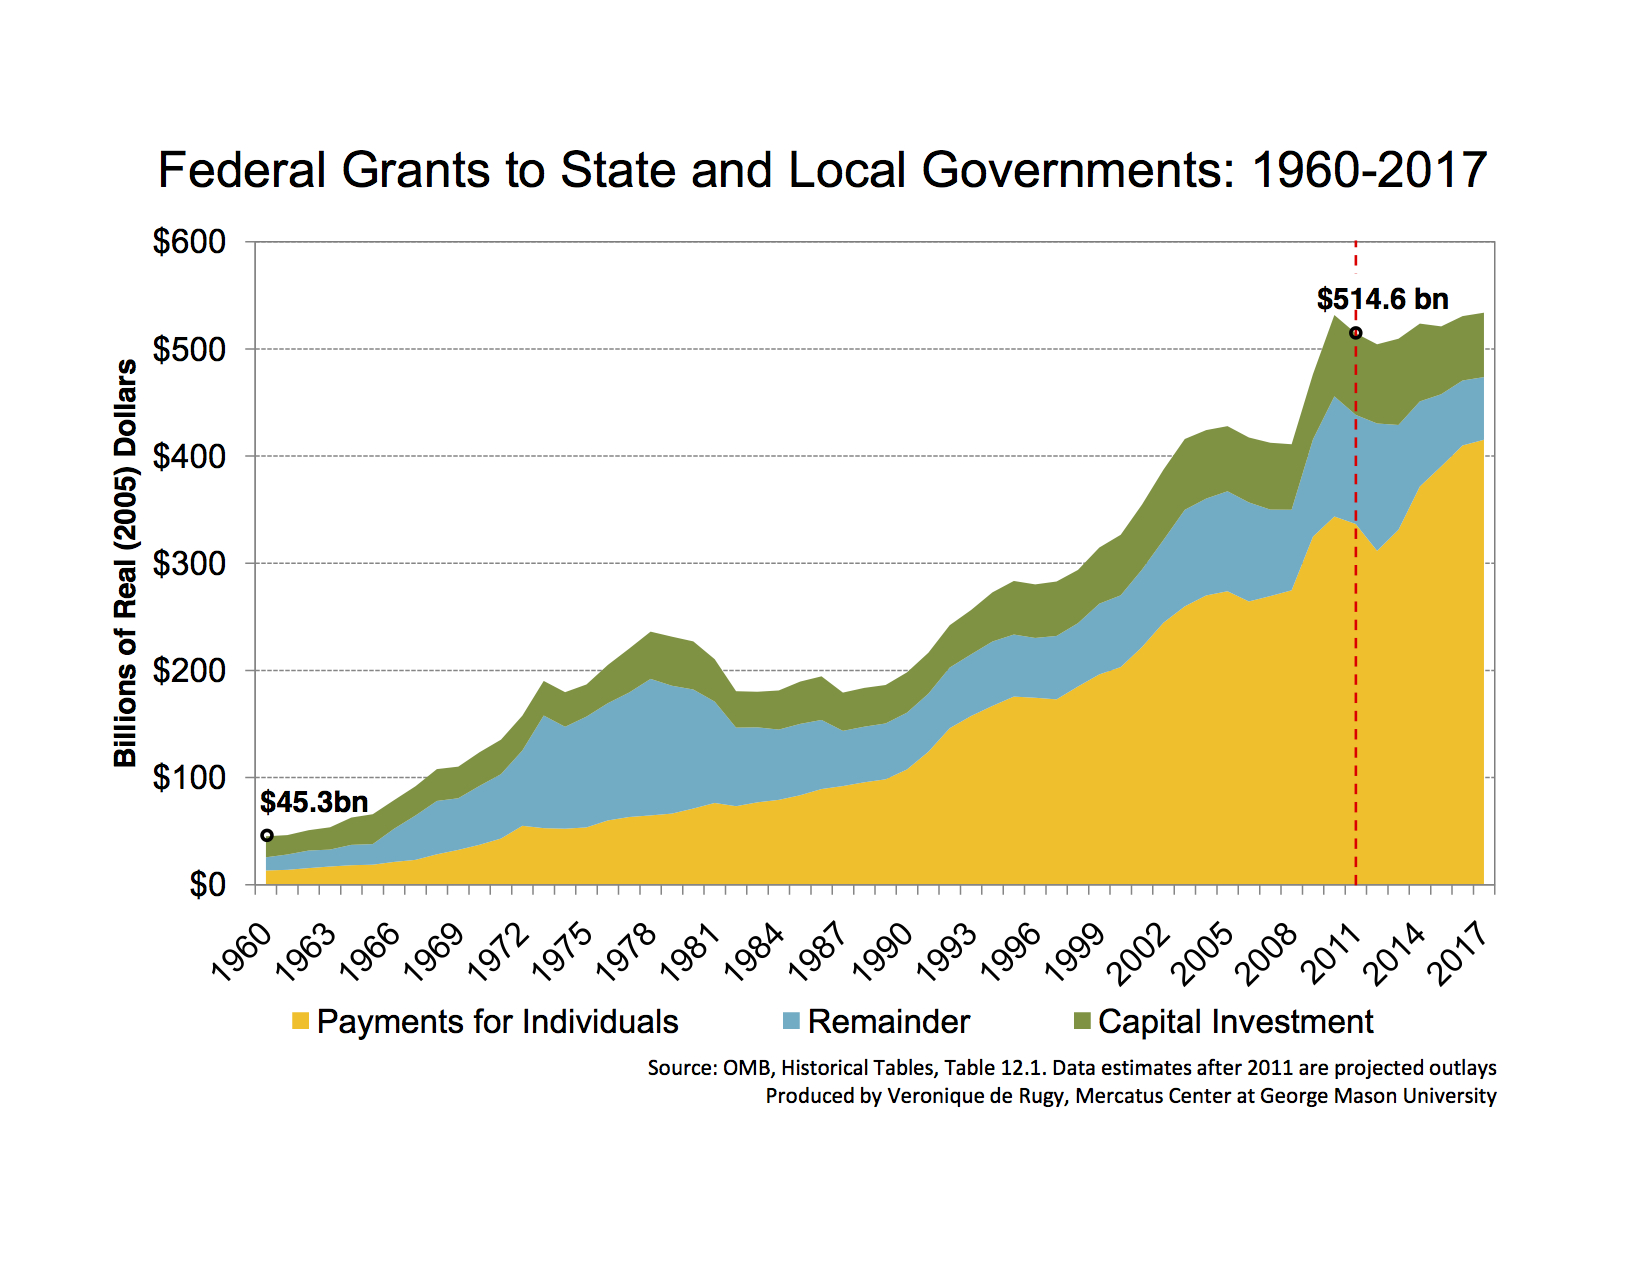
The chart above plots federal spending on grants to state and local governments between 1960 and 2017. After the 1960s, a huge expansion in aid came with the changes in policy.
Grants-in-aid started in the early 20th century and experienced pronounced growth in the 1930s during the Roosevelt Administration, and later during President Lyndon Johnson’s Great Society initiative of the 1960s. In the beginning of the 1980s grant spending dwindled down and managed to maintain an average 11 percent of total outlays, specifically after the signing of Omnibus Budget Reconciliation Act of 1981 during the Reagan years. Spending began to increase again in the 1990s as a result of the expansion of Medicaid.
In fiscal 2011, total federal grant spending was $514.6 billion; more than a ten-fold increase over $45.3 billion four decades ago. Also, almost 18 percent of all federal spending goes to grants-in-aid. At the height of grant spending in 2009 and 2010, the amount of grants disbursed grew by 16 percent and 11 percent, respectively—the highest annual spikes in history.
The data show that aid for capital investment pales in comparison to funding for payments for individuals. So while proponents of increased federal aid to state and local governments argue the need to fix crumbling roads, bridges, infrastructure—or what economists call “public goods—the data show that the majority of aid goes to payments for individuals.
It is important to note that federal grants-in-aid is a larger source of revenue for state and local governments than personal, sales, and property taxes. Grants provided about 26 percent of current receipts in 2010, a portion that has steadily grown throughout this 40-year period. In the past decade, federal grants-in-aid financed over one-fifth of state budgets on average, according to the OMB.
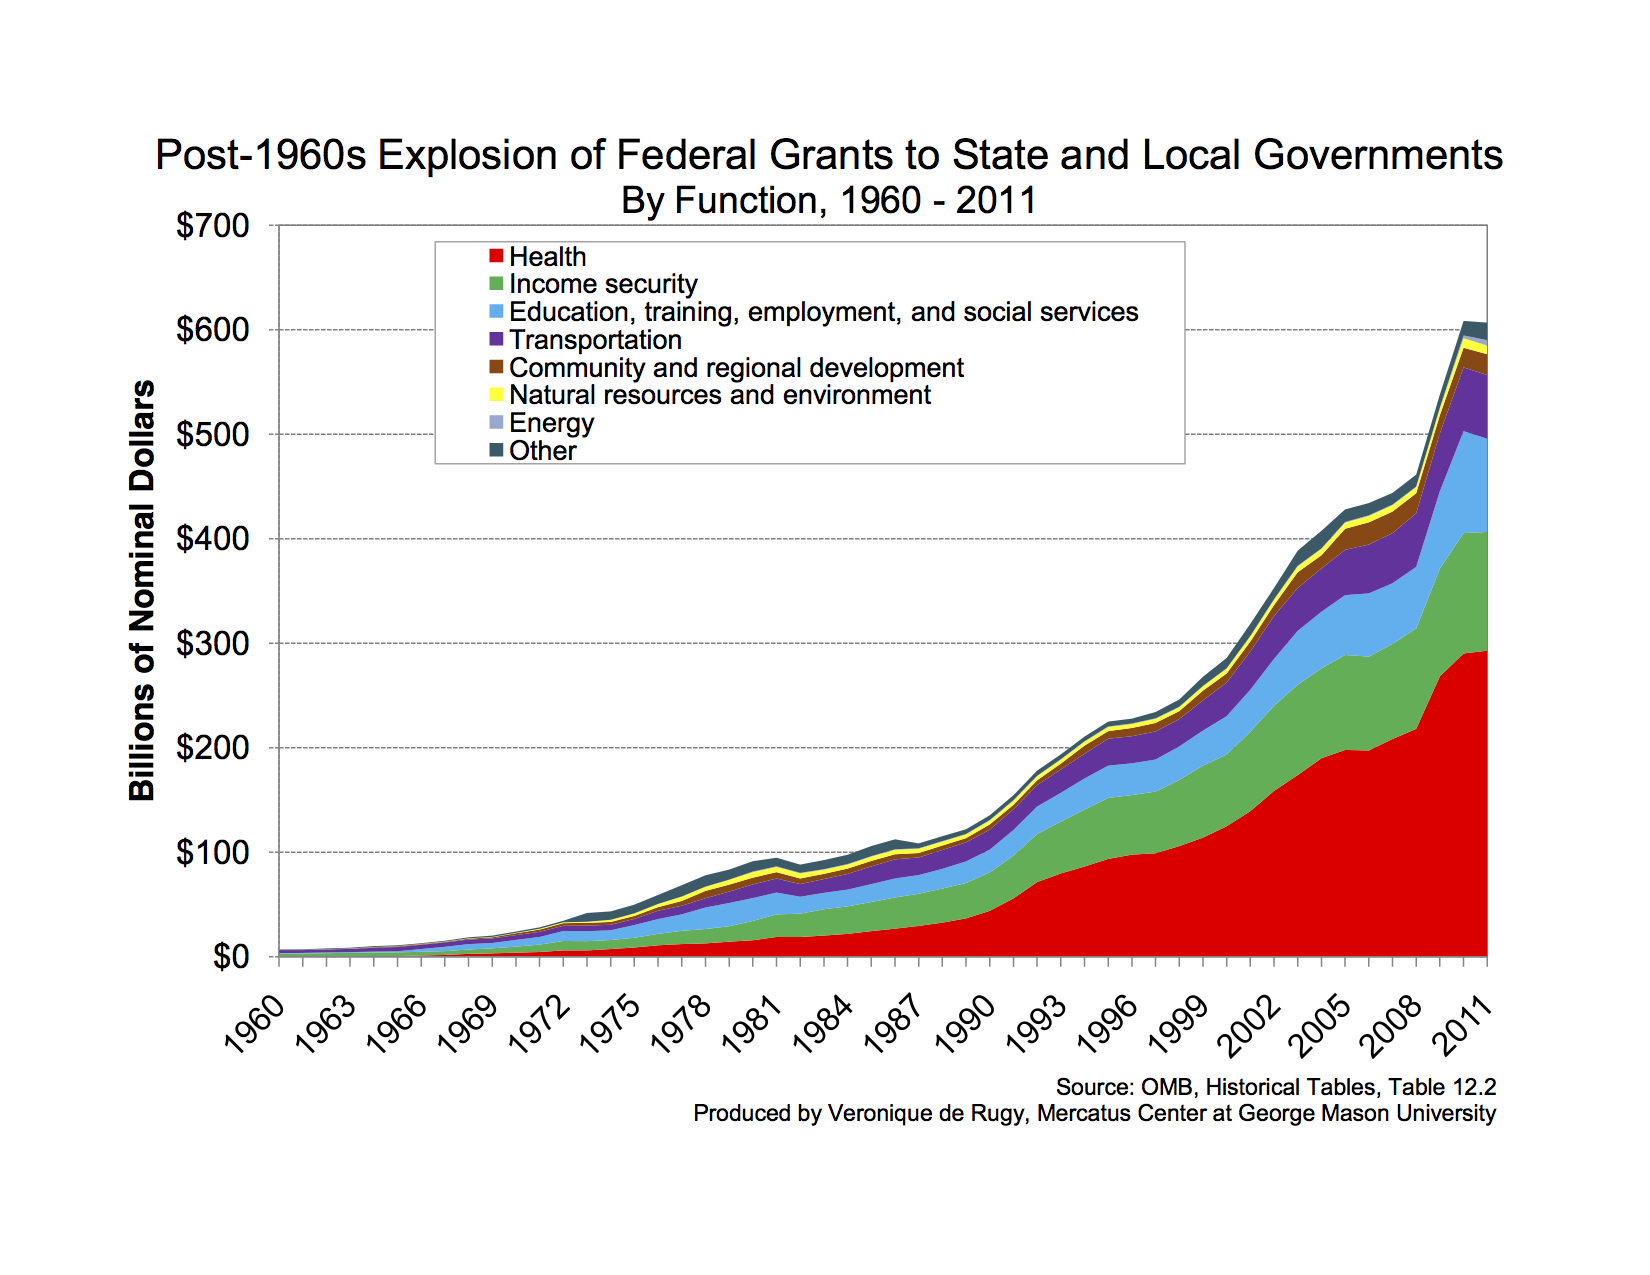
This chart highlights the key categories of federal grant funding to state and local governments and how this funding has shifted over time. The key categories of grants-in-aid to state and local governments include: health, income security, education, transportation, housing and community services. These functions combined constitute more than 90 percent of total grant outlays.
During the Nixon Administration, major new grants were created for natural resources and environment, community and regional development, and other general government-revenue sharing programs.
Over time, however, health (mainly Medicaid) and income security programs have increased as a share of federal grants to state and local governments more than any other program. The data show that health grants grew from 24 percent of federal funds in 1980 to 58 percent in 2010. According to the Government Accountability Office, Medicaid grants comprised 91 percent of all health grants in 2010.
While funding persists, so does uncertainty surrounding the improvements in program quality and efficiency. The federal government should allow state and local governments to compete amongst each other to promote better management practices, policymaking, and the implementation of programs that matter to the particular state or locality. And states and localities should either pay for it independently or find ways to make it affordable within their budgetary means.
Related Content
- | Government Spending Government Spending
- | Expert Commentary Expert Commentary
States' Finances Threaten Whole Country

- | Government Spending Government Spending
- | Data Visualizations Data Visualizations
State and Local Governments Outpace Growth of Private Sector
- | Academic & Student Programs Academic & Student Programs
- | Government Spending Government Spending
- | Journal Articles Journal Articles

