- | Regulation Regulation
- | Data Visualizations Data Visualizations
- |
Quantifying Regulation in US States
Regulation has traditionally been an understudied topic among economists because it is difficult to measure effectively, but that’s started to change in recent years. The size, scope, and complexity of federal regulation in the United States, as well as in other countries, is now better documented and, more importantly, quantified in various dimensions. However, regulation in the 50 US states has remained elusive because comprehensive, consistent measures of state regulation are difficult to obtain across jurisdictions. Nonetheless, state regulation has the force of law just like any other form of regulation. It restricts the activity of individuals and businesses with the same legal force as requirements in the US Code of Federal Regulations (CFR).
To gain a better understanding of the reach of state-level regulation in the United States, the Mercatus Center at George Mason University launched the State RegData project and has gathered and analyzed the regulations of 46 states plus the District of Columbia. (Unfortunately, the regulatory codes of Arkansas, Hawaii, New Jersey, and Vermont were not able to be analyzed owing to data limitations.) Mercatus researchers then used text analysis and machine learning algorithms to quantify how many words and regulatory restrictions each state’s regulations contain as well as to estimate which sectors and industries of the economy those regulations are likely to affect. As in all RegData datasets, regulatory restrictions are a metric designed to act as a proxy for the number of prohibitions and obligations contained in regulatory text, as indicated by the number of occurrences of the words and phrases “shall,” “must,” “may not,” “required,” and “prohibited” in each state’s regulations.
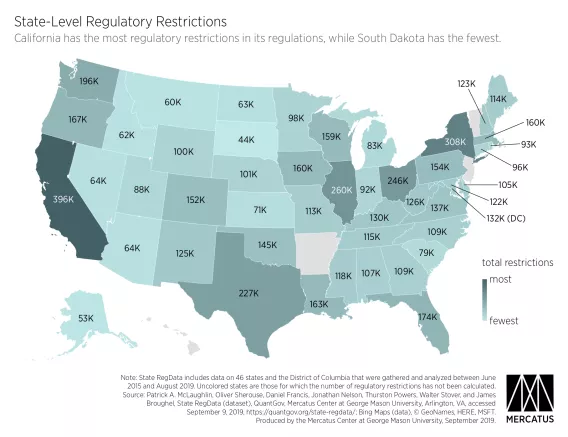
The map below shows the number of regulatory restrictions by state. The text of regulations for these states was collected between June 2015 and August 2019.

California’s regulations contain the most regulatory restrictions, with almost 396,000 in total. New York is second, with just over 300,000. Rounding out the top 5 are Illinois (approximately 260,000), Ohio (approximately 246,000), and Texas (approximately 227,000). Meanwhile, South Dakota has the least restrictive regulations, with almost 44,000 restrictions. Alaska, Arizona, Idaho, Kansas, Montana, Nevada, and North Dakota are other states with fewer than 75,000 restrictions. Sixteen states have fewer than 100,000 regulatory restrictions in their administrative codes.
Keep in mind that these estimates are only for state-level restrictions, which are an added layer on top of the words and regulatory restrictions in the US Code of Federal Regulations. As of November 4, 2019, the electronic version of the CFR contains nearly 103 million words and 1.07 million regulatory restrictions. Researchers are only beginning to understand the causes and effects of the federal regulatory system’s massive size and dramatic growth over the past four decades. Now, with better data, the effects of state regulation can be studied more comprehensively as well.
Acknowledgments
The authors acknowledge Oliver Sherouse, Daniel Francis, Jonathan Nelson, Thurston Powers, and Walter Stover for the programming work that made State RegData possible. In addition, the authors thank Stephen Strosko, A. J. Nye, and Vince Miozzi for valuable technical and research assistance.

