- | Regulation Regulation
- | Data Visualizations Data Visualizations
- |
Quantifying Regulation in US States with State RegData 2.0
Regulation has traditionally been an understudied topic among economists because it is difficult to measure effectively. But measurement has started getting easier in recent years. The size, scope, and complexity of federal regulation in the United States, as well as regulation in other countries, is now better documented and, more importantly, quantified in various dimensions. However, measurement of US regulation at the state level has remained elusive because comprehensive, consistent measures of state regulation are difficult to obtain across jurisdictions. Nonetheless, state regulation has the force of law just like any other form of regulation. It restricts the activity of individuals and businesses with the same legal force as requirements in the US Code of Federal Regulations (CFR).
To gain a better understanding of the reach of state-level regulation in the United States, the Mercatus Center at George Mason University completed the first version of the State RegData project in 2019. Version 2.0 of the project, released in July 2020, gathered and analyzed the regulations of 44 states plus the District of Columbia. (Unfortunately, the regulatory codes of Alaska, Arkansas, Connecticut, Hawaii, New Jersey, and Vermont were not analyzed due to limitations on data availability.) Mercatus researchers then used text analysis and machine learning algorithms to quantify how many words and regulatory restrictions each state’s regulations contain, as well as to estimate which sectors and industries of the economy those regulations are likely to affect and how complex the regulatory code of each state is. As in all RegData datasets, regulatory restrictions are a metric designed to act as a proxy for the number of prohibitions and obligations contained in regulatory text, as indicated by the number of occurrences of the words and phrases “shall,” “must,” “may not,” “required,” and “prohibited” in each state’s regulations.
The map below shows the number of regulatory restrictions by state. The text of regulations for these states was collected between March and June of 2020.
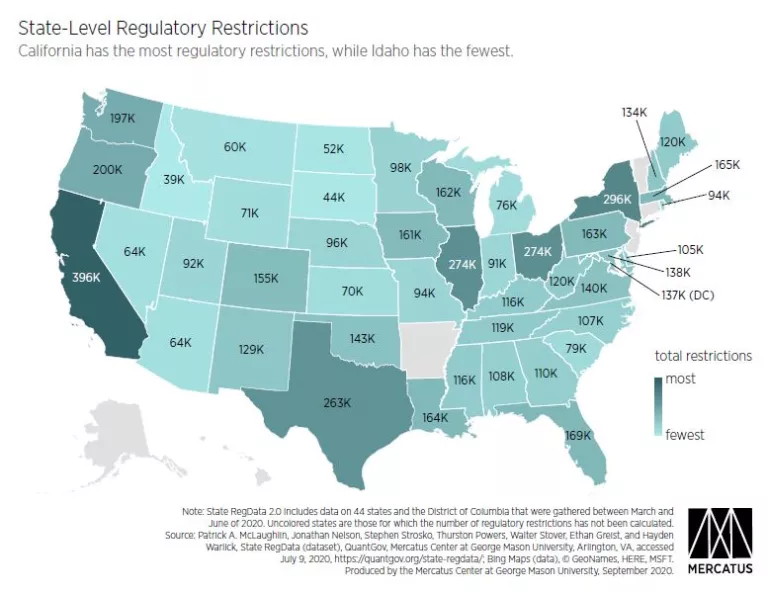
California has the most regulatory restrictions in its regulatory text, with almost 396,000. New York is second, with just under 300,000. Rounding out the top 5 are Ohio (with approximately 274,000), Illinois (with approximately 274,000), and Texas (with approximately 263,000). Meanwhile, Idaho has the least restrictive regulations, with fewer than 39,000 restrictions. Montana, North Dakota, and South Dakota are other states with fewer than 60,000 restrictions. Sixteen states have fewer than 100,000 regulatory restrictions in their administrative codes.
Interestingly, four of the six states that saw the largest percentage reduction in regulatory restrictions between the releases of version 1.0 and version 2.0 of State RegData are states that have cited Mercatus research or used State RegData metrics to guide their red-tape-cutting efforts. These states are Idaho, Missouri, Kentucky and Nebraska.
These estimates are only for state-level restrictions, which are an added layer on top of the words and regulatory restrictions in the CFR. As of 2019, the CFR contained nearly 103 million words and 1.08 million regulatory restrictions. Researchers are only beginning to understand the causes and effects of the federal regulatory system’s massive size and dramatic growth over the past four decades. Now, with better data, the effects of state regulation can be studied more comprehensively as well.

