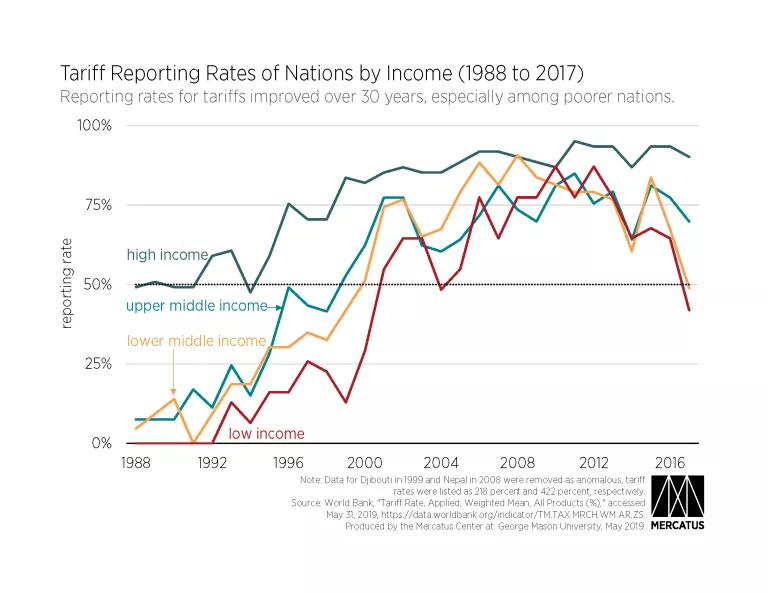
Reporting Rates for Tariffs Have Improved Globally
The World Bank collects data on various nations’ tariff rates each year, but there are reporting gaps. The World Bank breaks nations down into four income groups: high, upper middle, lower middle, and low. High-income nations have had more complete reporting for as long as there have been records. More middle- and low-income nations are now reporting their tariff rates than previously. From 1988 through 1998, the only income group for which more than half of nations reported their tariff rate was the high-income group. In 1999, upper-middle-income nations passed the 50 percent reporting bar, and in 2000 so did lower-middle-income nations. From 2001 onward, all income groups had at least half of all nations reporting, with exceptions in only two years: in 2004, low-income nations did not meet the 50 percent threshold; and in 2017, low-income and lower-middle-income nations did not meet this threshold.
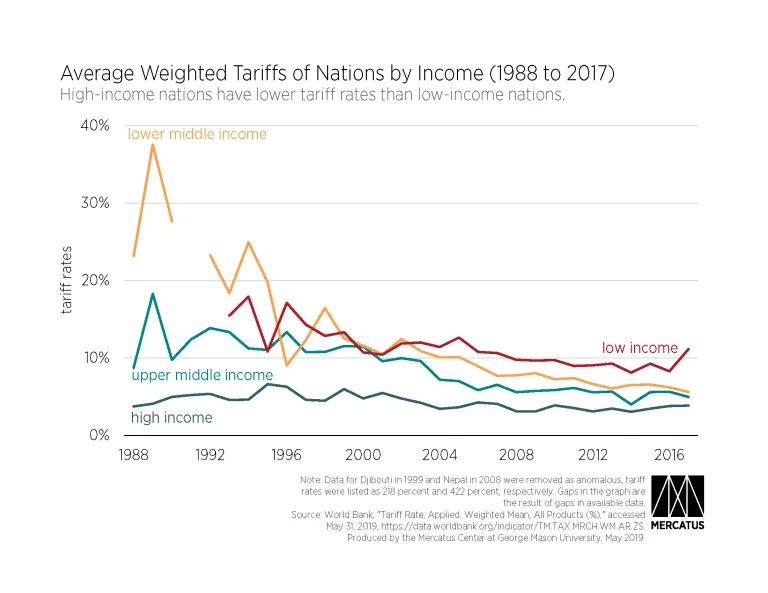
Global Effective Tariff Rates Have Been Falling for Decades
For the middle- and low-income categories of nations, tariff rates have been falling since 1988, even taking into account the reporting problems of lower-income nations. High-income nations’ tariffs have remained relatively stable over that same period. There are some missing data in early years owing to the previously mentioned lack of reporting from poorer nations. Unsurprisingly, the data for years with lackluster reporting are noisier than data for later years. Despite this noise, there is a clear pattern in all four national income groups that tariff rates are falling over time. There was a slight rise in tariffs for the low-income group in 2017, but as noted above, 2017 is one of the exceptions in later years for which fewer than half of this group reported. As such, this may represent an actual increase for these nations, or it may represent noise owing to fewer countries being included. None of the other three groups show this pattern in 2017—only the low-income group.
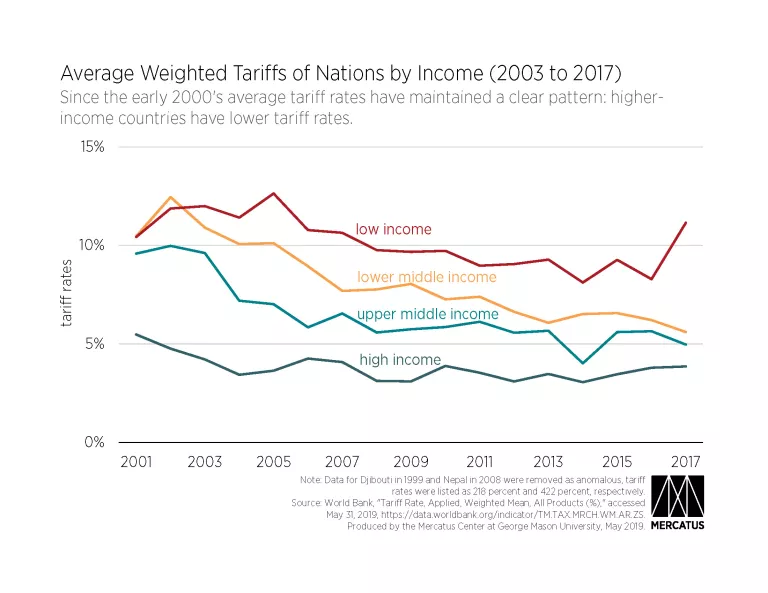
High-Income Nations Average Lower Effective Tariff Rates
Examining only the more recent years, where all income groups have more thorough reporting, there is a clear delineation in the tariff rates of nations of different incomes. The average tariff rate of high-income nations is consistently lower than the tariff rate of upper-middle-income nations. The pattern follows through the other groups as well, with upper-middle-income countries having lower average tariffs than lower-middle-income, and lower-middle-income countries having lower rates than low-income-nations.
Even examining the years with poor reporting in the previous chart (1988 to 2017), tariff rates in high-income nations remain less than those in all other groups in all years. Additionally, with only a few exceptions in the years of particularly poor reporting, upper-middle-income nations have a lower average tariff rate than lower-middle-income and low-income nations.
Low tariffs give the people of a nation access to more goods at lower prices. This improves the relative standard of living for the people in the low-tariff nation. An open, low-tariff economy is also more likely to have opportunities for innovation than nations without easy access to a variety of inexpensive resources.
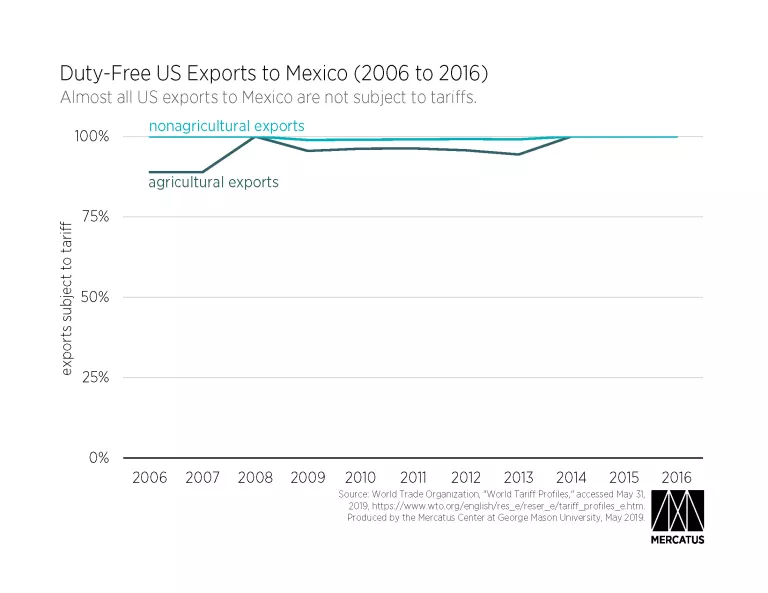
US Goods No Longer Face Tariffs Going to Mexico
While Mexico’s statutory tariff rates are significantly higher than those of the United States, American exports to Mexico face almost no tariffs thanks to the North American Free Trade Agreement (NAFTA). NAFTA eliminated almost all tariffs on US exports to Mexico. Additionally, it reduced import quotas to tariff-rate quotas for some products. While the agreement was passed in 1994, the provisions of NAFTA on nonagricultural goods were set to be fully implemented over 10 years, with some agricultural products’ tariffs being extended an additional five years.
According to data from the World Trade Organization (WTO), the largest percentage of agricultural exports from the United States to Mexico since 2005 subject to tariffs in any year was 11.1 percent (by value) in 2006 and 2007. This is still within the time before NAFTA was in full effect for agricultural exports. From 2008 onward, tariffs were applied to a maximum of 5.6 percent of agricultural products in any year. As for nonagricultural products, the largest percentage subject to tariffs was 1.1 percent in 2009. Since 2014, no US agricultural or nonagricultural exports to Mexico have been subjected to tariffs.
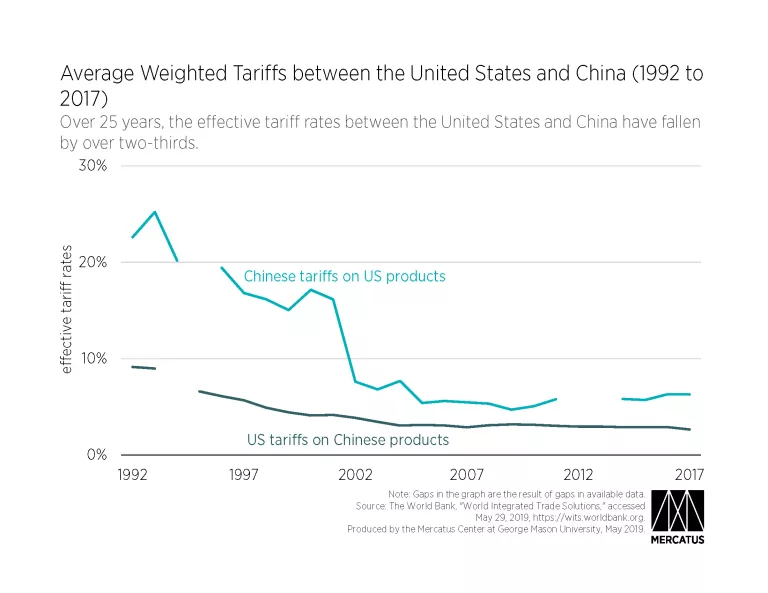
Effective Tariff Rates between the United States and China Have Fallen by More Than Two-Thirds over 25 Years
Despite missing data for a few years, the pattern of tariffs between the United States and China shows that both nations have lowered tariffs on the other’s goods over two and a half decades. In 1992 Chinese tariffs on US products had a weighted average of 22.6 percent, as compared to the 9.1 percent the United States levied on Chinese products. By 2017 these tariffs had fallen to 6.3 percent and 2.7 percent respectively. While China’s tariff rates on the United States are still a little more than double the US tariffs on China, this movement to lower tariff rates between the two largest economies in the world represents a positive step for free trade. The large drop in China’s tariff rates in the early 2000s came as China joined the WTO and lowered its tariff rates. This was a requirement of joining as per China’s Protocol of Accession.
It should be unsurprising that the United States would levy lower tariffs than China, despite the latter’s WTO member status. The United States is a high-income nation, whereas China is qualified by the World Bank as an upper-middle-income nation. As noted above, high-income nations tend to have lower tariffs than the other income groups.
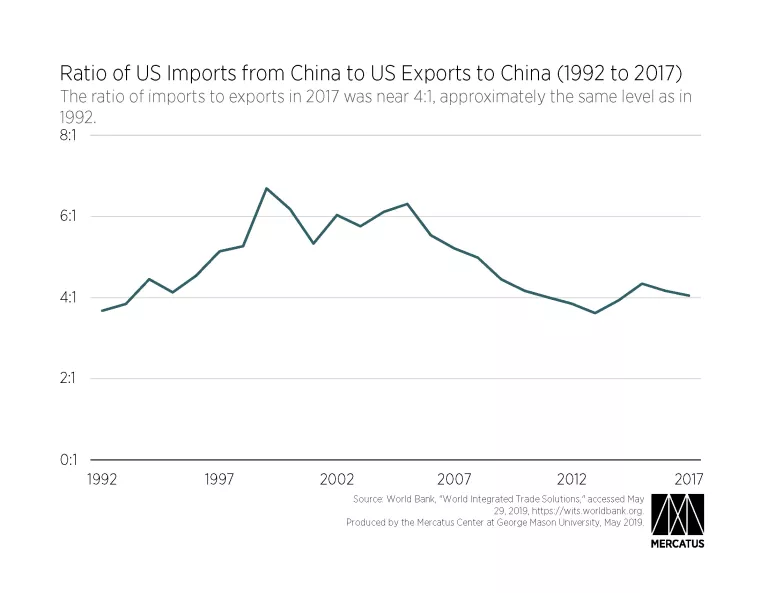
The Ratio of Chinese Imports to US Exports Is Similar to That of 25 Years Ago
Much has been made recently of the United States’ trade deficit in general and its trade deficit with China in particular. While the trade deficit with China has grown in absolute terms, it is important to look at it in proportional terms as well. From 1992 through 2017, imports from China rose from $27.5 billion to $526.0 billion. Meanwhile, exports to China increased from $7.5 billion to $129.9 billion. Over these 25 years, imports grew by more than 19 times what they had been, and exports were close behind in the speed of their growth, growing 17 times larger over the same time. The growth of trade between the United States and China is not only indicative of general economic growth in both nations, but of the US and Chinese economies becoming more intertwined. Over this time, imports from China grew from 5 percent to 22 percent of all US imports. Exports followed a similar pattern, with exports to China growing from 2 percent of all US exports to 8 percent. The percentage of US trade directed to China and coming from China rose approximately fourfold.
Despite an increase in the dollar value of the US trade deficit with China, in actuality the balance of trade is substantially similar to its level in the early 1990s. In 1992 the United States exported $1 worth of goods to China for every $3.67 of goods it imported. This ratio peaked in 1999 at $6.69 of Chinese imports for every $1 of US exports to China. However, in 2005 this ratio began falling back to the levels of the early 1990s, and despite minor fluctuations, it has remained near a 4:1 ratio of Chinese imports to US exports. As of 2017, for each $1 of US exports to China, the US imported $4.05 from China.
A bilateral trade deficit is far from the whole story. Even if the United States had no trade deficit in the aggregate—a goal that isn’t necessarily worth pursuing—it would likely have both deficits and surpluses with particular nations. Perfectly balanced imports and exports with each and everynation is neither probable nor desirable as a policy objective.